. 2018 Nov 7:9:2813-2831.
doi: 10.3762/bjnano.9.263. eCollection 2018.

Controlling surface morphology and sensitivity of granular and porous silver films for surface-enhanced Raman scattering, SERS

Affiliations

Controlling surface morphology and sensitivity of granular and porous silver films for surface-enhanced Raman scattering, SERS

Sherif Okeil et al. Beilstein J Nanotechnol. .

Abstract

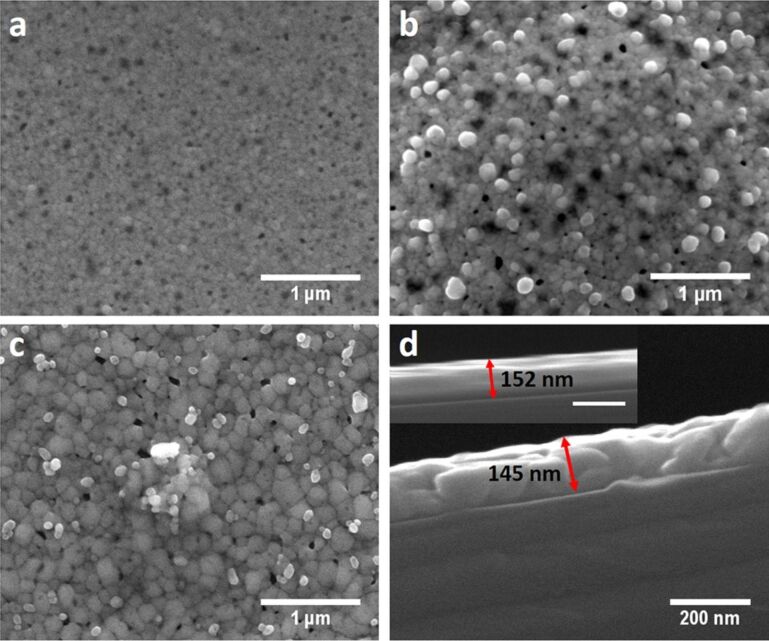
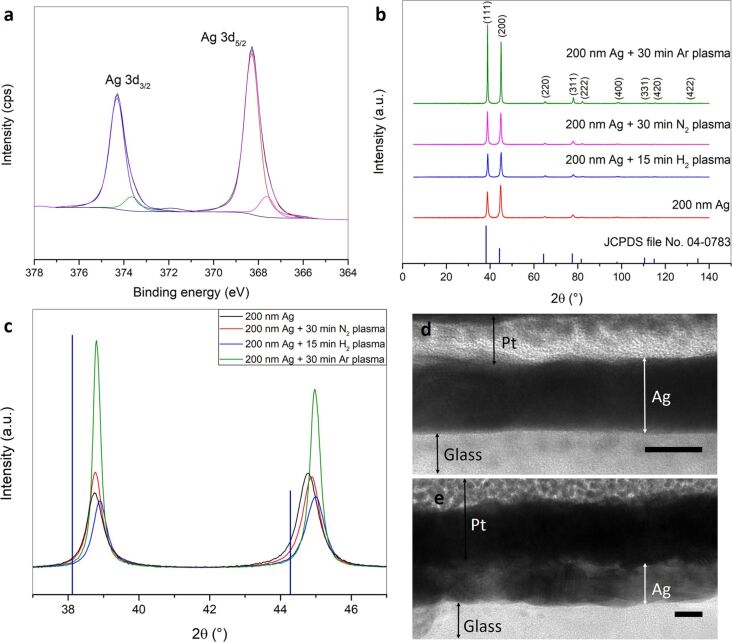
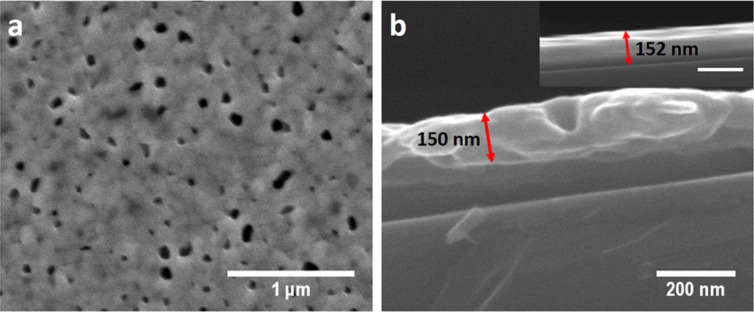
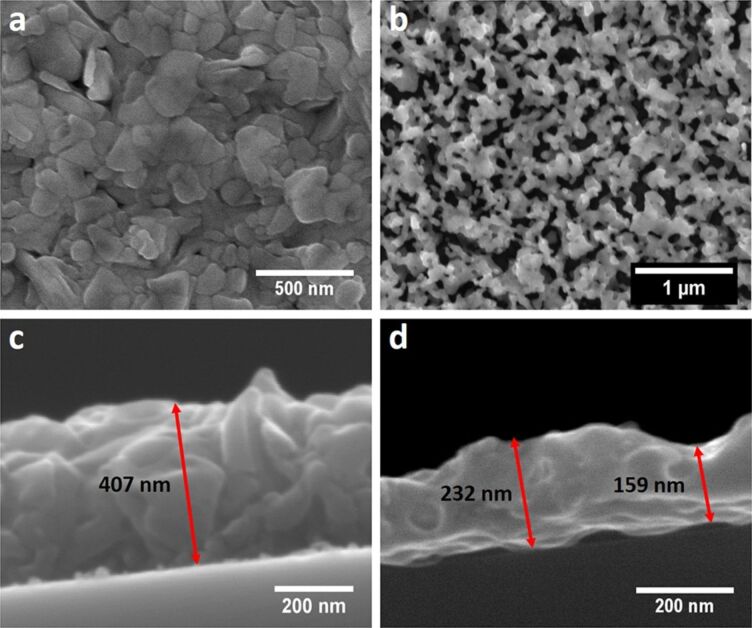
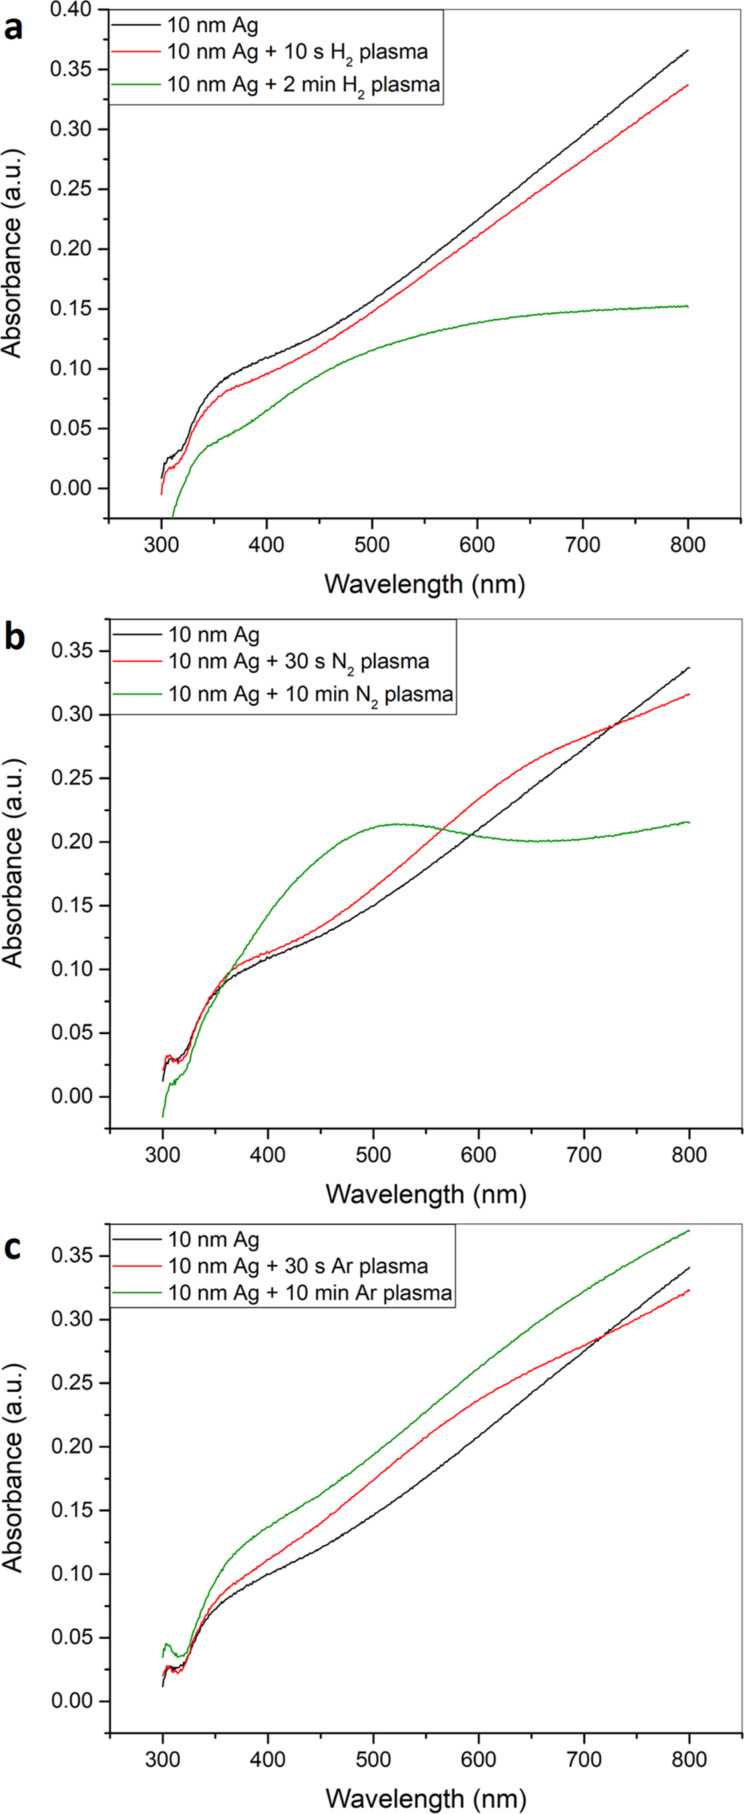
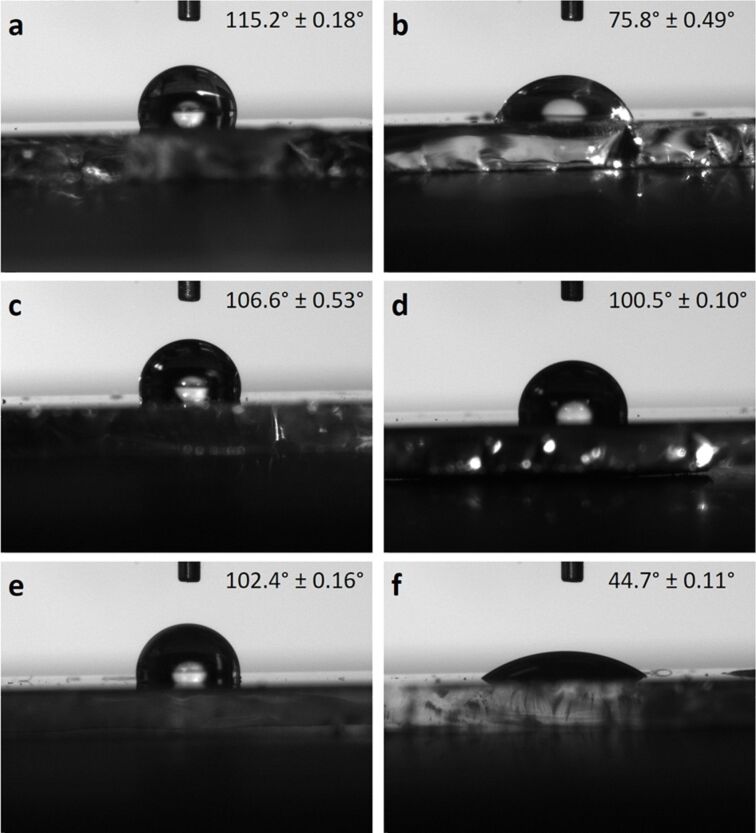
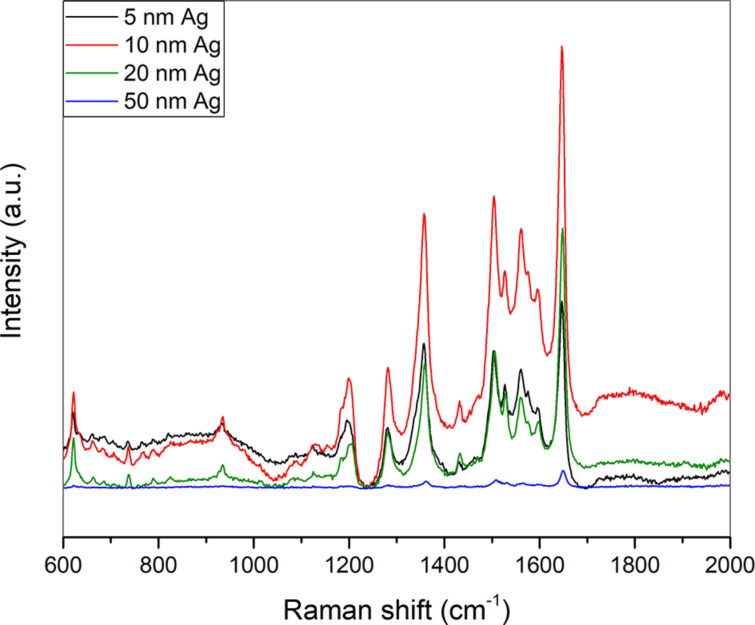
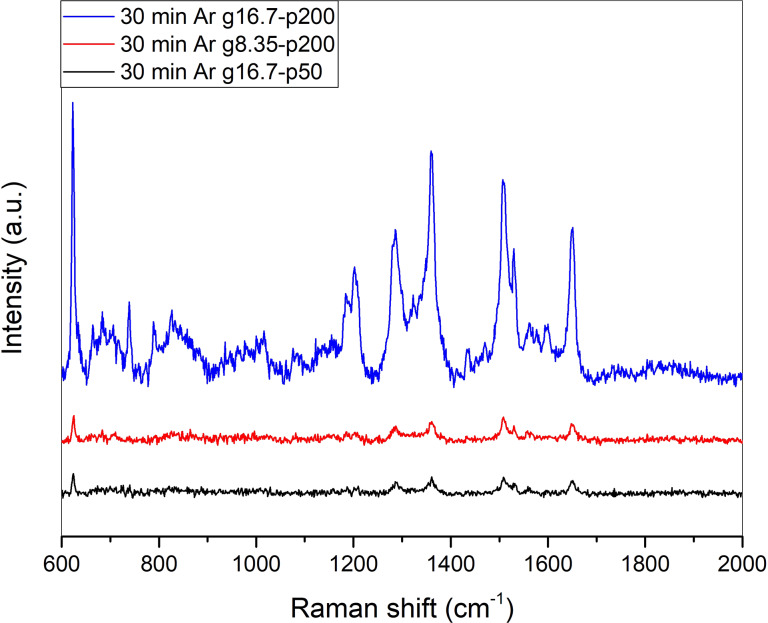
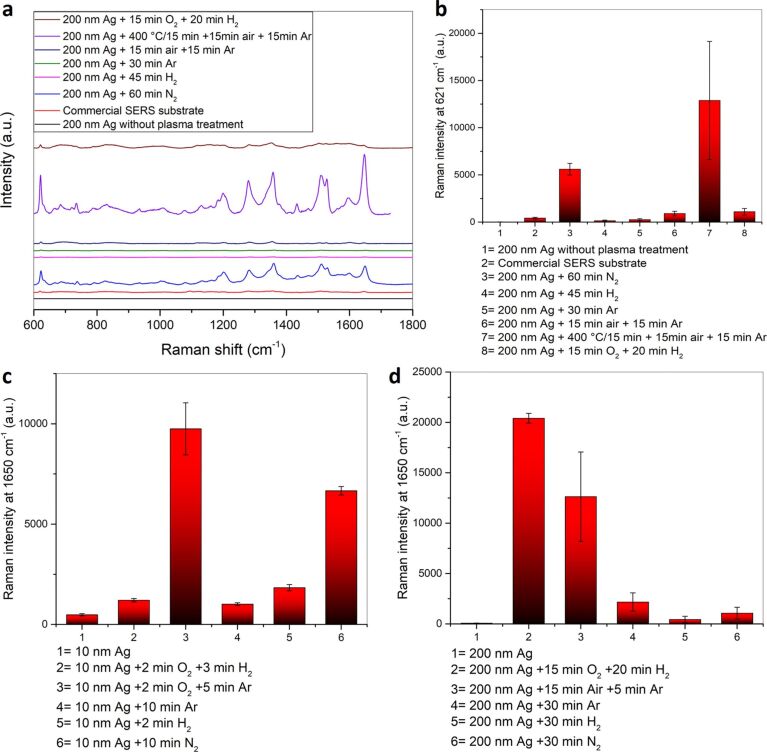
The design of efficient substrates for surface-enhanced Raman spectroscopy (SERS) for large-scale fabrication at low cost is an important issue in further enhancing the use of SERS for routine chemical analysis. Here, we systematically investigate the effect of different radio frequency (rf) plasmas (argon, hydrogen, nitrogen, air and oxygen plasma) as well as combinations of these plasmas on the surface morphology of thin silver films. It was found that different surface structures and different degrees of surface roughness could be obtained by a systematic variation of the plasma type and condition as well as plasma power and treatment time. The differently roughened silver surfaces act as efficient SERS substrates showing greater enhancement factors compared to as prepared, sputtered, but untreated silver films when using rhodamine B as Raman probe molecule. The obtained roughened silver films were fully characterized by scanning electron microscopy (SEM), atomic force microscopy (AFM), X-ray diffraction (XRD), transmission electron microscopy (TEM), X-ray photoelectron (XPS and Auger) and ultraviolet-visible spectroscopy (UV-vis) as well as contact angle measurements. It was found that different morphologies of the roughened Ag films could be obtained under controlled conditions. These silver films show a broad range of tunable SERS enhancement factors ranging from 1.93 × 10² to 2.35 × 10⁵ using rhodamine B as probe molecule. The main factors that control the enhancement are the plasma gas used and the plasma conditions, i.e., pressure, power and treatment time. Altogether this work shows for the first time the effectiveness of a plasma treatment for surface roughening of silver thin films and its profound influence on the interface-controlled SERS enhancement effect. The method can be used for low-cost, large-scale production of SERS substrates.

Keywords: plasma treatment; silver; sputtering; surface roughening; surface-enhanced Raman spectroscopy (SERS).


Figures

Scheme 1
Scheme 1
Overview of the steps involved in the fabrication of the SERS substrates using different rf plasma treatments. (a) 25 s of sputtering leads to a transparent silver film of 10 nm thickness. 8 min of sputtering leads to a non-transparent silver film of 200 nm thickness. (b) The resulting silver films have different SERS activities; the ultrathin film has a higher SERS activity than the thicker silver film. (c) Plasma treatment of the sputtered silver films in a 13.56 MHz rf plasma chamber with different plasma gases in order to increase the surface roughness and nanoporosity of the silver films. (d) A single plasma treatment (hydrogen, nitrogen or argon plasma) mainly results in an increase of the surface roughness of the sputtered silver films and to an increase of the SERS activity. (e) Oxidation/reduction plasma treatment with various gases results in the formation of complex three-dimensional nanoporous silver structures with very strong SERS activity.
Figure 1
Figure 1
(a) Photograph of sputtered silver films on glass substrates with different thicknesses. From left to right: 5, 10, 20, 50 and 200 nm. (b) Photograph showing the mirror-like appearance of the 200 nm silver film. SEM images of (c) 10 nm and (d) 200 nm silver films. AFM images of (e) 10 nm (Rq = 2.02 nm) and (f) 200 nm (Rq = 2.79 nm) sputtered silver films.
Figure 2
Figure 2
SEM image of a 200 nm sputtered silver film treated with hydrogen plasma (g12-p200) for (a) 5 min, (b) 30 min (taken at 45° tilt) and (c) 45 min at 100000× magnification showing the formation of etched holes and increasing grain structure of the silver film. (d) Cross-sectional SEM image of a 200 nm sputtered silver film after 30 min of hydrogen plasma treatment (g12-p200) depicting the actual lowered thickness of the hydrogen plasma-treated silver films compared to the as-sputtered silver film seen in the inset (scale bar: 200 nm). The blue arrow indicates a hole in the hydrogen plasma treated silver film.
Figure 3
Figure 3
SEM image of a 200 nm sputtered silver film treated with nitrogen plasma (g12-p200) for (a) 10 min, (b) 30 min and (c) 60 min at 50000× magnification. (d) Cross-sectional SEM image of 200 nm sputtered silver film treated with nitrogen plasma (g12-p200) for 30 min showing the actual thickness of the prepared silver film after nitrogen plasma treatment compared to the as-sputtered silver film seen in the inset (scale bar is 200 nm).
Figure 4
Figure 4
(a) Deconvoluted XPS Ag 3d spectrum for 200 nm Ag + 30 min nitrogen plasma treatment (g12-p200). (b, c) XRD of 200 nm Ag, 200 nm Ag + 15 min hydrogen plasma treatment (g12-p200), 200 nm Ag + 30 min nitrogen plasma treatment (g12-p200), 200 nm Ag + 30 min argon plasma (g16.7-p200) and their comparison with standard XRD pattern for silver as reference (JCPDS file No. 04-0783). Cross-sectional TEM (FIB) images of (d) an as-sputtered 10 nm silver film and (e) 10 nm silver + 5 min nitrogen plasma treatment (g12-p200). Scale bar: 10 nm.
Figure 5
Figure 5
(a) SEM image of 200 nm sputtered silver film treated with argon plasma (g16.7-p200) for 30 min. (b) Cross-sectional SEM image of 200 nm sputtered silver film treated with argon plasma (g16.7-p200) for 30 min showing the actual thickness after argon plasma treatment compared to the as-sputtered silver film shown in the inset (scale bar: 200 nm).
Figure 6
Figure 6
SEM images of a 200 nm sputtered silver film treated with (a) oxygen plasma (g12-p200) for 15 min and (b) after reducing the oxidized silver film with hydrogen plasma (g12-p200) for 20 min. Cross-sectional SEM image of 200 nm sputtered silver film treated with (c) oxygen plasma (g12-p200) for 15 min and (d) after reducing the oxidized silver film with hydrogen plasma (g12-p200) for 20 min showing the actual thickness of the prepared silver film after plasma treatment.
Figure 7
Figure 7
SEM image (10000× magnification) of a 200 nm sputtered silver film heated at 400 °C for 15 min followed by plasma treatment with oxygen plasma (g12-p200) for 10 min and reduction with hydrogen plasma (g12-p200) for another 10 min. The inset shows particles at 50000× magnification.
Figure 8
Figure 8
SEM images of a 200 nm sputtered silver film treated with (a) a mixture of argon (8 sccm) and oxygen (4 sccm) in an rf plasma (200 W) for 15 min followed by reduction using a pure argon plasma (g16.7-p200) for 15 min; the inset displays a photograph of the top and the bottom (with black spot) side of the silver film on glass, (b) air plasma (g12-p200) for 15 min followed by reduction with argon plasma (g16.7-p200) for 20 min, (c) air plasma (g12-p200) for 30 min followed by reduction with argon plasma (g16.7-p200) for 20 min and (d) 200 nm sputtered silver film heated at 400 °C for 15 min followed by plasma treatment with air plasma (g12-p200) for 15 min and reduction with argon plasma (g16.7-p200) for another 15 min. The insets are at a 100000× magnification (scale bar: 500 nm).
Figure 9
Figure 9
UV–vis spectra of 10 nm sputtered silver films treated with (a) hydrogen plasma, (b) nitrogen plasma and (c) argon plasma for different times.
Figure 10
Figure 10
Water contact angle measurements on (a) 200 nm Ag, (b) 200 nm Ag + 15 min hydrogen plasma (g12-p200), (c) 200 nm Ag + 10 min nitrogen plasma (g12-p200), (d) 200 nm Ag + 60 min nitrogen plasma (g12-p200), (e) 200 nm Ag + 15 min oxygen plasma (g12-p200) + 20 min hydrogen plasma (g12-p200) and (f) 200 nm Ag + 15 min air plasma (g12-p200) + 20 min argon plasma (g16.7-p200).
Figure 11
Figure 11
SERS spectra of 10−6 M RhB on sputtered silver films of different thicknesses.
Figure 12
Figure 12
(a) SERS spectra of 10−6 M RhB deposited on a 10 nm silver film treated with hydrogen plasma (g12-p200) using a 514.5 nm laser. (b) Comparison of the average Raman intensities at 1650 cm−1. (c) SERS spectra of 10−6 M RhB on 200 nm Ag treated with hydrogen plasma (g12-p200) using a 632.8 nm laser. (d) SERS spectra of 10−6 M RhB on a 10 nm silver film treated with nitrogen plasma (g12-p200) using a 514.5 nm laser. (e) Comparison of the average Raman intensities at 1650 cm−1. (f) SERS spectra of 10−6 M RhB on a 200 nm silver flm treated with nitrogen plasma (g12-p200) using a 632.8 nm laser.
Figure 13
Figure 13
SERS spectra of 10−6 M RhB on a 200 nm silver film treated with argon plasma for 30 min using different parameters under 632.8 nm laser excitation.
Figure 14
Figure 14
(a) SERS spectra of 10−6 M RhB on a 200 nm silver film treated with different times and parameters of oxygen and hydrogen plasma using 514.5 nm laser as excitation source. (b) Comparison of the average Raman intensities at 1650 cm−1. (c) SERS spectra of 10−6 M RhB on a 200 nm silver film treated with different oxidizing and reducing plasmas using 632.8 nm laser. (d) Comparison of the average Raman intensities at 621 cm−1.
Figure 15
Figure 15
(a) Comparison of the SERS spectra of 10−6 M RhB on different SERS substrates and on a commercial SERS substrate using a 632.8 nm laser. (b) Comparison of the average Raman intensities at 621 cm−1. Comparison of the average Raman intensities at 1650 cm−1 on different SERS substrates produced through different plasma treatments on (c) 10 nm and (d) 200 nm sputtered silver films using a 532 nm laser.
Figure 16
Figure 16
Comparison of the SERS spectra of 10-6 M RhB on different SERS substrates prepared through oxidation of 200 nm silver film with air plasma (g12-p200) for 15 min followed by reduction with an argon plasma (g16.7-p200) for different times using (a) 532 nm and (c) 632.8 nm laser. Comparison of the average Raman intensities at (b) 1650 cm-1 (532 nm laser excitation) and (d) 621 cm-1 (632.8 nm laser excitation) on the corresponding substrates.

Similar articles

Cited by

References

    1. Sharma B, Frontiera R R, Henry A-I, Ringe E, Van Duyne R P. Mater Today. 2012;15:16–25. doi: 10.1016/s1369-7021(12)70017-2. - DOI
    1. Fleischmann M, Hendra P J, McQuillan A J. Chem Phys Lett. 1974;26:163–166. doi: 10.1016/0009-2614(74)85388-1. - DOI
    1. Albrecht M G, Creighton J A. J Am Chem Soc. 1977;99:5215–5217. doi: 10.1021/ja00457a071. - DOI
    1. Jeong J W, Arnob M M P, Baek K-M, Lee S Y, Shih W-C, Jung Y S. Adv Mater. 2016;28(39):8695–8704. doi: 10.1002/adma.201602603. - DOI - PubMed
    1. Kneipp K. Phys Today. 2007;60:40–46. doi: 10.1063/1.2812122. - DOI

LinkOut - more resources