

Trends and Disparities in Diet Quality Among US Adults by Supplemental Nutrition Assistance Program Participation Status
- PMID: 30498812
- PMCID: PMC6258006
- DOI: 10.1001/jamanetworkopen.2018.0237
Trends and Disparities in Diet Quality Among US Adults by Supplemental Nutrition Assistance Program Participation Status
Abstract
Importance: Unhealthful diet is a top contributor to chronic diseases in the United States. There are growing concerns about disparities in diet among US adults, especially for those who participate in the Supplemental Nutrition Assistance Program (SNAP), the largest federal food assistance program. It remains unclear how these disparities may have changed over time.
Objective: To assess whether disparities in key food groups and nutrients according to participation and eligibility for SNAP have persisted, improved, or worsened over time among US adults.
Design setting and participants: This survey study examined a nationally representative sample of 38 696 adults aged 20 years or older: 6162 SNAP participants, 6692 income-eligible nonparticipants, and 25 842 higher-income individuals from 8 cycles of the National Health and Nutrition Examination Survey (1999-2014). Data analysis was conducted between January 1, 2017, and December 31, 2017.
Exposures: Survey-weighted, energy-adjusted diet by SNAP participation status.
Main outcomes and measures: Mean diet scores and proportions of US adults meeting poor, intermediate, or ideal diet scores based on the American Heart Association (AHA) 2020 Strategic Impact Goals for diet, including 8 components (fruits and vegetables; whole grains; fish and shellfish; sugar-sweetened beverages; sodium; nuts, seeds, and legumes; processed meats; and saturated fat).
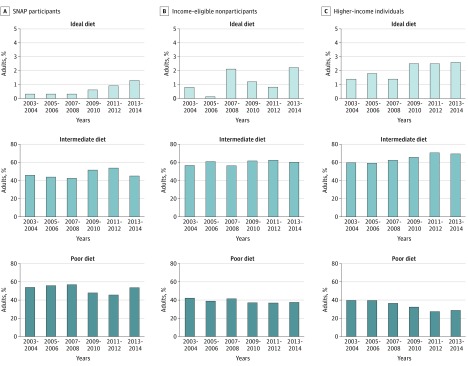
Results: The survey included 38 696 respondents (20 062 female [51.9%]; 18 386 non-Hispanic white [69.8%]; mean [SD] age, 46.8 [14.8] years). Participants of SNAP were younger (mean [SD] age, 41.4 [15.6] years) than income-eligible nonparticipants (mean [SD] age, 44.9 [19.6] years) or higher-income individuals (mean [SD] age, 47.8 [13.6] years); more likely to be female (3552 of 6162 [58.6%] vs 3504 of 6692 [54.8%] and 13 006 of 25 842 [50.4%], respectively); and less likely to be non-Hispanic white (2062 of 6162 [48.2%] vs 2594 of 6692 [56.0%] and 13 712 of 25 842 [75.8%], respectively). From surveys conducted in 2003 and 2004 to those conducted in 2013 and 2014, SNAP participants had less improvement in AHA diet scores than both income-eligible nonparticipants and higher-income individuals (change in mean score = 0.57 [95% CI, -2.18 to 0.33] vs 2.56 [95% CI, 0.36-4.76] and 3.84 [95% CI, 2.39-5.29], respectively; P = .04 for interaction). Disparities persisted for most foods and nutrients and worsened for processed meats, added sugars, and nuts and seeds. In 2013 to 2014, a higher proportion of SNAP participants had poor diet scores compared with income-eligible nonparticipants and higher-income individuals (461 of 950 [53.5%] vs 247 of 690 [38.0%] and 773 of 2797 [28.7%]; P < .001 for difference), and a lower proportion had intermediate diet scores (477 of 950 [45.3%] vs 428 of 690 [59.8%] and 1933 of 2797 [68.7%]; P < .001 for difference). The proportion of participants with ideal diet scores was low in all 3 groups (12 of 950 [1.3%] vs 15 of 690 [2.2%] and 91 of 2797 [2.6%]; P = .26 for difference).
Conclusions and relevance: Dietary disparities persisted or worsened for most dietary components among US adults. Despite improvement in some dietary components, SNAP participants still do not meet the AHA goals for a healthful diet.
Conflict of interest statement
Conflict of Interest Disclosures:
Figures
Comment in
-
Disparities in Diet Quality: No SNAPPY Solutions.JAMA Netw Open. 2018 Jun 1;1(2):e180238. doi: 10.1001/jamanetworkopen.2018.0238. JAMA Netw Open. 2018. PMID: 30646070 No abstract available.
References
-
- Tiehen L, Jolliffe D, Gundersen C. Alleviating Poverty in the United States: The Critical Role of SNAP Benefits. Washington, DC: US Department of Agriculture; 2012. https://www.ers.usda.gov/webdocs/publications/44963/17741_err132_reports.... Accessed April 1, 2018.
-
- US Department of Agriculture Food and Nutrition Service SNAP monthly data. https://www.fns.usda.gov/pd/supplemental-nutrition-assistance-program-snap. Updated March 28, 2018. Accessed April 1, 2018.
