. 2018 Nov 29;175(6):1607-1619.e15.
doi: 10.1016/j.cell.2018.11.012.

Inflammatory Cytokine TNFα Promotes the Long-Term Expansion of Primary Hepatocytes in 3D Culture

Affiliations

Inflammatory Cytokine TNFα Promotes the Long-Term Expansion of Primary Hepatocytes in 3D Culture

Weng Chuan Peng et al. Cell. .

Abstract

In the healthy adult liver, most hepatocytes proliferate minimally. However, upon physical or chemical injury to the liver, hepatocytes proliferate extensively in vivo under the direction of multiple extracellular cues, including Wnt and pro-inflammatory signals. Currently, liver organoids can be generated readily in vitro from bile-duct epithelial cells, but not hepatocytes. Here, we show that TNFα, an injury-induced inflammatory cytokine, promotes the expansion of hepatocytes in 3D culture and enables serial passaging and long-term culture for more than 6 months. Single-cell RNA sequencing reveals broad expression of hepatocyte markers. Strikingly, in vitro-expanded hepatocytes engrafted, and significantly repopulated, the injured livers of Fah-/- mice. We anticipate that tissue repair signals can be harnessed to promote the expansion of otherwise hard-to-culture cell-types, with broad implications.

Keywords: 3D culture; TNFα; Wnt; hepatocyte; inflammatory cytokine; injury; liver; organoid; regeneration.


Conflict of interest statement

DECLARATION OF INTERESTS

The authors declare no competing interests.

Figures

Figure 1.
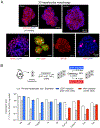
Figure 1.. TNFα promotes the expansion of primary hepatocytes in 3D culture.
(A)Confocal (montage) and brightfield images of freshly isolated primary mouse hepatocytes cultured in expansion media, with or without TNFα for 2 weeks. Hoechst intensities are shown on the same scale. (B) Colony forming efficiency of hepatocytes cultured with or without TNFα. Approximately 1,000 cells were seeded and colony count was performed after 2 weeks. Data are represented as mean ± SEM of three biological replicates. (C) Images of hepatocyte cultures at passage 1. Cells cultured continuously without TNFα (top), with TNFα (middle), or with TNFα withdrawn after passaging (bottom). Phase-contrast images shown to highlight lipid droplets (arrowheads). (D) Scatter plots showing Hoechst intensity per hepatocyte colony. Hepatocytes were cultured continuously with TNFα, or with TNFα withdrawn from culture media at passage 1 (top) or at passage 8 (bottom). Measurements were performed at least one week after TNFα withdrawal. Mann-Whitney U test, ****p < 0.0001. Data for each biological replicate are shown. (E) Representative images of long-term cultured hepatocytes in the presence of TNFα.
Figure 2.
Figure 2.. Expression and modulation of functional markers in 3D hepatocytes.
(A) Confocal images (Z-stack projection) of hepatocyte colonies constitutively expressing membrane tdTomato (top) or stained for various markers and visualized by immunofluorescence (bottom). Arrows mark CD26+ bile canaliculi. Scale bars = 50 μm (top), 20 μm (bottom). (B) Gene expression analysis of primary hepatocytes and cultured hepatocytes evaluated by q-PCR. Data are represented as mean ± SEM of three independent measurements.
Figure 3.
Figure 3.. 3D hepatocytes display functional activities.
(A)Albumin secretion measured by mouse albumin ELISA assay (left) and CYP3A11 activity measured by P450-Glo™ CYP3A assay using luciferin-IPA as a substrate (right). (B)LDL uptake visualized by LDL conjugated with DyLight™-550. (C) Fluorescein diacetate uptake and secretion into bile canaliculi structures (arrowheads). (D) Glycogen storage visualized by PAS staining. (E) Overlay of wide-field fluorescence and BF images of 3D hepatocytes expressing GFP introduced by lentiviral transduction. (F) Confocal Z stack-projection of 3D hepatocytes expressing mTdTomato and GFP-HUVECs aggregate, two weeks after the initiation of co-culture.
Figure 4.
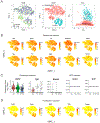
Figure 4.. Single-cell RNA-seq reveals broad expression of hepatocyte markers and the presence of a subset of cycling cells.
(A)t-SNE projection of single cells (n = 1192) labeled by sex (left) or cycling state (middle) and the projection of the same cells onto the first two PCs (right). (B)t-SNE plots indicating the (log-scale) expression of representative hepatocyte markers. (C) Violin plots showing the (log-scale) expression of representative hepatocyte markers and the absence of biliary markers, ‘exp’ = expansion, ‘ind’ = induction and primary hepatocytes, n = subset of 100 cells shown. (D) t-SNE plots indicating the (log-scale) expression of representative markers associated with proliferation. .Related to Figure S5.
Figure 5.
Figure 5.. Expression of regeneration- associated markers in expanding media and upregulation of functional genes in induction media.
(A) t-SNE plot of 3D hepatocytes in expansion (exp) or induction (ind) media and primary hepatocytes. (B) Violin plots of select top DEGs (log-scale) in exp hepatocytes relative to primary hepatocytes, with ind hepatocytes included for comparison. DEGs are determined by the top Wilcoxon rank sum test scores. Also shown in Figure S5A. (C) Violin plots showing the (log-scale) expression of representative markers associated with liver regeneration. (D) Violin plots showing the (log-scale) expression of selected upregulated genes in ind hepatocytes relative to exp hepatocytes, with primary hepatocytes included for comparison. Also shown in Figure S5B. Related to Figure S5.
Figure 6.
Figure 6.. Cultured hepatocytes can engraft in Fah-deficient mice and express hepatocyte markers.
(A) Montage of entire liver sections stained with FAH antibody. Two biological samples are shown here. See Figure 6SA for additional biological replicates. (B) Immunohistochemistry for FAH and hematoxylin showing a low-magnification view of engraftment of FAH+ hepatocytes into FAH−/− recipient livers. (C) Immunofluorescence staining for FAH and the hepatocyte marker HNF4α. (D-G) Immunofluorescence staining for various markers on serial sections. The dashed line demarcates the boundary between FAH+ and FAH− cells. Arrows mark membrane GLT1 staining. (H) Immunofluorescence staining for FAH and the biliary marker SOX9 (arrow). Inset, a higher magnification of the bile duct. Scale bars = 100 μm, unless stated otherwise.
Figure 7.
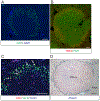
Figure 7.. Active Wnt signaling at the FAH+ clone boundary.
(A) Wide-field image of an FAH liver section stained for GFP. Donor hepatocytes were derived from Axin2-rtTA;Tet-O-GFP mice (see Experimental Procedures). (B) Overlay of immunofluorescence staining for TBX3 and FAH. (C) Overlay of immunofluorescence staining for KI67 and GFP. Arrows mark nuclei that are double positive for both GFP and KI67. (D) In situ hybridization for Rspo3 counterstained with hematoxylin. Dashed line outlines the FAH clone boundary. Scale bars = 100 μm.

Similar articles

Cited by

References

    1. Akerman P, Cote P, Yang SQ, McClain C, Nelson S, Bagby GJ, and Diehl AM (1992). Antibodies to tumor necrosis factor-alpha inhibit liver regeneration after partial hepatectomy. Am. J. Physiol 263, G579–G585. - PubMed
    1. Arnett HA, Mason J, Marino M, Suzuki K, Matsushima GK, and Ting JP (2001). TNF alpha promotes proliferation of oligodendrocyte progenitors and remyelination. Nat. Neurosci 4, 1116–1122. - PubMed
    1. Ashburner M, Ball CA, Blake JA, Botstein D, Butler H, Cherry JM, Davis AP, Dolinski K, Dwight SS, Eppig JT, et al. (2000). Gene ontology: tool for the unification of biology. The Gene Ontology Consortium. Nature Genetics 25, 25–29. - PMC - PubMed
    1. Aurora AB, and Olson EN (2014). Immune modulation of stem cells and regeneration. Cell Stem Cell 15, 14–25. - PMC - PubMed
    1. Azuma H, Paulk N, Ranade A, Dorrell C, Al-Dhalimy M, Ellis E, Strom S, Kay MA, Finegold M, and Grompe M (2007). Robust expansion of human hepatocytes in Fah−/−/Rag2−/−/Il2rg−/− mice. Nat Biotechnol 25, 903–910. - PMC - PubMed

Publication types

Substances