. 2018 Nov 30;14(11):e1007390.
doi: 10.1371/journal.pgen.1007390. eCollection 2018 Nov.

Danger signals activate a putative innate immune system during regeneration in a filamentous fungus

Affiliations

Danger signals activate a putative innate immune system during regeneration in a filamentous fungus

Elizabeth Medina-Castellanos et al. PLoS Genet. .

Abstract

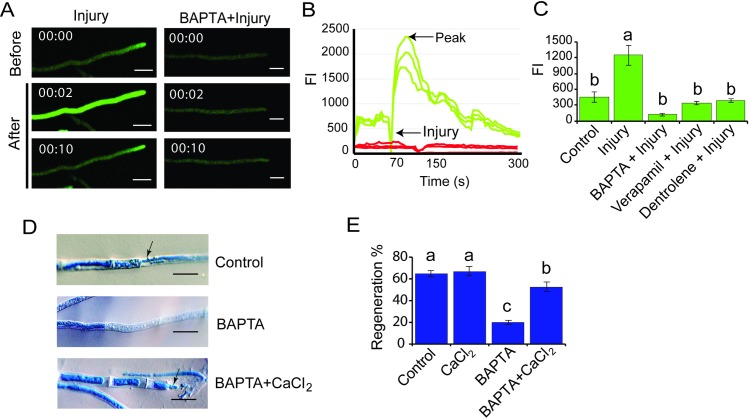
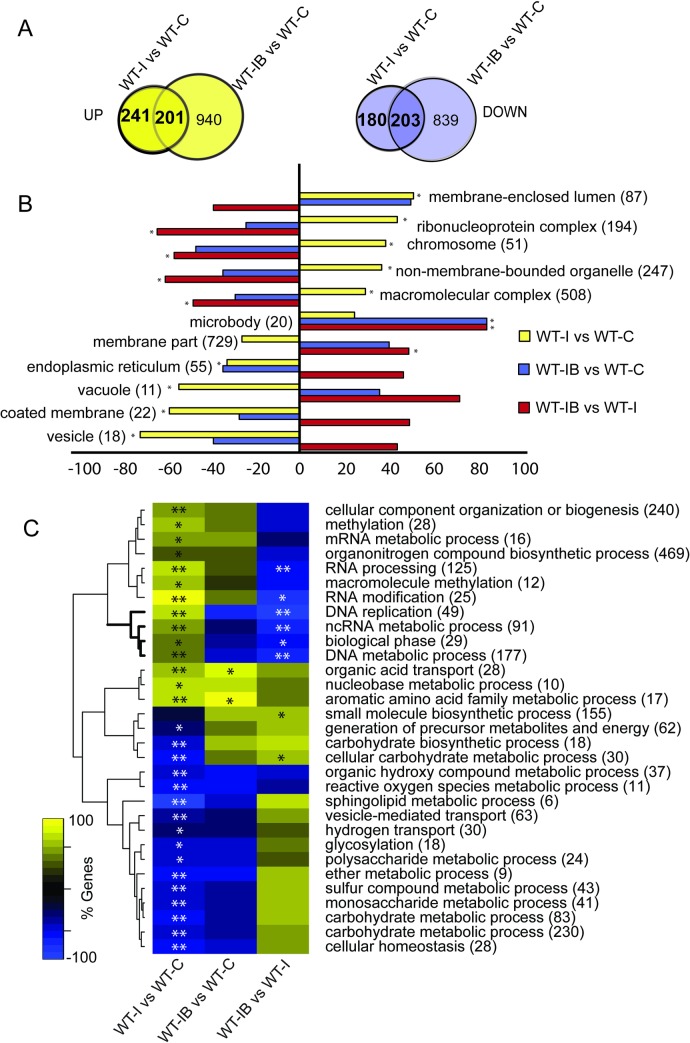
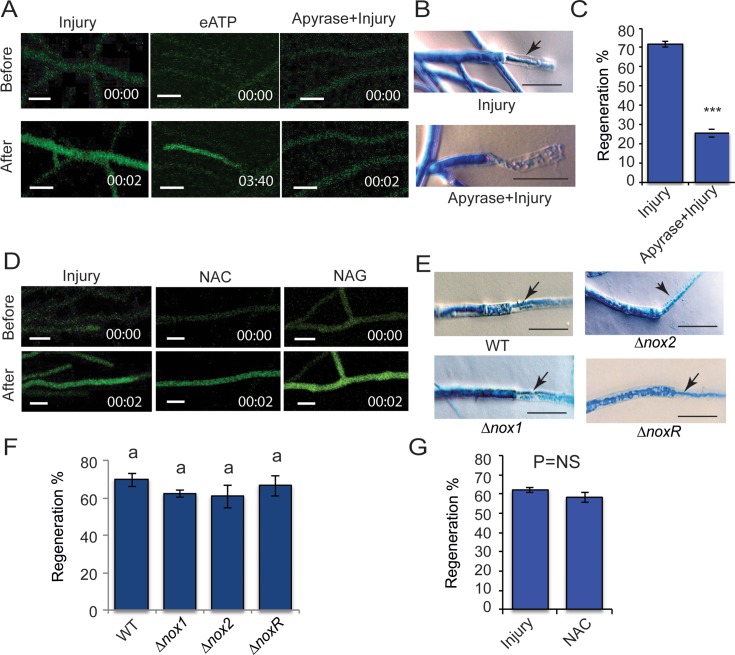
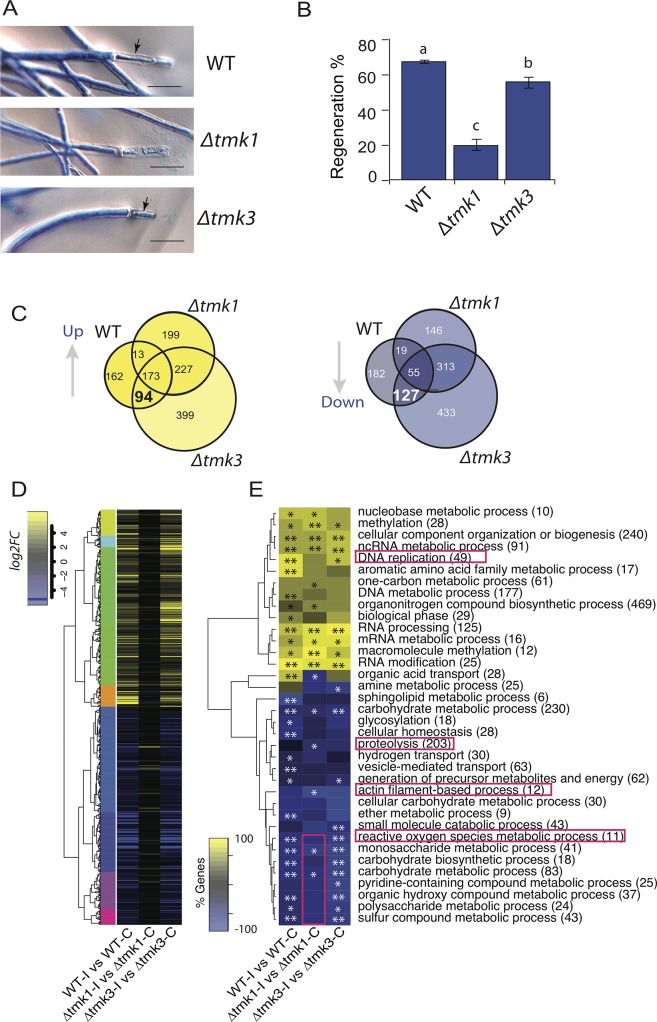
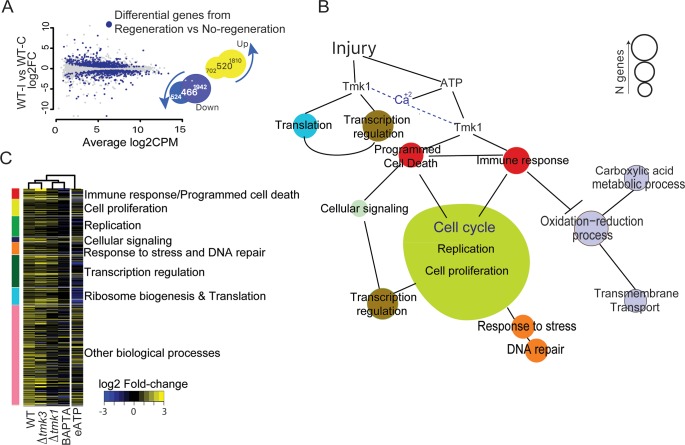
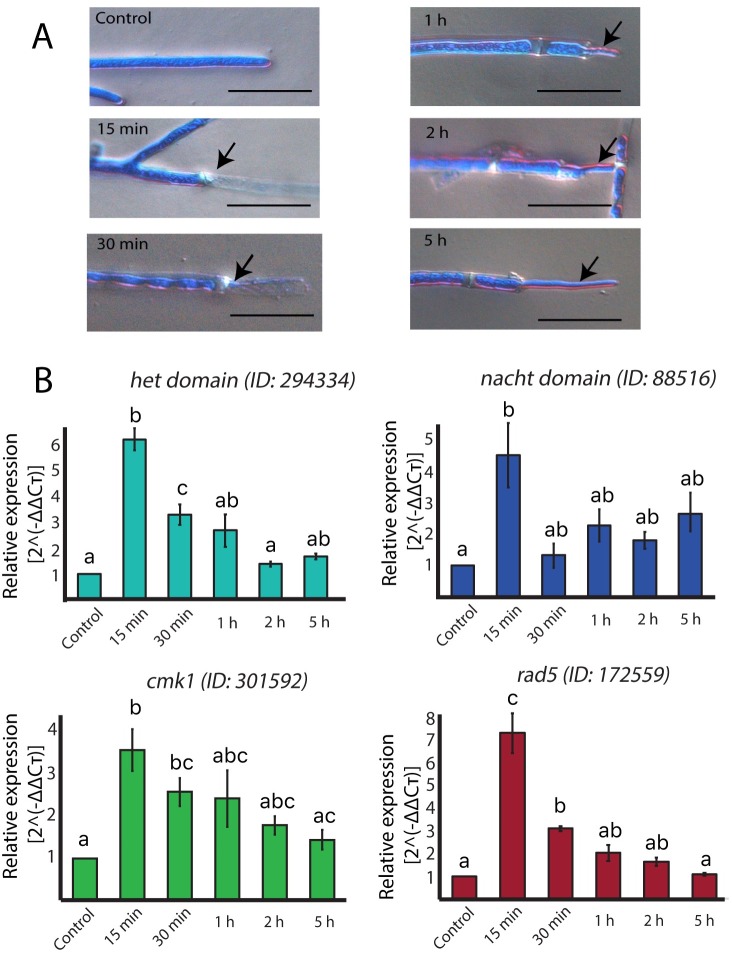
The ability to respond to injury is a biological process shared by organisms of different kingdoms that can even result in complete regeneration of a part or structure that was lost. Due to their immobility, multicellular fungi are prey to various predators and are therefore constantly exposed to mechanical damage. Nevertheless, our current knowledge of how fungi respond to injury is scarce. Here we show that activation of injury responses and hyphal regeneration in the filamentous fungus Trichoderma atroviride relies on the detection of two danger or alarm signals. As an early response to injury, we detected a transient increase in cytosolic free calcium ([Ca2+]c) that was promoted by extracellular ATP, and which is likely regulated by a mechanism of calcium-induced calcium-release. In addition, we demonstrate that the mitogen activated protein kinase Tmk1 plays a key role in hyphal regeneration. Calcium- and Tmk1-mediated signaling cascades activated major transcriptional changes early following injury, including induction of a set of regeneration associated genes related to cell signaling, stress responses, transcription regulation, ribosome biogenesis/translation, replication and DNA repair. Interestingly, we uncovered the activation of a putative fungal innate immune response, including the involvement of HET domain genes, known to participate in programmed cell death. Our work shows that fungi and animals share danger-signals, signaling cascades, and the activation of the expression of genes related to immunity after injury, which are likely the result of convergent evolution.


Conflict of interest statement

The authors have declared that no competing interests exist.

Figures

Fig 1
Fig 1. Role of Ca2+ in the early response to injury.
A. Live-cell imaging. The T. atroviride WT strain carrying the sensor GCamP6 was damaged with a scalpel, or exposed to BAPTA and then damaged. Images were obtained using time-lapse confocal microscopy. Scale bar = 10 μM. Time shown in seconds. B. The graph shows the Fluorescence Intensity (FI) per hypha of the WT strain carrying the sensor GCamP6 for three representative hyphae during injury (green line) and treated with BAPTA and then injured (red lines) for three representative hyphae. C. Effect of calcium channels inhibitors on [Ca2+]c. The graph shows the mean maximum change of FI approximately 2–6 sec after injury. In each case the WT strain was treated with the indicated Ca2+ inhibitor before injury. Four independent experiments were performed for each treatment. D. Microscopic changes. One hour after injury hyphae were stained with lactophenol cotton blue and examined by light microscopy. Treatments were: Control: normal regeneration response of injured hyphae; BAPTA: hyphae did not regenerate after being exposed to BAPTA for 15 min and then damaged; BAPTA+CaCl2: partial restoration of hyphal regeneration following exposure to BAPTA for 15 min and then addition of 0.34 mM CaCl2. Arrows point to the new hyphae. Scale bar = 10μM. E. Regeneration capacity. The graph shows the percentage of hyphae that regenerate after each treatment. Three independent experiments were performed for each treatment, counting 50 hyphae in each case. C, E. Bars represent the mean ± s.e.m. A one-way ANOVA test, followed by Tukey Honest Significant Differences was used. Different letters indicate significant differences (P < 0.05).
Fig 2
Fig 2. Calcium is essential for the transcriptional response to injury.
A. Venn diagrams show the overlap of the induced (yellow) and repressed (purple) genes of the WT strain in response to injury (WT-I) and in response to injury after BAPTA treatment (WT-IB), as compared to an untreated control (WT-C). B. Enrichment analysis using Cellular Component Gene Ontology (GO) terms, showing the percentage of induced or repressed genes belonging to each category (FDR <0.05*). C. Clustering of significantly enriched Biological Process GO terms, showing the percentage of induced or repressed genes belonging to each category (FDR <0.01**; FDR <0.05*). In B and C, the sign indicates the direction of change, positive/negative being higher/lower in injury than in the control. The number in parenthesis after each GO term indicates the total number of genes in that category.
Fig 3
Fig 3. Role of eATP and ROS in Ca2+ influx and regeneration.
A & D. Live-cell imaging of the T. atroviride WT strain carrying pEM12 treated with 100 μM ATP (eATP) or apyrase and then injured (A) or 30 mM NAC or NAG and then damaged (D), the WT strain subjected only to injury was used as a control. Images were obtained using time-lapse confocal microscopy whilst applying the treatment. Scale bar = 10 μM. Time shown in minutes. B & E. Microscopic changes observed after injury. The photographs in B show the response of the WT strain upon injury or treatment with apyrase for 15 min and then damaged. The images in E show the response of the Δnox1, Δnox2 and ΔnoxR mutants upon damage. Hyphae were stained with lactophenol cotton blue and examined by light microscopy. Arrows point to the new regenerating hyphae. Scale bar = 10 μM. C. The graph shows the percentage of hyphae of the wild type strain that regenerate upon injury or apyrase treatment prior to injury. G. The graph shows the percentage of hyphae of the WT strain that regenerate upon injury and those that regenerate when injured after exposure to 30 mM NAC (NAC). C & G. Bars represent the mean ± s.e.m. A t-test was performed, with a significant (P < 0.001***) or non-significant (P = NS) difference. F. The graph shows the percentage of hyphae in the Δnox1, Δnox2 and ΔnoxR mutants that regenerate upon injury. Bars represent the mean ± s.e.m. A one-way ANOVA was used. There was no significant difference between treatments (P < 0.05) as indicated by P = NS. C, F & G. Three independent experiments were performed for each treatment, counting 50 hyphae in each case. There was no difference between treatments (P < 0.05) as indicated by P = NS.
Fig 4
Fig 4. Tmk1 signaling is required for hyphal regeneration and correct transcriptional response.
A. Microscopic changes observed 1 h after injury in the WT, Δtmk1 and Δtmk3. Hyphae were stained with lactophenol cotton blue and examined by light microscopy. Arrows point to the new hyphae. B. The graph shows the percentage of hyphae that regenerate upon injury in each strain. Three independent experiments were performed for each treatment, counting 50 hyphae in each case. Bars represent the mean ± s.e.m. A one-way ANOVA test, followed by Tukey Honest Significant Differences was used. Different letters indicate significant differences (P < 0.05). C. Venn diagrams showing the overlap between up-regulated and down-regulated genes that respond to injury in the WT, Δtmk1 and Δtmk3 strains. D. Heat map showing the expression profile of the Injury-Responsive Tmk1 dependent (IRK1) genes and their behavior following injury in each strain (FDR < 0.05; Fold-change > 1). E. Heat map with enriched GO biological process terms, showing the percentage of genes belonging to each category (FDR <0.01**; FDR <0.05*). The number in parenthesis after each GO term indicates the total number of genes in each category.
Fig 5
Fig 5. Functional analysis of Regeneration Gene Set.
A. The plot highlights the differentially expressed genes from the “Regeneration vs No-Regeneration” comparison (blue dots) on the results of the WT-Injury vs WT-Control comparison. The Venn diagrams show the intersections between the two comparisons. B. Model based on manual inspection of regeneration genes with enriched Gene Ontology terms. Circle sizes are proportional to the number of genes contained in each category. C. Heatmap of the regeneration genes’ fold-change after injury in the different mutants and pharmacological treatments. Vertical color bar groups genes by GO term, colored as in B. Hierarchical clustering of columns was determined using the hclust function of the stats package in R, and the distance measured using a Pearson correlation and "complete" as the clustering method.
Fig 6
Fig 6. The expression of RGS correlates with the initial stages of regeneration.
A. Microscopic changes observed after injury. Hyphae were stained with lactophenol cotton blue and examined by light microscopy. Regenerating hyphae were photographed 15, 30 minutes, and 1, 2, and 5 hours after injury. Scale bar = 10 μm. Images are representative of the morphological stage of the hyphal population at the indicated time. B. Relative mRNA expression of a Het domain, a Nacht domain encoding genes, and the rad5, and cmk1 genes. The expression is relative to DNA polymerase encoding gene (Id. 53190), which expression does not vary under the tested conditions. Graphs show the results of four biological and three technical replicates. Error bars represent ± s.e.m. A one-way ANOVA test, followed by Tukey test were used to determine significant differences, indicated by different letters (P < 0.05).

References

    1. Sanchez Alvarado A. Regeneration in the metazoans: why does it happen? Bioessays 2000; 22: 578–590. 10.1002/(SICI)1521-1878(200006)22:6<578::AID-BIES11>3.0.CO;2-# - DOI - PubMed
    1. Heil M, Land WG. Danger signals-damaged-self recognition across the tree of life. Front. Plant Sci. 2014; 5: 578 10.3389/fpls.2014.00578 - DOI - PMC - PubMed
    1. Atwal JK, Massie B, Miller FD, Kaplan DR. The TrkB-Shc site signals neuronal survival and local axon growth via MEK and P13-kinase. Neuron 2000; 27: 265–277. - PubMed
    1. Hettenhausen C, Schuman MC, Wu J. MAPK signaling: a key element in plant defense response to insects. Insect Sci. 2015; 22: 157–164. 10.1111/1744-7917.12128 - DOI - PMC - PubMed
    1. Choi J, Tanaka K, Cao Y, Qi Y, Qiu J, Liang Y, et al. Identification of a plant receptor for extracellular ATP. Science 2014; 343: 290–294. 10.1126/science.343.6168.290 - DOI - PubMed

Publication types