. 2018 Nov 30;13(11):e0208177.
doi: 10.1371/journal.pone.0208177. eCollection 2018.

Assessing robustness against potential publication bias in Activation Likelihood Estimation (ALE) meta-analyses for fMRI

Affiliations

Assessing robustness against potential publication bias in Activation Likelihood Estimation (ALE) meta-analyses for fMRI

Freya Acar et al. PLoS One. .

Abstract

The importance of integrating research findings is incontrovertible and procedures for coordinate-based meta-analysis (CBMA) such as Activation Likelihood Estimation (ALE) have become a popular approach to combine results of fMRI studies when only peaks of activation are reported. As meta-analytical findings help building cumulative knowledge and guide future research, not only the quality of such analyses but also the way conclusions are drawn is extremely important. Like classical meta-analyses, coordinate-based meta-analyses can be subject to different forms of publication bias which may impact results and invalidate findings. The file drawer problem refers to the problem where studies fail to get published because they do not obtain anticipated results (e.g. due to lack of statistical significance). To enable assessing the stability of meta-analytical results and determine their robustness against the potential presence of the file drawer problem, we present an algorithm to determine the number of noise studies that can be added to an existing ALE fMRI meta-analysis before spatial convergence of reported activation peaks over studies in specific regions is no longer statistically significant. While methods to gain insight into the validity and limitations of results exist for other coordinate-based meta-analysis toolboxes, such as Galbraith plots for Multilevel Kernel Density Analysis (MKDA) and funnel plots and egger tests for seed-based d mapping, this procedure is the first to assess robustness against potential publication bias for the ALE algorithm. The method assists in interpreting meta-analytical results with the appropriate caution by looking how stable results remain in the presence of unreported information that may differ systematically from the information that is included. At the same time, the procedure provides further insight into the number of studies that drive the meta-analytical results. We illustrate the procedure through an example and test the effect of several parameters through extensive simulations. Code to generate noise studies is made freely available which enables users to easily use the algorithm when interpreting their results.


Conflict of interest statement

The authors have declared that no competing interests exist.

Figures

Fig 1
Fig 1. Number of publications per coordinate-based meta-analysis algorithm.
Result after a web of science search executed on June 1, 2018. On web of science search terms were ALE meta-analysis for the ALE-algorithm, MKDA meta-analysis for the MKDA algorithm and SDM meta-analysis for the seed-based d mapping algorithm.
Fig 2
Fig 2. Step-by-step overview of the ALE algorithm.
From an entire Statistical Parametric Map (SPM) usually only peak coordinates (foci) are reported. These are entered in an empty brain for every study individually. Spatial uncertainty is accounted for by constructing Gaussian kernels around the foci of which the size depends on the sample size of that study (smaller studies have more spatial uncertainty and larger kernels). The result of this process is a set of MA-maps. An ALE-map is constructed by calculating the union of the MA-maps. Eventually the ALE-map is thresholded to determine at which locations the convergence of foci is larger than can be expected by chance.
Fig 3
Fig 3. Illustrated example of the algorithm used to compute the FSN of a meta-analysis of 15 experiments (k = 15).
The predefined lower boundary is set to 30 (2k) and the predefined upper boundary is set to 150 (10k). First an ALE meta-analysis is run while a number of noise studies equal to the lower boundary is added to the original dataset. If the cluster is no longer statistically significant the FSN is smaller than the predefined minimum. If the cluster is still statistically significant after these noise studies are added, a second analysis is run by adding the number of noise studies defined by the upper boundary. If the cluster is still statistically significant the FSN is larger than the upper boundary, if it is no longer statistically significant the FSN lies somewhere between the predefined lower boundary and upper boundary. To reduce the number of steps needed to be taken to determine the FSN the number of noise studies added in the next step is the average of the lower boundary and upper boundary FSN. Is the cluster still statistically significant, then the lower boundary is changed to the number of noise studies that was added. If the cluster is no longer statistically significant this number now becomes the upper boundary. This process is repeated until the lower boundary and upper boundary are only one number apart, and the FSN is known. In this example the FSN is equal to 80.
Fig 4
Fig 4. Cluster-level thresholded ALE map of a meta-analysis on finger tapping.
ALE maps were computed using GingerALE 2.3.6 with a cluster-level forming threshold of p < 0.05 (cluster-forming threshold p < 0.001, uncorrected), visualised with Mango.
Fig 5
Fig 5. Visualisation of the 4 quadrants the brain is divided into for simulation.
The blue dot represents the true location of activation and the peaks of the 3 activated studies are sampled around this location. To avoid interference between the activated and the noise studies, the peaks of the noise studies are sampled from quadrants 2, 3 and 4 (darker shades of grey).
Fig 6
Fig 6. Visualisation of simulation conditions with 3 activated studies and 5 noise studies.
The visualisation is simplified to 2D slices with z = 0. In the activated simulations coordinates are entered into 3D space, resulting in a larger spread. In the first pane we see the scenario with 1 peak per study. The peaks from the 3 activated studies lie in quadrant 1, the peaks from the noise studies lie in the other 3 quadrants. The pane in the middle represents the scenario with 8 peaks per study. The activated studies each have eight peaks in quadrant 1, resulting in 24 peaks close to each other. The 5 noise studies each have 8 peaks in the remaining 3 quadrants. Their peaks will never lie in quadrant 1. Due to the random location of peaks some overlap and spurious activation might occur. The influence of this spurious activation is minimal after 1000 simulations. In the right pane the scenario with a random number of peaks is shown. The 3 activated studies have 5, 11 and 2 peaks respectively. The 5 noise studies have peaks in the remaining quadrants, with 2, 12, 4, 11 and 5 peaks respectively.
Fig 7
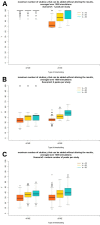
Fig 7. Boxplots of simulations with the FSN in all three scenarios.
On the x-axis the thresholding method and average number of participants per experiment can be found. On the y-axis a boxplot of the number of noise studies that can be added to a meta-analysis of 3 studies with activation before the target area is no longer statistically significant is plotted. In panel A results for the scenario with 1 peak per study are shown, in panel B results for the second scenario, with 8 peaks per study and finally in panel C the results for studies with a random number of peaks are shown.

References

    1. Logothetis N. What we can do and what we cannot do with fmri. Nature. 2008;453: 869–878. 10.1038/nature06976 - DOI - PubMed
    1. Carp J. The secret lives of experiments: Methods reporting in the fmri literature. NeuroImage. 2012;63(1): 289–300. 10.1016/j.neuroimage.2012.07.004 - DOI - PubMed
    1. Durnez J, Moerkerke B, Nichols T. Post-hoc power estimation for topological inference in fmri. NeuroImage. 2014;84: 45–64. 10.1016/j.neuroimage.2013.07.072 - DOI - PubMed
    1. Sutton A, Jones D, Abrams K, Sheldon T, Song F. Methods for Meta-Analysis in Medical Research. John Wiley, London; 2000.
    1. Wager T, Lindquist M, Nichols T, Kober H, Van Snellenberg J. Evaluating the consistency and specificity of neuroimaging data using meta-analysis. NeuroImage. 2009;45: 210–222. - PMC - PubMed

Publication types

MeSH terms