. 2019 Mar;67(3):203-219.
doi: 10.1369/0022155418815860. Epub 2018 Nov 30.

Defining Changes in the Spatial Distribution and Composition of Brain Lipids in the Shiverer and Cuprizone Mouse Models of Myelin Disease

Affiliations

Defining Changes in the Spatial Distribution and Composition of Brain Lipids in the Shiverer and Cuprizone Mouse Models of Myelin Disease

Rajanikanth J Maganti et al. J Histochem Cytochem. 2019 Mar.

Abstract

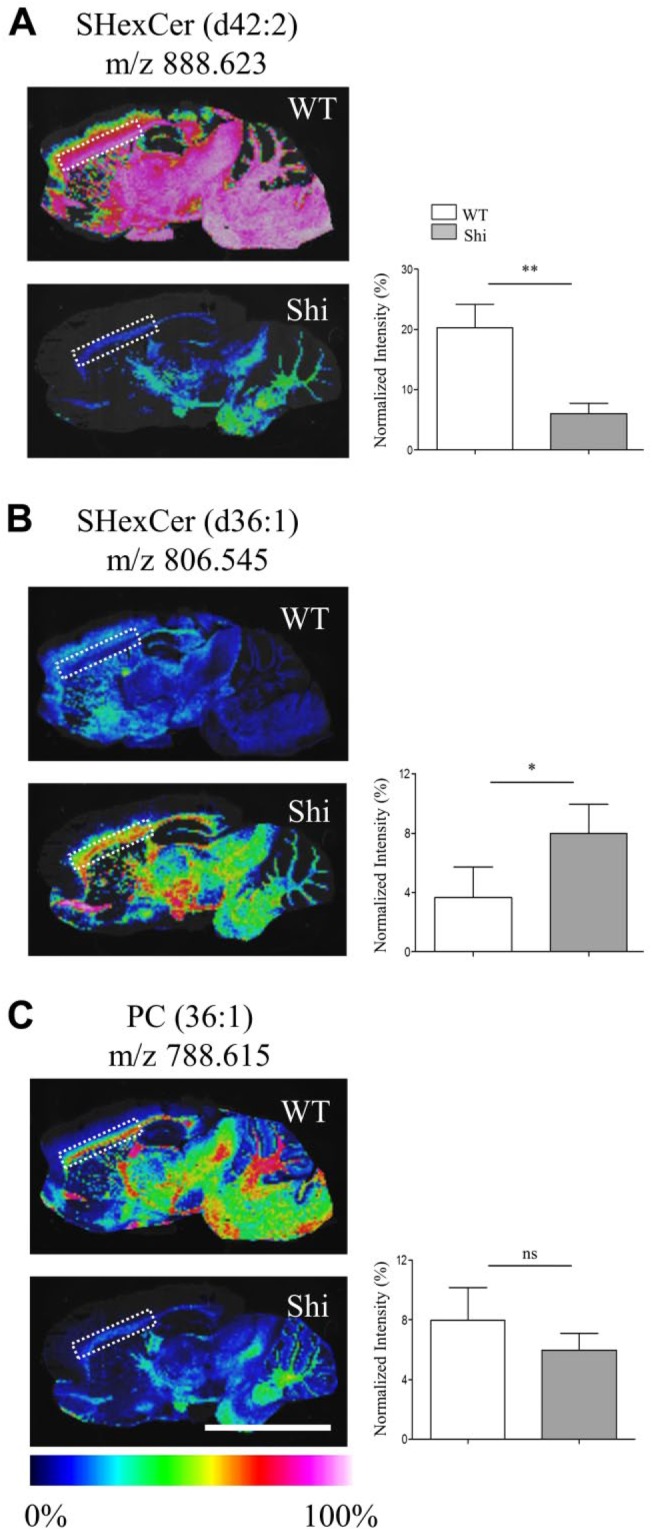
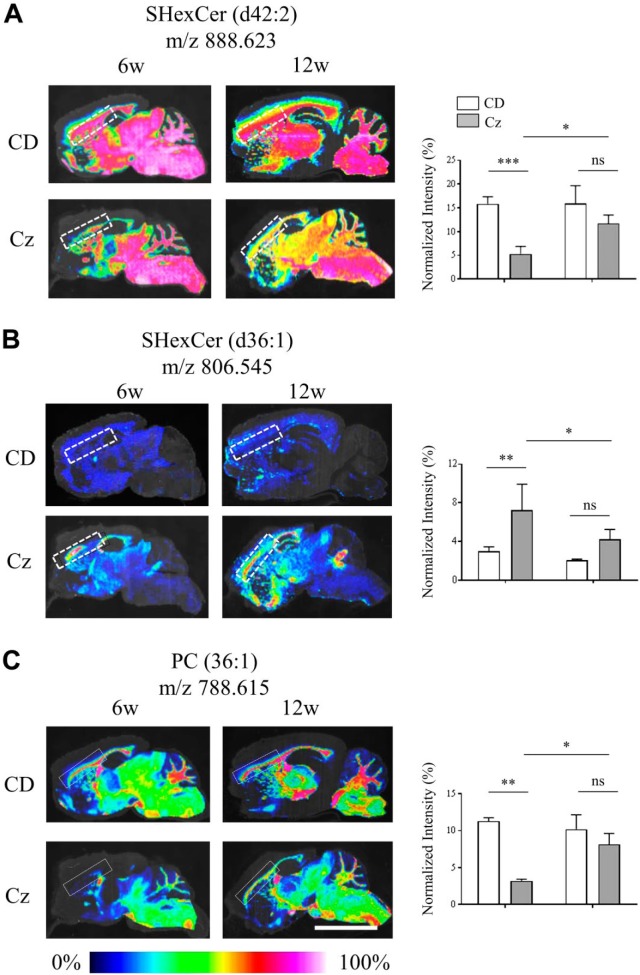
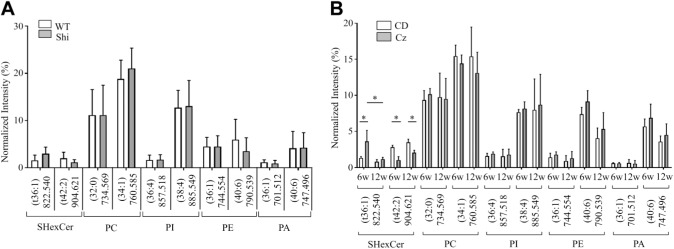
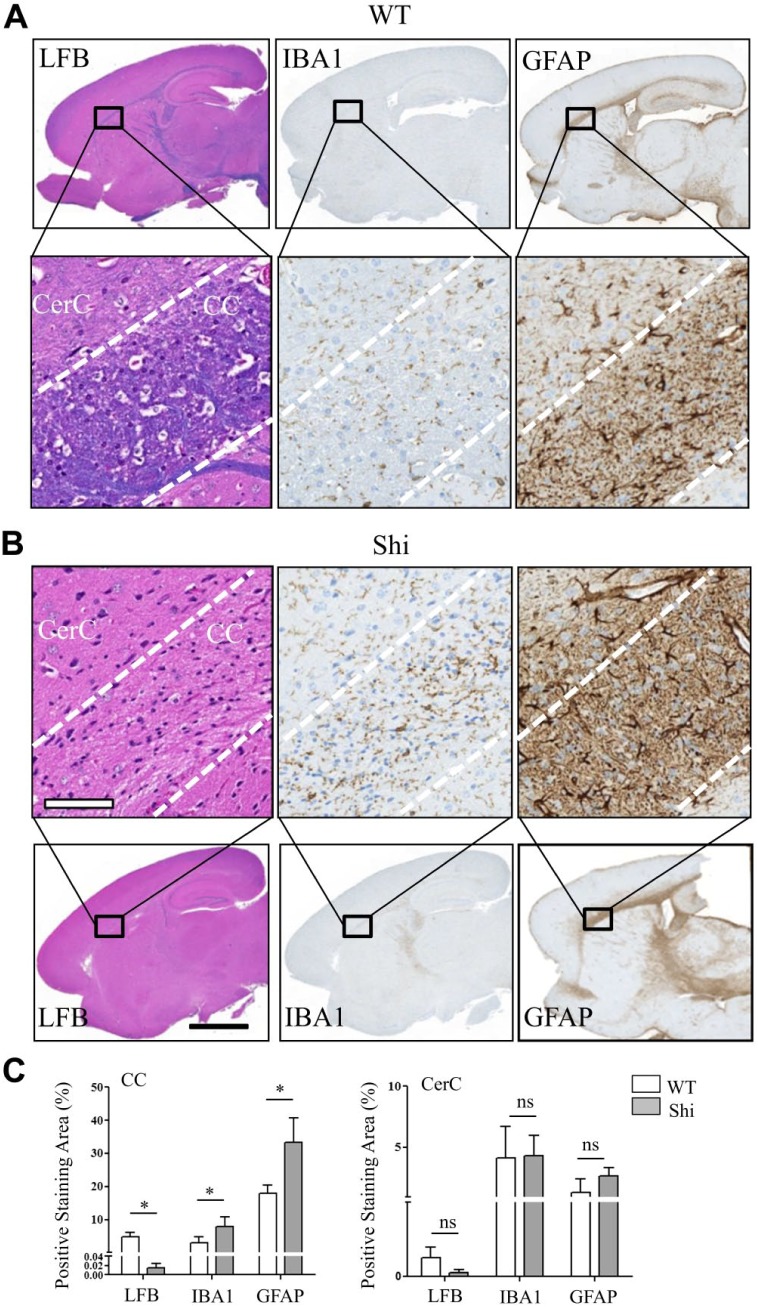
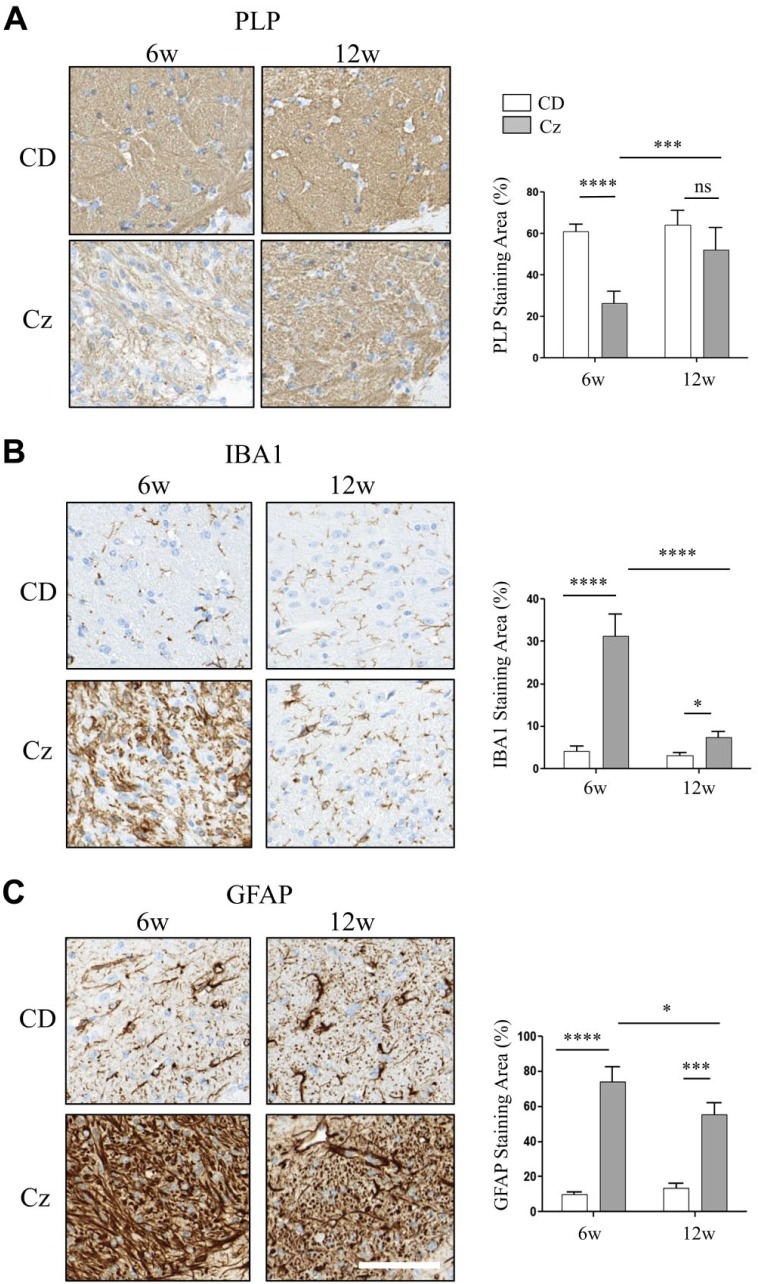
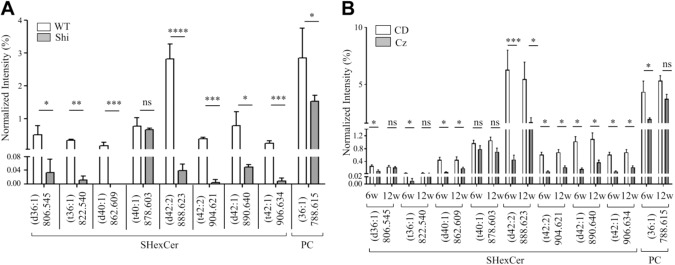
Myelin is composed primarily of lipids and diseases affecting myelin are associated with alterations in its lipid composition. However, correlation of the spatial (in situ) distribution of lipids with the disease-associated compositional and morphological changes is not well defined. Herein we applied high resolution matrix-assisted laser desorption ionization imaging mass spectrometry (MALDI-IMS), immunohistochemistry (IHC), and liquid chromatography-electrospray ionization-mass spectrometry (LC-ESI-MS) to evaluate brain lipid alterations in the dysmyelinating shiverer (Shi) mouse and cuprizone (Cz) mouse model of reversible demyelination. MALDI-IMS revealed a decrease in the spatial distribution of sulfatide (SHexCer) species, SHexCer (d42:2), and a phosphatidylcholine (PC) species, PC (36:1), in white matter regions like corpus callosum (CC) both in the Shi mouse and Cz mouse model. Changes in these lipid species were restored albeit not entirely upon spontaneous remyelination after demyelination in the Cz mouse model. Lipid distribution changes correlated with the local morphological changes as confirmed by IHC. LC-ESI-MS analyses of CC extracts confirmed the MALDI-IMS derived reductions in SHexCer and PC species. These findings highlight the role of SHexCer and PC in preserving the normal myelin architecture and our experimental approaches provide a morphological basis to define lipid abnormalities relevant to myelin diseases.

Keywords: brain; cuprizone; electrospray ionization; mass spectrometry; matrix-assisted laser desorption ionization; myelin; shiverer.


Conflict of interest statement

Competing Interests: The author(s) declared the following potential conflicts of interest with respect to the research, authorship, and/or publication of this article: RJM is an employee of and holds stock options in Moderna Therapeutics. XLH, BTW, XZ, LJ, SH, and PJ are/were employees of and hold stock/options in Biogen, Inc. RWD is an employee of and holds stock/options in AbbVie, Inc.

Figures

Figure 1.
Figure 1.
Changes in the spatial distribution of SHexCer and PC species within white matter regions like the CC of Shi mouse brain. (A–C) Normalized MS images of SHexCer (d42:2), SHexCer (d36:1), and PC (36:1), respectively. The spatial distribution of SHexCer (d42:2) and PC (36:1) was reduced in the Shi mouse brain compared with the WT in myelin enriched white matter regions like the CC; whereas, spatial distribution of SHexCer (d36:1) was increased within the affected regions. Lipid annotation and the corresponding m/z are listed above each image. Charts next to each image show normalized intensities (plotted as %) calculated from the selected ROI in the CC (dashed outline in each image). The normalized intensities of SHexCer (d42:2) were significantly decreased; whereas, there was a nonsignificant reduction in the normalized intensities of PC (36:1) in the CC of the Shi mouse compared with WT mouse. Normalized intensities of SHexCer (d36:1) were significantly increased in the Shi mouse compared with WT mouse (n=5, five Shi mice and five WT mice animals were evaluated; unpaired two-tailed t-test; spatial resolution, 80 μm; and scale bar, 5 mm). Abbreviations: CC, corpus callosum; Shi, shiverer; MS, mass spectrometry; SHexCer, sulfatide; PC, phosphatidylcholine; WT, wild type; ROI, region of interest. *p<0.05, **p<0.01.
Figure 2.
Figure 2.
Altered spatial and temporal distribution of SHexCer and PC species in the CC of the Cz-fed mouse. (A–C) Normalized MS images of SHexCer (d42:2), SHexCer (d36:1), and PC (36:1), respectively. Shown in each panel are the MS images acquired from sagittal brain sections collected from CD-fed mouse (upper row) and Cz-fed mouse (bottom row) at 6w (demyelination) and 12w (remyelination) study time points. Compared with the CD-fed mouse, the spatial distribution of SHexCer (d42:2) and PC (36:1) was reduced within the CC (dashed outline) of Cz-fed mouse after 6w demyelination; whereas, the spatial distribution SHexCer (d36:1) was increased within the affected areas of the CC. Spatial distribution changes of all three lipid species restored albeit not completely during remyelination (12w) in the CC of Cz-fed mouse. Lipid annotation and the corresponding m/z are listed above each image. Charts next to each image show normalized intensities (plotted as %) calculated from the selected ROI in the CC (dashed outline in each image). Normalized intensities of SHexCer (d42:2) and PC (36:1) were significantly lower after the 6w Cz-feeding indicating their reduced tissue levels compared with the CD-fed mouse. Alternatively, normalized intensities of SHexCer (d36:1) were significantly elevated after the 6w Cz-feeding indicating a rise in their tissue levels compared with the CD-fed mouse. The ion intensities restored at 12w although not completely but significantly compared with the 6w Cz-fed mouse. Intensities of the Cz-fed mouse were not significantly different compared with the CD-fed mouse at 12w (n=4, four Cz-fed mice and four CD-fed mice were evaluated per time point; two-way ANOVA; spatial resolution, 80 μm; and scale bar, 5 mm). Abbreviations: CC, corpus callosum; Cz, cuprizone; MS, mass spectrometry; SHexCer, sulfatide; PC, phosphatidylcholine; ROI, region of interest; CD, chow diet; w, weeks. *p<0.05, **p<0.01, ***p<0.001.
Figure 3.
Figure 3.
Changes occurred in other SHexCer species located in the white matter but phospholipid species localized in gray matter regions did not differ significantly either in the Shi or Cz-fed mouse. (A) The normalized intensity of SHexCer (t36:1) was elevated; whereas, normalized intensity of SHexCer (t42:2) was reduced in the CC of Shi mouse compared with the WT. However, these differences were not statistically significant. PC shown here as well as phospholipid species that belong to PI, PE, and PA did not differ significantly between the Shi and WT mouse. Additional species belonging to these lipid types are shown in the supplementary information. (B) There was a significant rise in the normalized intensity of SHexCer (t36:1) and significant decrease in the normalized intensity of SHexCer (t42:2) in the CC of Cz-fed mouse at 6w. By 12w, the intensities of both lipid species restored. However, the intensity of SHexCer (t42:2) remained significantly lower compared with the CD-fed mouse. Like observed in the Shi mouse, the normalized intensities of PC, PI, PE, and PA species did not differ significantly between the Cz-fed and CD-fed mouse at 6w and 12w. Additional species of the above listed lipid types are shown in the supplementary information. Unpaired two-tailed t-test or two-way ANOVA. Differences were considered as significant when p<0.05. Abbreviations: Shi, shiverer; Cz, cuprizone; SHexCer, sulfatide; CC, corpus callosum; WT, wild type; PC, phosphatidylcholine; PI, phosphatidylinositol; PE, phosphatidylethanolamine; PA, phosphatidic acid; CD, chow diet; w, weeks.
Figure 4.
Figure 4.
Altered spatial distribution patterns of sulfatide and phosphatidylcholine species correlated with reduced myelin staining, reactive macrogliosis and reactive astrocytosis in the CC of Shi mouse brain. A full view of digital scanned images from the WT and Shi mouse sagittal brain sections stained with LFB, IBA1, and GFAP (A, top row, and B, bottom row). (A) Bottom row and (B) top row magnified views of CC and CerC of the corresponding image shown in the column. (C) Whereas the LFB positive staining was significantly decreased, the IBA1 and GFAP positive staining was significantly increased in the CC of Shi mouse. There was no significant difference between the mice of either genotype in the levels of all markers in the CerC. Unpaired two-tailed t-test; n=5; spatial resolution, 80 μm; white scale bar, 90 μm; and black scale bar, 3 mm. Abbreviations: CC, corpus callosum; Shi, shiverer; WT, wild type; LFB, luxol fast blue; IBA, ionized calcium-binding adapter molecule; GFAP, glial fibrillary acidic protein; CerC, cerebral cortex. *p<0.05.
Figure 5.
Figure 5.
Spatial and temporal distribution changes of sulfatide and phosphatidylcholine species correlated with reduced myelin staining, reactive macrogliosis, and reactive astrocytosis in the CC of Cz-fed mouse brain. (A–C) CC region of brain sections collected from the CD-fed (upper row) and Cz-fed mouse (bottom row) at 6w and 12w study time points and stained with PLP, IBA1, and GFAP, respectively. Chart next to each image show positive staining area (plotted as %). There was a significant decrease in the PLP-positive staining; whereas, IBA1 and GFAP positive staining was significantly increased in the CC of Cz-fed mouse after 6w demyelination. Consistent with remyelination, PLP staining was restored at 12w and there was no significant difference in the staining levels compared with the age-matched CD-fed mouse. By 12w, IBA and GFAP positive staining also resolved significantly compared with the 6w Cz-fed mouse. However, staining levels remain significantly elevated compared with the age-matched CD-fed mouse. Two-way ANOVA, n ranged from five to eight animals per time point, and scale bar, 90 μm. Abbreviations: CC, corpus callosum; Cz, cuprizone; CD, chow diet; PLP, proteolipid protein; IBA, ionized calcium-binding adapter molecule; GFAP, glial fibrillary acidic protein; w, weeks. *p<0.05, ***p<0.001, ****p<0.0001.
Figure 6.
Figure 6.
LC-ESI-MS analysis confirmed the reduced abundance of SHexCer and PC species in the CC of Shi mouse brain and upon Cz-induced demyelination but no lipid species were elevated. (A) LC-ESI-MS-derived normalized intensities (plotted as %) for SHexCer (d40:1), SHexCer (d42:2), SHexCer (t42:2), SHexCer (d42:1), SHexCer (t42:1), and PC (36:1) were significantly decreased in the Shi mouse. Normalized intensities of SHexCer (d36:1) and SHexCer (t36:1) were also significantly decreased in the Shi mouse. There was no significant difference in intensities of SHexCer (t40:1) between the Shi and WT mouse. Unpaired two-tailed t-test, five animals of each genotype were evaluated. (B) LC-ESI-MS-derived normalized intensities (plotted as %) for SHexCer (d40:1), SHexCer (d42:2), SHexCer (t42:2), SHexCer (d42:1), SHexCer (t42:1), and PC (36:1) were significantly decreased after 6w in Cz-treatment. Intensities of all these lipid species partially restored at 12 weeks after removal of Cz from the diet. Normalized intensities of SHexCer (d36:1) and SHexCer (t36:1) were reduced after 6w of Cz-feeding but the intensities these lipid species completely restored by 12w. There was a small reduction in the intensities of SHexCer (t40:1) in the Cz-fed mouse at both 6w and 12w but the intensities were not significantly different compared with the age-matched CD-fed mouse. Two-way ANOVA, five to eight animals of each type were analyzed per time point. Abbreviations: LC-ESI-MS, liquid chromatography–electrospray ionization–mass spectrometry; CC, corpus callosum; Shi, shiverer; Cz, cuprizone; SHexCer, sulfatide; PC, phosphatidylcholine; WT, wild type; CD, chow diet; w, weeks. *p<0.05, **p<0.01, ***p<0.001, ****p<0.0001.

References

    1. Quarles RH, Macklin WB, Morell P. Myelin formation, structure and biochemistry. In: Brady S, Siegel G, Albers RW, Price D, editors. Basic neurochemistry: molecular, cellular and medical aspects. 7th edition. Burlington: Elsevier Academic Press; 2005. p. 51–71.
    1. Norton WT, Poduso SE. Myelination in rat brain: changes in myelin composition during brain maturation. J Neurochem. 1973;21(4):759–73. - PubMed
    1. Bradl M. Myelin dysfunction/degradation in the central nervous system: why are myelin sheaths susceptible to damage? J Neural Transm Suppl. 1999;55:9–17. - PubMed
    1. Min Y, Kristiansen K, Boggs JM, Husted C, Zasadzinski JA, Israelachvili J. Interaction forces and adhesion of supported myelin lipid bilayers modulated by myelin basic protein. Proc Natl Acad Sci U S A. 2009;106(9):3154–9. - PMC - PubMed
    1. Ohler B, Graf K, Bragg R, Lemons T, Coe R, Genain C, Isrealachvili J, Husted C. Role of lipid interactions in autoimmune demyelination. Biochim Biophys Acta. 2004;1688(1):10–7. - PubMed

Publication types

MeSH terms

LinkOut - more resources