

The 2018 report of the Lancet Countdown on health and climate change: shaping the health of nations for centuries to come
- PMID: 30503045
- PMCID: PMC7616804
- DOI: 10.1016/S0140-6736(18)32594-7
The 2018 report of the Lancet Countdown on health and climate change: shaping the health of nations for centuries to come
Erratum in
-
Department of Error.Lancet. 2020 Jun 6;395(10239):1762. doi: 10.1016/S0140-6736(20)31196-X. Lancet. 2020. PMID: 32505249 No abstract available.
Abstract
This report is the product of a collaboration of 27 leading academic institutions, the UN, and intergovernmental agencies from every continent. The report draws on world-class expertise from climate scientists, ecologists, mathematicians, geographers, engineers, energy, food, livestock, and transport experts, economists, social and political scientists, public health professionals, and doctors.
The Lancet Countdown’s work builds on decades of research in this field, and was first proposed in the 2015 Lancet Commission on health and climate change, which documented the human impacts of climate change and provided ten global recommendations to respond to this public health emergency and secure the public health benefits available (panel 1).
The following four key messages derive from the :
- 1
Present day changes in heat waves, labour capacity, vector-borne disease, and food security provide early warning of the compounded and overwhelming impact on public health that are expected if temperatures continue to rise. Trends in climate change impacts, exposures, and vulnerabilities show an unacceptably high level of risk for the current and future health of populations across the world.
- 2
A lack of progress in reducing emissions and building adaptive capacity threatens both human lives and the viability of the national health systems they depend on, with the potential to disrupt core public health infrastructure and overwhelm health services.
- 3
Despite these delays, a number of sectors have seen the beginning of a low-carbon transition, and it is clear that the nature and scale of the response to climate change will be the determining factor in shaping the health of nations for centuries to come.
- 4
Ensuring a widespread understanding of climate change as a central public health issue will be crucial in delivering an accelerated response, with the health profession beginning to rise to this challenge.
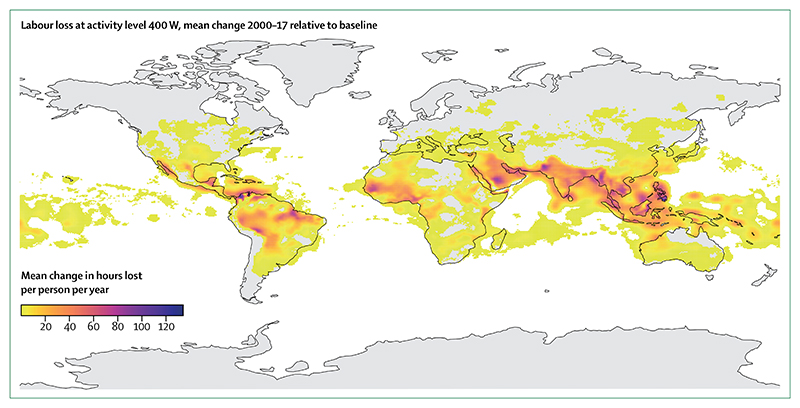
Climate change impacts, exposures, and vulnerability: Vulnerability to extremes of heat has steadily risen since 1990 in every region, with 157 million more people exposed to heatwave events in 2017, compared with 2000, and with the average person experiencing an additional 1·4 days of heatwaves per year over the same period (indicators 1.1 and 1.3). For national economies and household budgets, 153 billion hours of labour were lost in 2017 because of heat, an increase of more than 62 billion hours (3·2 billion weeks of work) since 2000 (indicator 1.4). The direct effects of climate change extend beyond heat to include extremes of weather. In 2017, a total of 712 extreme weather events resulted in US$326 billion in economic losses, almost triple the total losses of 2016 (indicator 4.1).
Small changes in temperature and precipitation can result in large changes in the suitability for transmission of important vector-borne and water-borne diseases. In 2016, global vectorial capacity for the transmission of the dengue fever virus was the highest on record, rising to 9·1% for Aedes aegypti and 11·1% for Aedes albopictus above the 1950s baseline. Focusing on high-risk areas and diseases, the Baltic region has had a 24% increase in the coastline area suitable for epidemics of Vibrio cholerae, and in 2016, the highlands of sub-Saharan Africa saw a 27·6% rise in the vectorial capacity for the transmission of malaria from the 1950 baseline (indicator 1.8). A proxy of agricultural yield potential shows declines in every region, with 30 countries having downward trends in yields, reversing a decades-long trend of improvement (indicator 1.9.1).
Decreasing labour productivity, increased capacity for the transmission of diseases such as dengue fever, malaria, and cholera, and threats to food security provide early warning of compounding negative health and nutrition effects if temperatures continue to rise.
Adaptation, planning, and resilience for health: Global inertia in adapting to climate change persists, with a mixed response from national governments since the signing of the Paris Agreement in 2015. More than half of global cities surveyed expect climate change to seriously compromise public health infrastructure, either directly, with extremes of weather disrupting crucial services, or indirectly, through the overwhelming of existing services with increased burdens of disease (indicator 2.2).
Globally, spending for climate change adaptation remains well below the $100 billion per year commitment made under the Paris Agreement. Within this annual spending, only 3·8% of total development spending committed through formal UN Framework Convention on Climate Change (UNFCCC) mechanisms is dedicated to human health (indicator 2.8). This low investment in adaptive capacity is magnified in specific regions around the world, with only 55% of African countries meeting International Health Regulation core requirements for preparedness for a multihazard public health emergency (indicator 2.3).
Mitigation actions and health co-benefits: Multiple examples of stagnated mitigation efforts exist, with a crucial marker of decarbonisation—the carbon intensity of total primary energy supply—remaining unchanged since 1990 (indicator 3.1). A third of the global population, 2·8 billion people, live without access to healthy, clean, and sustainable cooking fuel or technologies, which is the same number of people as in 2000 (indicator 3.4). In the transport sector, per-capita global road-transport fuel use increased by 2% from 2013 to 2015, and cycling comprises less than 10% of total journeys taken in three quarters of a global sample of cities (indicators 3.6 and 3.7).
The health burden of such inaction has been immense, with people in more than 90% of cities breathing polluted air that is toxic to their cardiovascular and respiratory health. Indeed, between 2010, and 2016, air pollution concentrations worsened in almost 70% of cities around the globe, particularly in low-income and middle-income countries (LMICs; indicator 3.5.1). In 2015 alone, fine particulate matter (ie, atmospheric particulate matter with a diameter of less than 2·5 μm [PM2·5]) was responsible for 2·9 million premature deaths, with coal being responsible for more than 460 000 (16%) of these deaths, and with the total death toll (from other causes including particulates and emissions such as nitrogen oxide) being substantially higher (indicator 3.5.2). Of concern, global employment in fossil-fuel extractive industries actually increased by 8% between 2016, and 2017, reversing the strong decline seen since 2011 (indicator 4.4). At a time when national health budgets and health services face a growing epidemic of lifestyle diseases, continued delay in unlocking the potential health co-benefits of climate change mitigation is short-sighted and damaging for human health.
Despite this stagnation, progress in the power generation and transport sectors provide some cause for optimism, with many positive trends being observed in the 2017 report, and which continue in the present 2018 report. Notably, coal use continues to decline (indicator 3.2) and more renewable energy was installed in 2017 than energy from fossil fuels (indicator 3.3). However, maintaining the global average temperature rise to well below 2°C necessitates wide-reaching transformations across all sectors of society, including power generation, transport, spatial infrastructure, food and agriculture, and the design of health systems. These transformations, in turn, offer levers to help tackle the root causes of the world’s greatest public health challenges.
Finance and economics: About 712 climate-related extreme events were responsible for US$326 billion of losses in 2017, almost triple the losses of 2016 (indicator 4.1). Crucially, 99% of the losses in low-income countries remained uninsured.
Indicators of investment in the low-carbon economy show that the transition is already underway, with continued growth in investment in zero-carbon energy, and growing numbers of people employed in renewable energy sectors (indicators 4.2 and 4.4). Furthermore, investment in new coal capacity in 2017, was at its lowest in at least 10 years, with 2015 potentially marking a peak in coal investment. Correspondingly, global subsidies for fossil fuels continued to decrease, and carbon pricing only covers 13·1% of global greenhouse-gas emissions, a number that is expected to increase to more than 20% when planned legislation in China is implemented in late 2018 (indicators 4.6 and 4.7).
However, the rise of employment in fossil fuel industries in 2017 reversed a 5 year downward trend, and will be a key indicator to follow closely.
Public and political engagement: A better understanding of the health dimensions of climate change allows for advanced preparedness, increased resilience and adaptation, and a prioritisation of mitigation interventions that protect and promote human wellbeing.
To this end, coverage of health and climate change in the media has increased substantially between 2007, and 2017 (indicator 5.1). Following this trend, the number of academic journal articles published on health and climate change has almost tripled over the same period (indicator 5.2). These figures often follow internationally important events, such as the UNFCCC’s Conference of the Parties (COP), along with temporary rises in mentions of health and climate change within the UN General Debate (UNGD; indicator 5.3). The extended heatwaves across the northern hemisphere in the summer of 2018, might prove to be a turning point in public awareness of the seriousness of climate change.
2017 saw a substantial rise in the number of medical and health professional associations actively responding to climate change. In the USA, the US Medical Society Consortium on Health and Climate represents 500 000 physicians. This organisation follows the formation of the UK Health Alliance on Climate Change, which brings together many of the UK’s royal medical and nursing colleges and major health institutions. Organisations like the European Renal Association–European Dialysis and Transplant Association and the UK’s National Health Service (NHS) are committing to reducing the contributions of their clinical practice emissions. The NHS achieved an 11% reduction in emissions between 2007, and 2015. Several health organisations have divested, or are committing to divest, their holdings in fossil fuel companies, including the Royal Australasian College of Physicians, the Canadian Medical Association, the American Public Health Association, and the World Medical Association (indicator 4.5).
Given that climate change is the biggest global health threat of the 21st century, responding to this threat, and ensuring this response delivers the health benefits available, is the responsibility of the health profession; indeed, such a transformation will not be possible without it.
Progress on the recommendations of the 2015 : The 2015 Lancet Commission made ten global recommendations to accelerate the response to climate change and deliver the health benefits this response could offer. A summary of the progress made against these recommendations using the 2018 Lancet Countdown’s indicators is presented in panel 1. Here, global leadership is increasingly provided by China, the EU, and many of the countries that are most vulnerable to climate change.
Conflict of interest statement
The Lancet Countdown’s work is supported by an unrestricted grant from the Wellcome Trust (200890/Z/16/Z). The Lancet Countdown covered travel costs for meetings related to the development of the paper. Six of the authors (NWa, NWh, ML, PD, JC, and KB) were compensated for their time while working on the drafting and development of the Lancet Countdown’s report. HM is a board member of the UK Climate and Health Council and has a patent particulate pollution mask pending (no competing interest). NA, MD, HF, JT, and PW respectively received separate grants from: the UK Foreign and Commonwealth Government; the Wellcome Trust; the Heidelberg University Excellence Initiative, Institutional Strategy ZUK 5.4; the National Oceanic and Atmospheric Administration’s OceanWatch and Atlantic Oceanographic and Meteorological Laboratory; and the Wellcome Trust and National Environment Research Council. All other authors declare no competing interests.
Figures


Comment in
-
Humanising health and climate change.Lancet. 2018 Dec 1;392(10162):2326. doi: 10.1016/S0140-6736(18)33016-2. Epub 2018 Nov 28. Lancet. 2018. PMID: 30503043 No abstract available.
-
Health and climate change.Lancet. 2019 Jun 1;393(10187):2196-2197. doi: 10.1016/S0140-6736(19)30303-4. Lancet. 2019. PMID: 31162074 No abstract available.
-
The dengue epidemic and climate change in Nepal.Lancet. 2019 Dec 14;394(10215):2150-2151. doi: 10.1016/S0140-6736(19)32689-3. Lancet. 2019. PMID: 31839187 No abstract available.
References
-
- Watts N, Adger WN, Agnolucci P, et al. Health and climate change: policy responses to protect public health. Lancet. 2015;386:1861–914. - PubMed
-
- Watts N, Amann M, Ayeb-Karlsson S, et al. The Lancet Countdown on health and climate change: from 25 years of inaction to a global transformation for public health. Lancet. 2018;391:581–630. - PubMed
-
- Smith KR, Woodward A, Campbell-Lendrum D, et al. In: Climate change 2014: impacts, adaptation, and vulnerability part a: global and sectoral aspects contribution of working group ii to the fifth assessment report of the intergovernmental panel of climate change. Field CB, Barros VR, Dokken DJ, et al., editors. Cambridge and New York: Cambridge University Press; 2014. Human health: impacts, adaptation, and co-benefits; pp. 709–54.
-
- The New Climate Economy. [accessed June 20, 2018];Better growth, better climate: the new climate economy report The synthesis report. 2015 https://newclimateeconomy.report/2016/wp-content/uploads/sites/2/2014/08... .
Publication types
MeSH terms
Grants and funding
LinkOut - more resources
Full Text Sources
Other Literature Sources
Medical
Research Materials
Miscellaneous
