. 2018 Dec 13;175(7):1811-1826.e21.
doi: 10.1016/j.cell.2018.10.044. Epub 2018 Nov 29.

Spatiotemporal Control of CNS Myelination by Oligodendrocyte Programmed Cell Death through the TFEB-PUMA Axis

Affiliations

Spatiotemporal Control of CNS Myelination by Oligodendrocyte Programmed Cell Death through the TFEB-PUMA Axis

Lu O Sun et al. Cell. .

Abstract

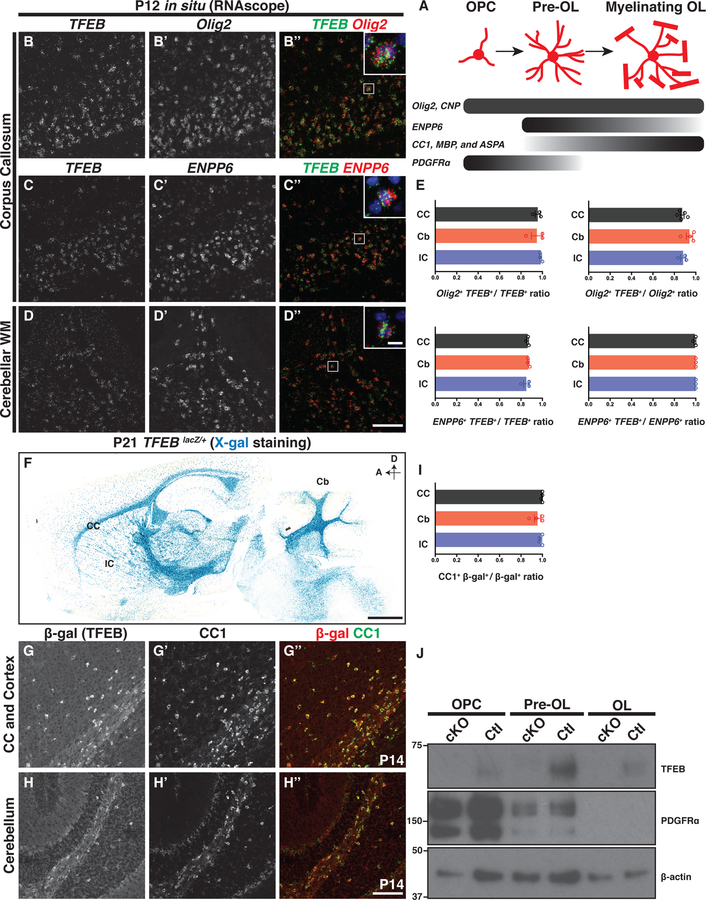
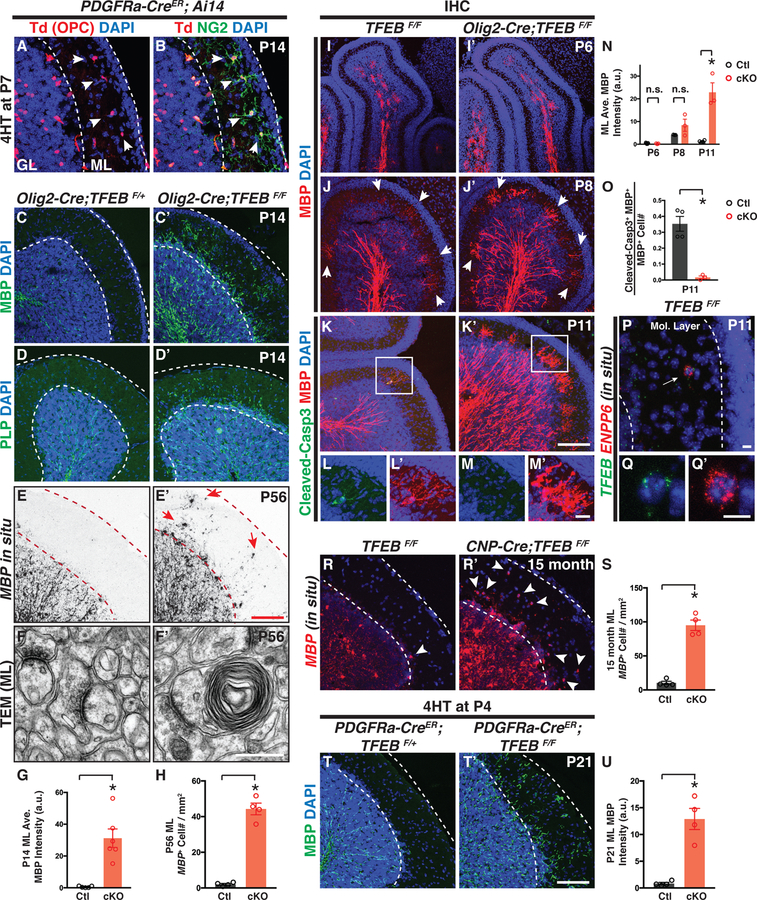
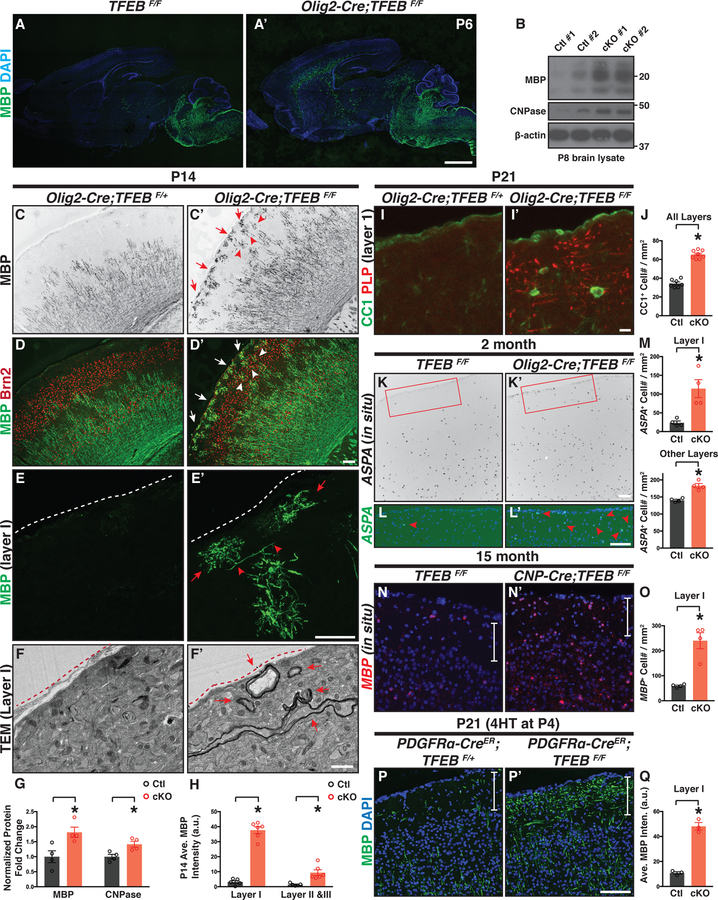
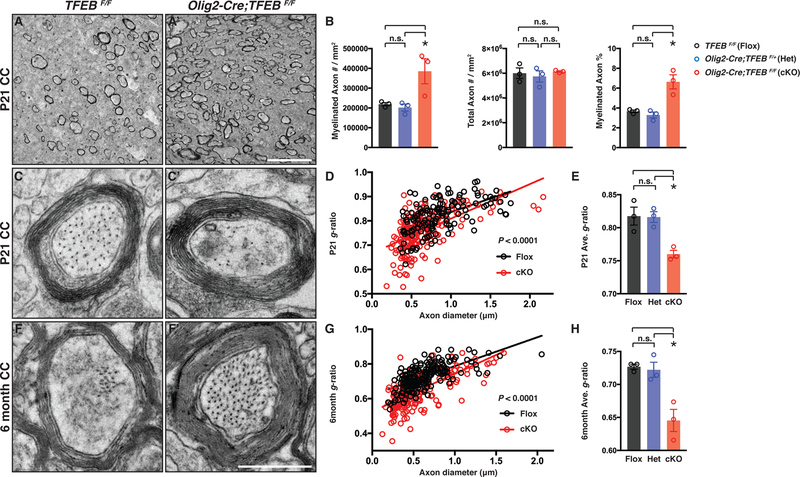
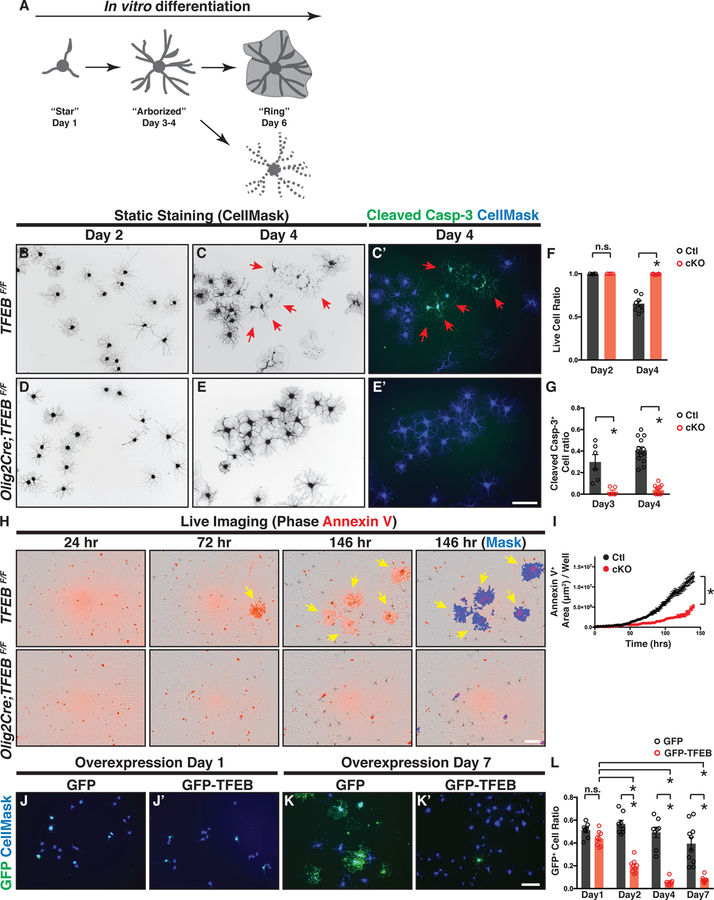
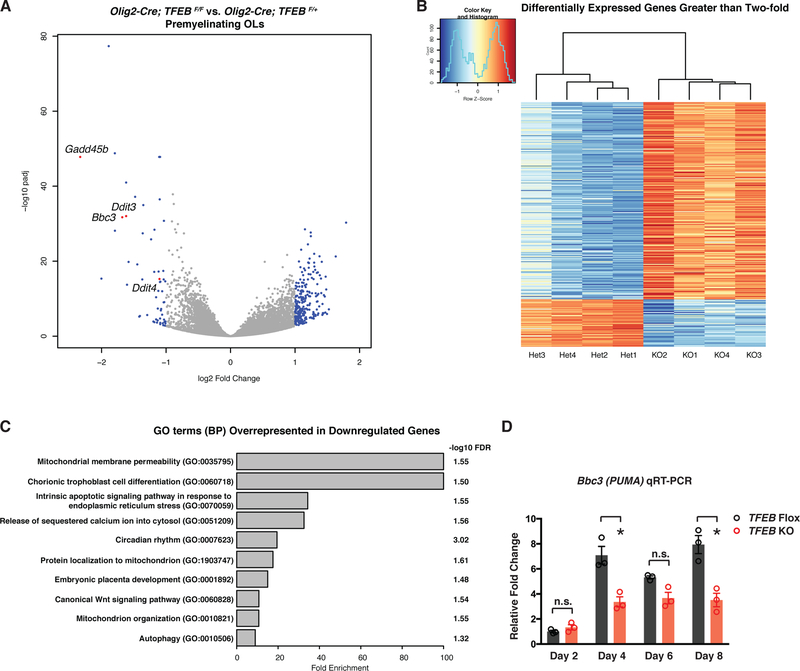
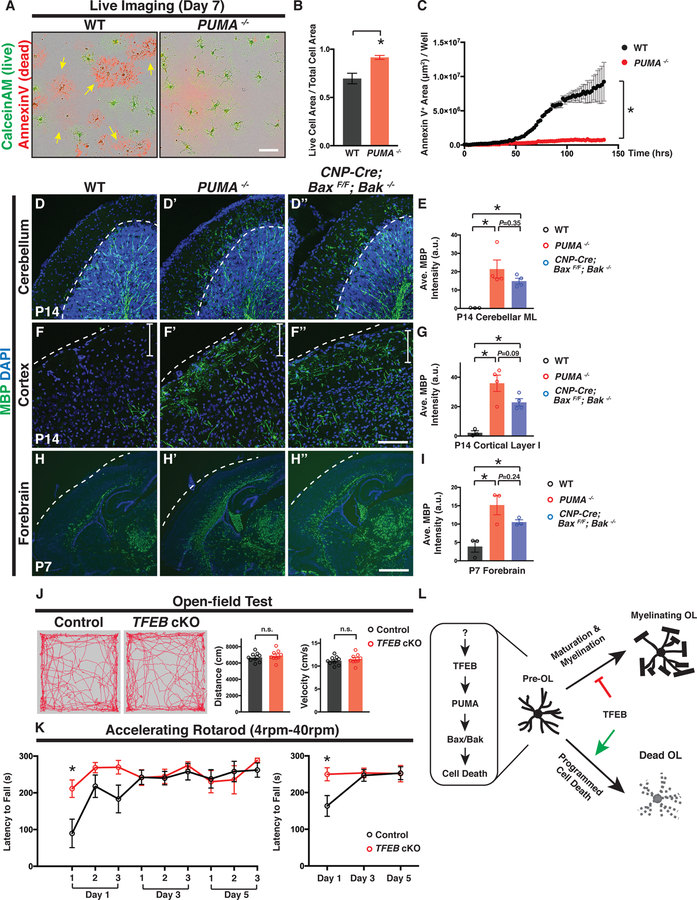
Nervous system function depends on proper myelination for insulation and critical trophic support for axons. Myelination is tightly regulated spatially and temporally, but how it is controlled molecularly remains largely unknown. Here, we identified key molecular mechanisms governing the regional and temporal specificity of CNS myelination. We show that transcription factor EB (TFEB) is highly expressed by differentiating oligodendrocytes and that its loss causes precocious and ectopic myelination in many parts of the murine brain. TFEB functions cell-autonomously through PUMA induction and Bax-Bak activation to promote programmed cell death of a subset of premyelinating oligodendrocytes, allowing selective elimination of oligodendrocytes in normally unmyelinated brain regions. This pathway is conserved across diverse brain areas and is critical for myelination timing. Our findings define an oligodendrocyte-intrinsic mechanism underlying the spatiotemporal specificity of CNS myelination, shedding light on how myelinating glia sculpt the nervous system during development.

Keywords: CNS; PUMA; myelination; oligodendrocyte; programmed cell death; stress response; temporal and regional specificity; transcription factor EB.


Figures

Figure 1.
Figure 1.. Transcription Factor EB (TFEB) is Expressed by Oligodendrocyte Lineage Cells during Developmental Myelination.
(A) Diagram of oligodendrocyte (OL) differentiation and the molecular markers that delineate each differentiation stage. (B-D”) Double fluorescent in situ hybridization of P12 mouse brain sections with probes against the mRNAs of TFEB (B, C, and D), Olig2 (B’), and ENPP6 (C’ and D’) in white matter brain regions including the corpus callosum (B-C”) and cerebellar white matter (D-D”). (E) Quantification of double fluorescent in situ signals in P12 mouse corpus callosum (CC), cerebellar white matter (Cb), and internal capsule (IC). (F) X-gal staining on P21 TFEBLacZ/+ brain sections (see Figure S1 for details on the TFEBLacZ allele). D, dorsal; A, anterior. (G-H”) Double immunolabeling of P14 mouse brain sections by antibodies directed against β-gal (G and H) and CC1 (G’ and H’), showing that most β-gal+ cells are CC1 immuno-positive (G” and H”). (I) Quantification of the ratio of CC1 and β-gal double immuno-positive cells to the total β-gal+ cells on P14-P21 mouse brain sections. (J) Westernblot analysis using cell lysates from acutely purified OPCs, pre-OLs, and OLs in P12 TFEBF/F (Ctl) or Olig2-Cre; TFEBF/F (cKO) mice, showing that TFEB is expressed in all OL lineage stages and is enriched in pre-OLs. Each lane was loaded with the same amount of total proteins. n=4 independent experiments. Error bars indicates SEM. Scale bars: 100 μm in (D”) for (B)-(D”); 10 μm in the inset of (D”) for insets in (B”), (C”), and (D”); 1 mm in (F); and 100 μm in (H”) for (G)-(H”).
Figure 2.
Figure 2.. Conditional Deletion of TFEB in Oligodendrocyte Lineage Cells Causes Ectopic Myelination in the Cerebellar Molecular Layer.
(A and B) Genetic labeling reveals OPCs in P14 mouse cerebellar molecular layer (red in A, indicated by white arrowheads). ML: molecular layer. GL: granule layer. (C-D’) Genetic deletion of TFEB in OL lineage cells elicits fully-penetrant (6/6 animals), ectopic myelin presence in the cerebellar ML. MBP, myelin basic protein; PLP, myelin proteolipid protein. (E and E’) In situ hybridization using probes recognizing MBP mRNAs shows that MBP+ cells are present in the cerebellar ML of P56 TFEB cKO mice (red arrows in E’). (F and F’) Transmission electron microscopy (TEM) analysis reveals ectopic myelin wrapping in the cerebellar ML of P56 TFEB cKO mice. See more examples in Figures S2K–Q. (G) Quantification of the averaged MBP fluorescence intensity in the cerebellar ML of P14 control (Ctl) and TFEB cKO mice. (H) Quantification of MBP+ cell number in the cerebellar ML of P56 mice. (I-M’) Characterization of OL development in the developing cerebellar ML at P6 (I and I’), P8 (J and J’), and P11 (K-M’) from control and TFEB cKO mice. L and L’ represent the inset in K, and M and M’ represent the inset in K’. (N) Quantification of the averaged MBP immunofluorescence in control and TFEB cKO ML. (O) Quantification of the ratio of cleaved Caspase-3 and MBP double immune-positive cells to the total MBP+ cells in the ML at P11. (P-Q’) Double fluorescent in situ hybridization using probes against TFEB (green in P and Q) and ENPP6 (red in P and Q’) showing a transiently differentiated OL in the ML that also expresses TFEB mRNA. (R-S) Characterization and quantification of ectopic OLs in the ML of 15-month-old control (R) and TFEB cKO mice (R’). (T and T’) Conditional and inducible deletion of TFEB in OL lineage cells (PDGFRα-CreER; TFEBF/F) from P4 leads to ectopic myelination in the cerebellar ML. (U) Quantification of the averaged MBP fluorescence intensity in the ML of PDGFRα-CreER; TFEBF/+ (Ctl) and PDGFRα-CreER; TFEBF/F(cKO) mice. Error bars represent SEM. Scale bars: 100 μm in (E’) for (A)-(E’); 0.5 μm in (F’) for (F) and (F’); 100 μm in (K’) forI(I)-(K’); 20 μm in (M’) for (L)-(M’); 10 μm in (P); 10 μm in (Q’) for (Q) and (Q’); and 100 μmin (T’) for (R), (R’), (T), and (T’).
Figure 3.
Figure 3.. TFEB cKO Mice Exhibit Precious Myelination and Increased Oligodendrocyte Number Across the Entire Brain.
(A and A’) Sagittal brain sections immunostained with the antibody directed against MBP showing that TFEB cKO mice (Olig2-Cre; TFEBF/F in A’) harbors differentiated OLs preciously in the forebrain and midbrain (compare A’ to A). n=4 animals per genotype. (B) Western immunoblot of myelin proteins from P8 control (TFEBF/F) and TFEB cKO (Olig2-Cre; TFEBF/F) brain lysates. (C-D’) Characterization of cortical OL development with a differentiated OL marker (MBP, green in D and D’) and cortical layer marker Brn2 (labels layer II, III, and V; red in D and D’) at P14. TFEB cKO mice exhibit differentiated OLs in cortical layer I (red arrows in C’ and white arrows in D’) and layers II&III at this stage (red arrowheads in C’ and white arrowheads in D’). See quantification in (H). (E and E’) Confocal images of P14 cortical layer I stained with MBP antibody (green). Red arrows show ectopically differentiated OLs in layer I. Red arrowheads indicate OL longitudinal processes that may begin ensheathing axons. White dash lines delineate the brain surface. (F and F’) Representative TEM images showing that myelin wraps are precociously formed in cortical layer I of TFEB cKO at P14 (red arrows in F’). Red dash lines delineate the brain surface. n=3 animals for both genotypes. (G) Quantification of normalized myelin proteins from P8 control and TFEB cKO whole brain lysates. (H) Quantification of the averaged MBP fluorescent intensity in control and TFEB cKO cortices. (I-I’) Double immunofluorescent labeling using antibodies directed against CC1 (green) and PLP (red) shows that PLP and differentiated OL cell bodies are present in cortical layer I of TFEB cKO mice at P21. (J) Quantification of CC1+ cell density through all cortical layers at P21. (K-L’) In situ hybridization with ASPA probes showing that in 2-month-old control mice only a few ASPA+ OL are present in cortical layer I (red arrowhead in L). In contrast, TFEB cKO mice harbor increased numbers of ASPA+ OLs (red arrowheads in L’). (L) and (L’) represent the inset in (K) and (K’), respectively. (M) Quantification of ASPA+ cell density in 2-month-old control and TFEB cKO cortices. (N-O) Characterization and quantification of MBP+ OLs in 15-month-old control and TFEB cKO mice. White vertical bars delineate cortical layer I. (P-Q) Representative confocal images and quantification showing that genetic deletion of TFEB in OL lineage cells from P4 causes aberrant MBP expression in cortical layer I. Error bars represent SEM. Scale bars: 1 mm in (A’) for (A) and (A’); 100 μm in (D’) for (C)-(D’); 100 μm in (E’) for and (E’); 1 μm in (F’) for (F) and (F’); 10 μm in (I’) for (I) and (I’); 100 μm in (K’) for (K) and (K’); 100 μm in (L’) for (L) and (L’); and 100 μm in (P’) for (N), (N’), (P), and (P’).
Figure 4.
Figure 4.. TFEB cKO Mice Harbor Thicker Myelin Sheaths and are Precociously Myelinated in White Matter.
(A and A’) Representative TEM micrographs from P21 control (TFEBF/F) and TFEB cKO (Olig2-Cre; TFEBF/F) corpus callosum showing that myelinated axon density is increased in the absence of TFEB. (B) Quantification of myelinated axon number (left), total axon number (middle), and myelinated axon percentage (right) in the corpus callosum from TFEBF/F (Flox), Olig2-Cre; TFEBF/+ (Het) and Olig2-Cre; TFEBF/F (cKO) mice. (C and C’) Representative high-magnification TEM micrographs from P21 control and TFEB cKO corpus callosum. (D and E) Quantification of average g-ratios of myelinated axons (E), and as a function of axon diameter (D), in P21 TFEB cKO mice (red) compared with littermate controls (TFEBF/F in black and Olig2-Cre; TFEBF/+ in blue). n•180 axons from 3 animals per genotype. (F and F’) Representative high-magnification TEM micrographs from 6-month-old control and TFEB cKO corpus callosum. (G and H) Quantification of average g-ratios of myelinated axons (H), and as a function of axon diameter (G), in 6-month-old TFEB cKO mice (red) as compared with littermate controls. n≥180 axons from 3 animals per genotype. Error bars represent SEM. Scale bars: 5 m in (A’) for (A) and (A’); and 0.5 m in (F’) for (C)-(F’).
Figure 5.
Figure 5.. TFEB Mediates OL Programmed Cell Death during Normal Differentiation.
(A) Diagram showing OL morphological changes and cell death during in vitro differentiation. (B-E’) Representative micrographs of control OLs (B-C’) and TFEB cKO OLs (D-E’) that have differentiated for 2 days (B and D) and 4 days (C, C’, E, and E’) in culture. A subset of control OLs undergo programmed cell death at day 4 (C and C’), as evidenced by their fragmented cellular processes (red arrows in C) and the presence of cleaved Caspase-3 immunofluorescent signals (red arrows in C’). In contrast, TFEB cKO OLs display reduced cell death (compare E to C, and E’ to C’; quantified in F and G). (F and G) Quantification of live cell ratio (F) and cleaved Caspase-3+ cell ratio (G) in TFEB cKO and littermate control OLs. n≥6 biological replicates. (H) Representative live-imaging micrographs of littermate control (top panels) and TFEB cKO OLs (bottom panels) throughout OL differentiation (left three columns), labeled by Annexin V (red). Note that a subset of control OLs became Annexin V+ at 72 hr post differentiation, a stage when the OPCs have just differentiated into the pre-OL stage but not yet become fully mature. (I) Quantification of Annexin V+ cell area throughout OL in vitro differentiation. n=4 independent experiments with 2–12 replicates per experiment. (J-K’) Representative micrographs of OLs transfected with plasmids expressing GFP alone (J and K) or GFP-TFEB (J’ and K’) at day 1 (J and J’) and day 7 (K and K’) after transfection followed with differentiation. (L) Quantification of the ratio of GFP+ cells to the total cells following the transfection with the plasmid expressing GFP or GFP-TFEB. n ≥6 biological replicates for each condition. Error bars represent SEM. Scale bars: 100 μm in (E’) for (B)-(E’); 100 μm in (H); and 100 μm in (K’) for (J)-(K’).
Figure 6.
Figure 6.. TFEB Promotes Subsets of Endoplasmic Reticulum (ER) Stress Gene Expression and Induces Pro-Apoptotic Factor PUMA in Pre-OLs.
(A) Volcano plot showing differentially expressed genes in pre-OLs acutely purified from P12 TFEB cKO (Olig2-Cre; TFEBF/F) as compared to those purified from littermate control mice (Olig2-Cre; TFEBF/+). Each dot represents a gene. Blue color dots are genes up- or down-regulated greater than two-fold. Four selected genes are denoted and highlighted in red. (B) Heatmap showing expression levels (in z scores) of genes up- or down-regulated greater than two-fold in TFEB cKO pre-OLs by RNAseq. Replicates of TFEB heterozygous control cells (Het) and KO cells form distinct clusters are shown by the dendrogram. Each row corresponds to a gene, and rows are ordered by fold change values from the highest to the lowest. See Table S1 for the full gene list. (C) Gene ontology (GO) term analysis (PANTHER Overrepresentation Test) by using genes down-regulated more than 2-fold as input. Top 10 most enriched biological process (BP) terms are shown. Only the narrowest term from each hierarchical group in the analysis is plotted. The full list of enriched terms can be found in Table S2. (D) qRT-PCR of PUMA(Bbc3) mRNA expression in differentiating OLs from TFEB cKO mice and littermate controls. n=3 biological replicates for both genotypes and for each time points. Error bars represent SEM.
Figure 7.
Figure 7.. TFEB-PUMA-Bax/Bak Axis Controls the Location and Timing of CNS Myelination.
(A) Representative live imaging micrographs of wildtype (WT; left) and PUMA−/− OLs (right) labeled by CaleinAM (green; live cells) and Annexin V (red; dead cells) 7 days after in vitro differentiation. Note that a subset of WT OLs died (yellow arrows in the left panel) whereas most PUMA−/− OLs survived (right panel). (B) Quantification of the ratio of the total live cell area (CalceinAM+) to the total cell area (CalceinAM+ and Annexin V+) in WT and PUMA−/− OLs. (C) Quantification of the total Annexin V+ cell area throughout OL differentiation. n=3 independent experiments with more than 5 replicates per experiment. (D-D” and F-F”) Representative confocal micrographs of the cerebellar ML (D-D”) and upper cortical layers (F-F”) from P14 WT (D and F), PUMA−/− (D’ and F’), and CNP-Cre; BaxF/F; Bak−/− mice (D” and F”), showing that PUMA−/− and CNP-Cre; BaxF/F; Bak−/− mutant mice exhibit ectopic MBP immunofluorescence in the cerebellar ML (D’ and D”, respectively) and cortical layer I (F’ and F”, respectively; white vertical bars demarcate layer I). (H-H”) A representative P7 sagittal brain section showing that MBP immunofluorescent signals are primarily located in the corpus callosum and deep cortical layers in WT (H; see also Figure 3A). In contrast, PUMA−/− (H’) and CNP-Cre; BaxF/F; Bak−/− mice (H”) display widespread MBP fluorescent signals precociously in many brain regions including upper cortical layers, fornix, internal capsule, and the thalamus. (E, G, and I) Quantification of the averaged MBP fluorescent intensity in P14 cerebellar ML (E), P14 cortical layer I (G), and P7 forebrain (I) from WT (black circles), PUMA−/− (red circles), and CNP-Cre; BaxF/F; Bak−/− mice (blue circles). (J) Performance of littermate control (TFEBF/F, n=9) and TFEB cKO mice (CNP-Cre; TFEBF/F, n=9) in an open-field test, showing the total distance traveled and averaged velocity through the entire 10-minute session. Left two panels show the representative movement paths of a littermate control and a TFEB cKO mouse through the entire session, respectively. (K) Performance of littermate control (TFEBF/F, n=7) and TFEB cKO (CNP-Cre; TFEBF/F, n=5) on an accelerating rotarod (4–40rpm). The averaged latency to fall off for individual trials (left) and the averaged latency to fall off for a given day (right) are plotted. *P<0.05, two-way ANOVA followed by Bonferroni’s multiple comparisons test. (L) The TFEB-PUMA-Bax/Bak axis controls the location and timing of CNS myelination. TFEB is highly expressed by pre-OLs and it facilitates programmed cell death of a subset of pre-OLs during development. TFEB induces PUMA mRNA expression, which encodes a pro-apoptotic factor that triggers Bax/Bak-dependent programmed cell death. The continuous expression of TFEB in myelinating OLs acts as a brake on OL maturation and myelination. Error bars represent SEM. Scale bars: 100 μm in (A); 100 μm in (F”) for (D)-(F”); and 1 mm in (H”) for (H)-(H”).

References

    1. Auer F, Vagionitis S, and Czopka T (2018). Evidence for Myelin Sheath Remodeling in the CNS Revealed by In Vivo Imaging. Curr Biol 28, 549–559 e543. - PubMed
    1. Barres BA, Hart IK, Coles HS, Burne JF, Voyvodic JT, Richardson WD, and Raff MC (1992). Cell death and control of cell survival in the oligodendrocyte lineage. Cell 70, 31–46. - PubMed
    1. Barres BA, and Raff MC (1994). Control of oligodendrocyte number in the developing rat optic nerve. Neuron 12, 935–942. - PubMed
    1. Bergles DE, and Richardson WD (2015). Oligodendrocyte Development and Plasticity. Cold Spring Harb Perspect Biol 8, a020453. - PMC - PubMed
    1. Birey F, Kokkosis AG, and Aguirre A (2017). Oligodendroglia-lineage cells in brain plasticity, homeostasis and psychiatric disorders. Curr Opin Neurobiol 47, 93–103. - PMC - PubMed

Publication types

MeSH terms

Substances