. 2019 Jan 10;176(1-2):306-317.e16.
doi: 10.1016/j.cell.2018.10.041. Epub 2018 Nov 29.

Oligopeptide Signaling through TbGPR89 Drives Trypanosome Quorum Sensing

Affiliations

Oligopeptide Signaling through TbGPR89 Drives Trypanosome Quorum Sensing

Federico Rojas et al. Cell. .

Abstract

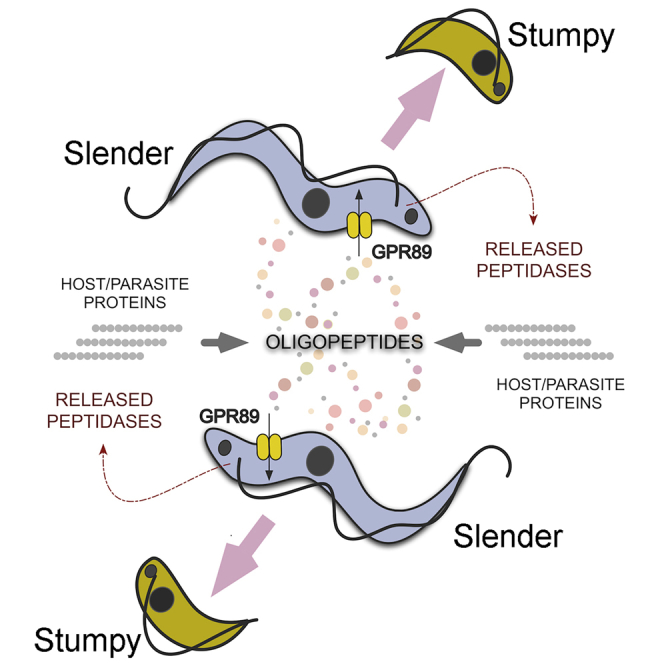
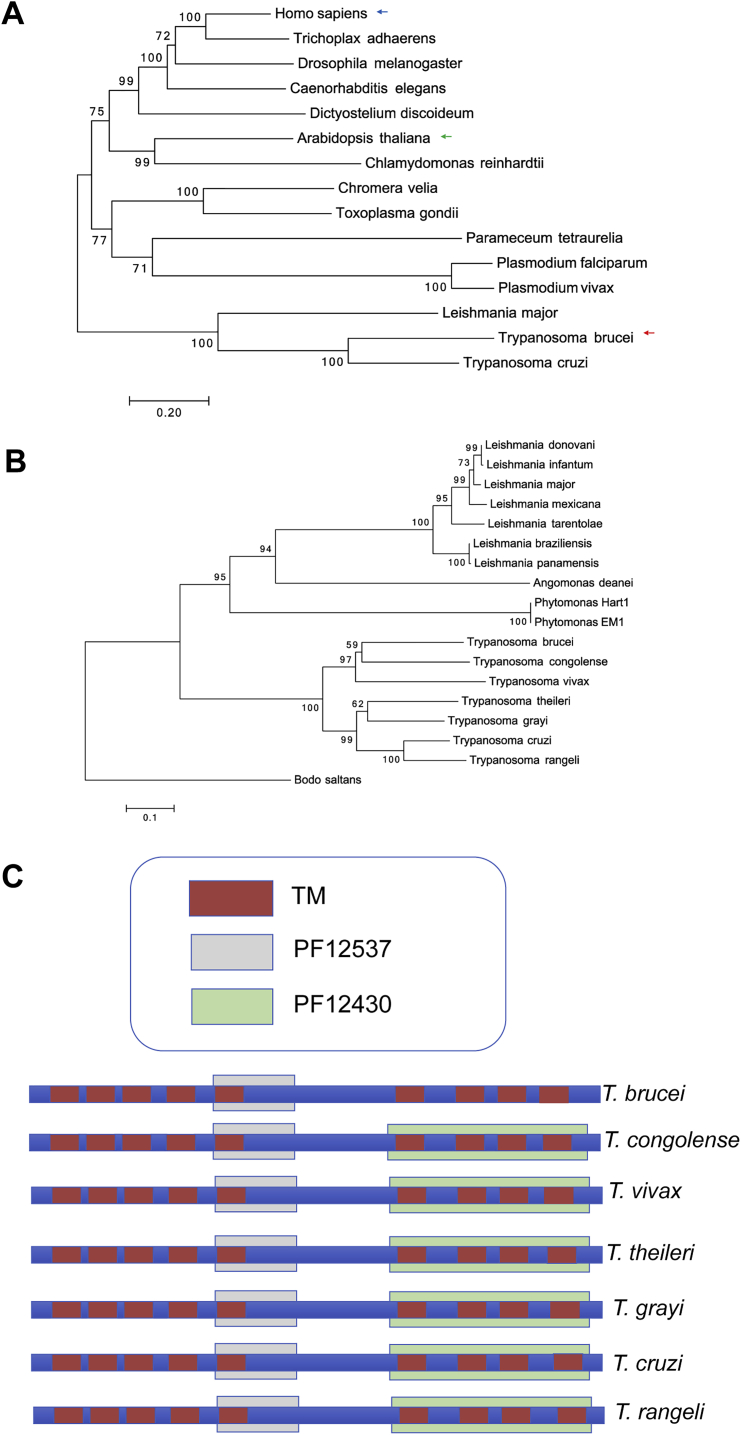
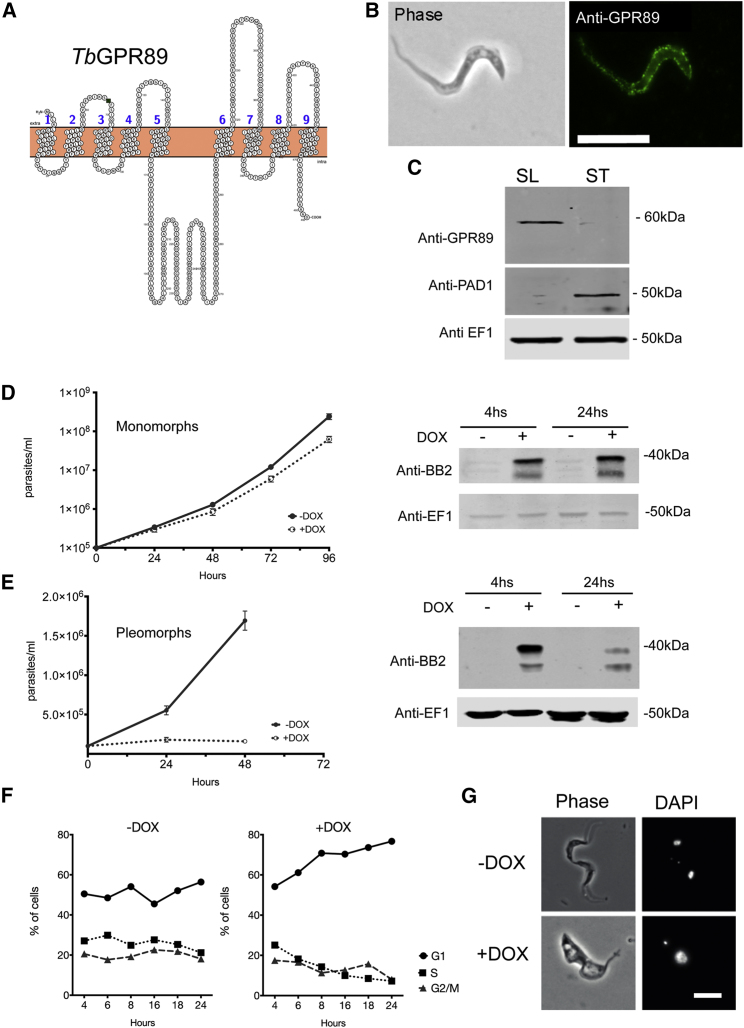
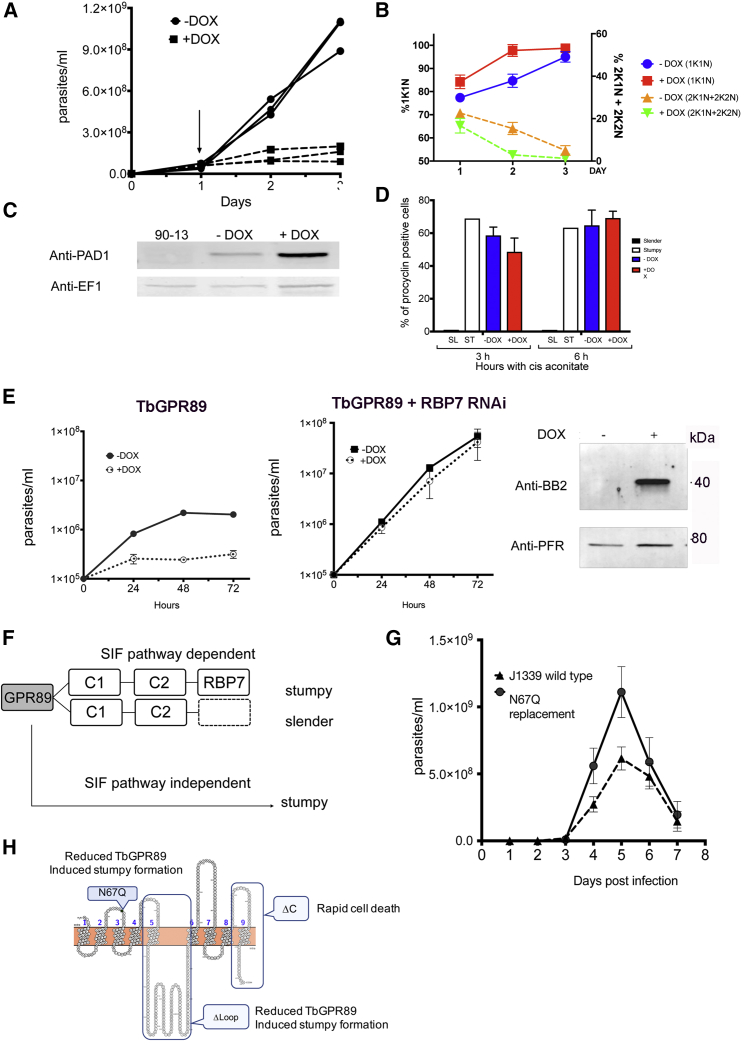
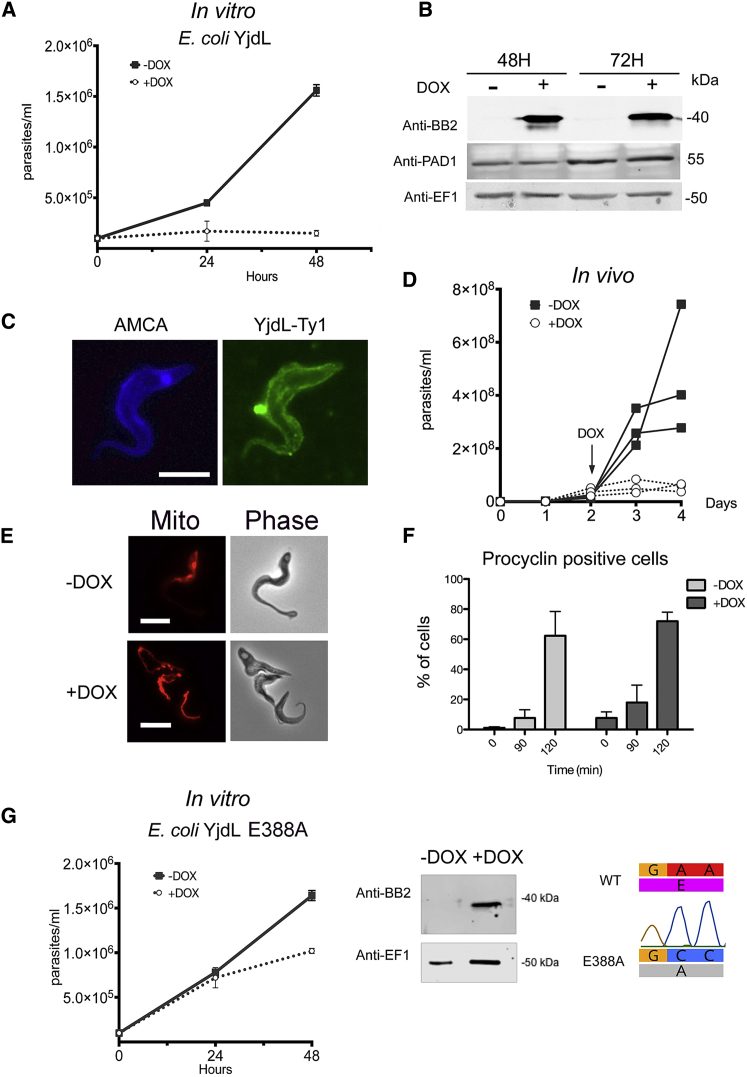
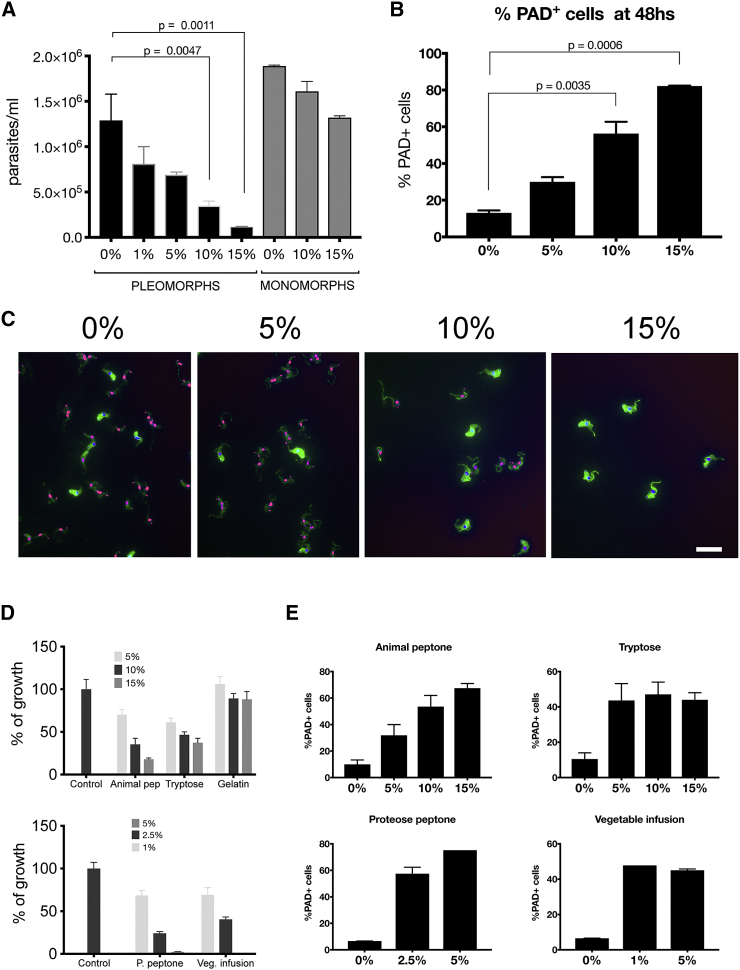
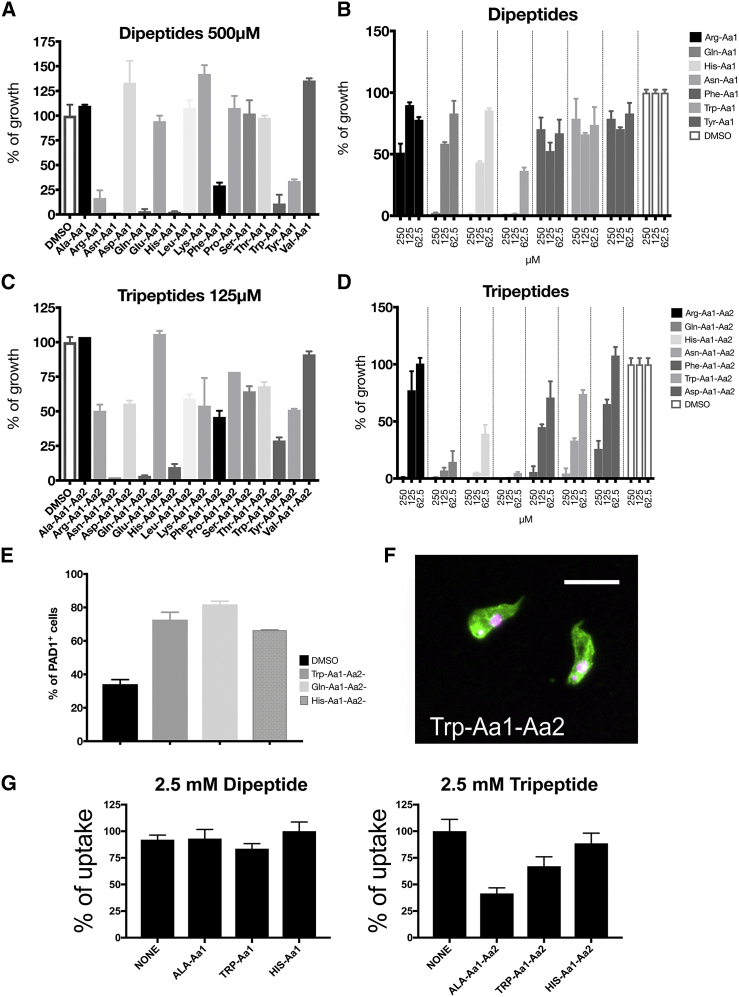
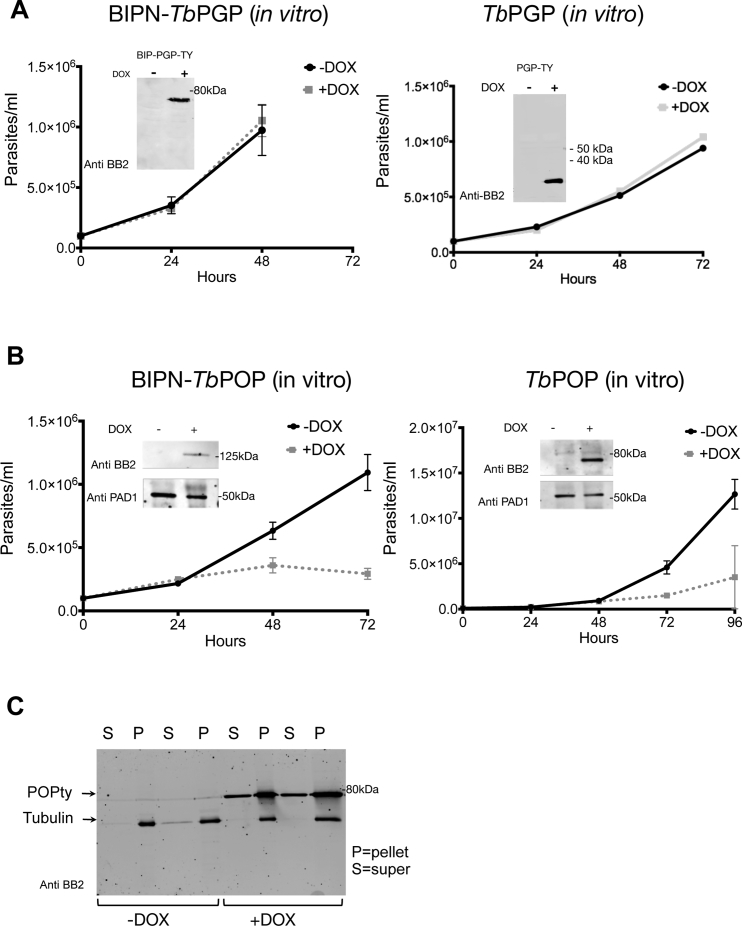
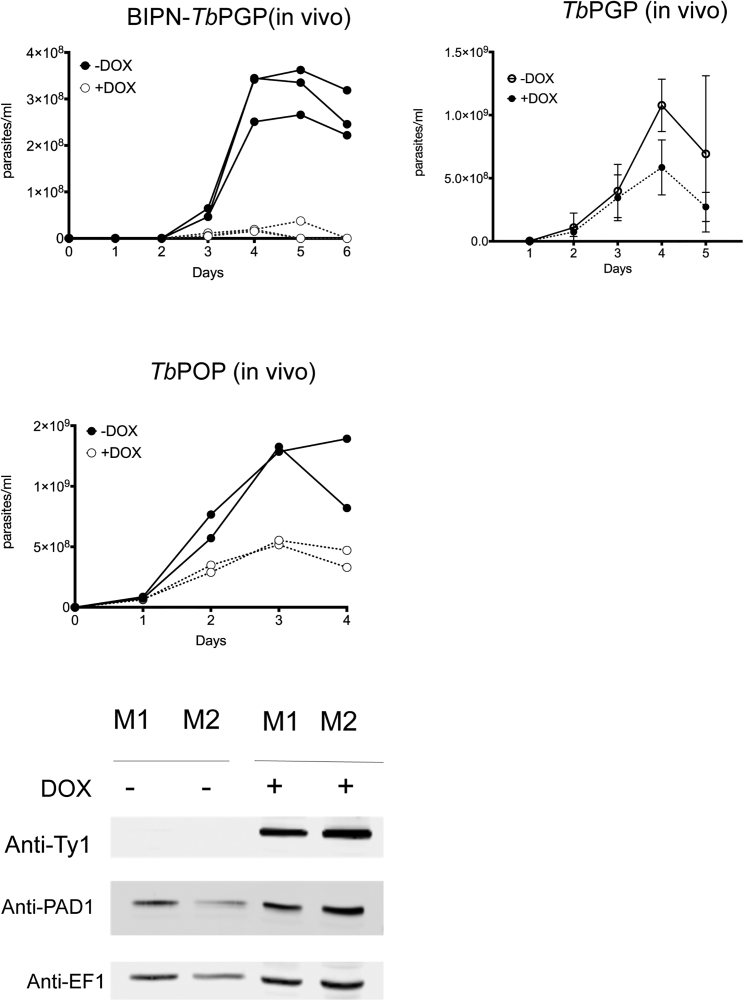
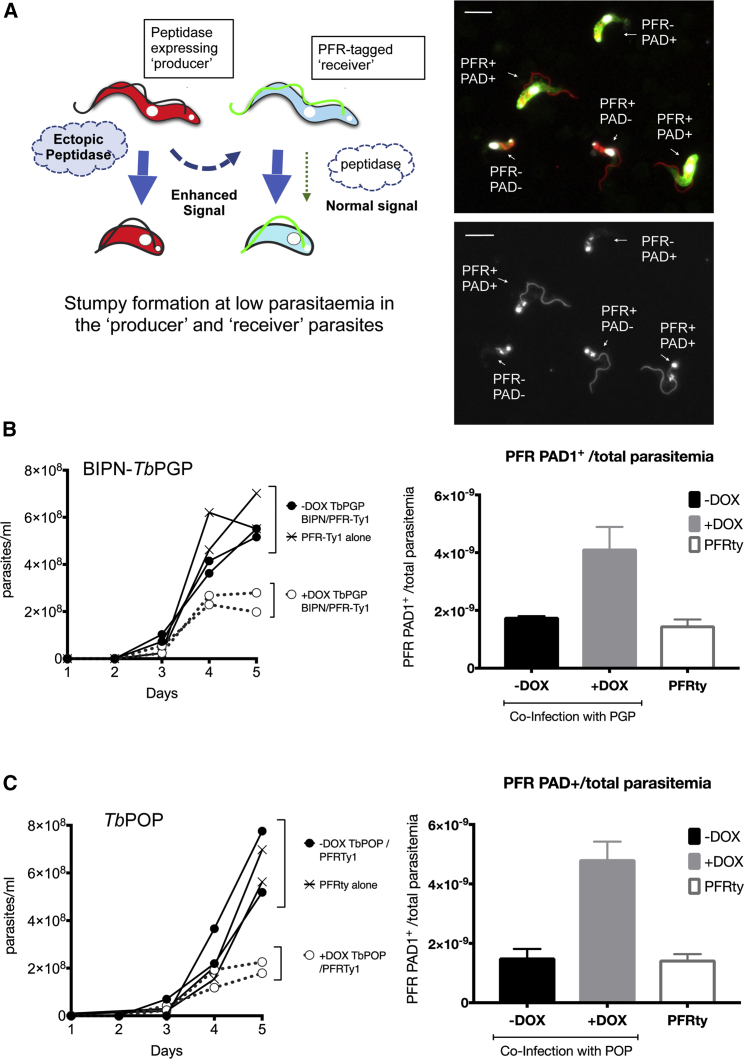
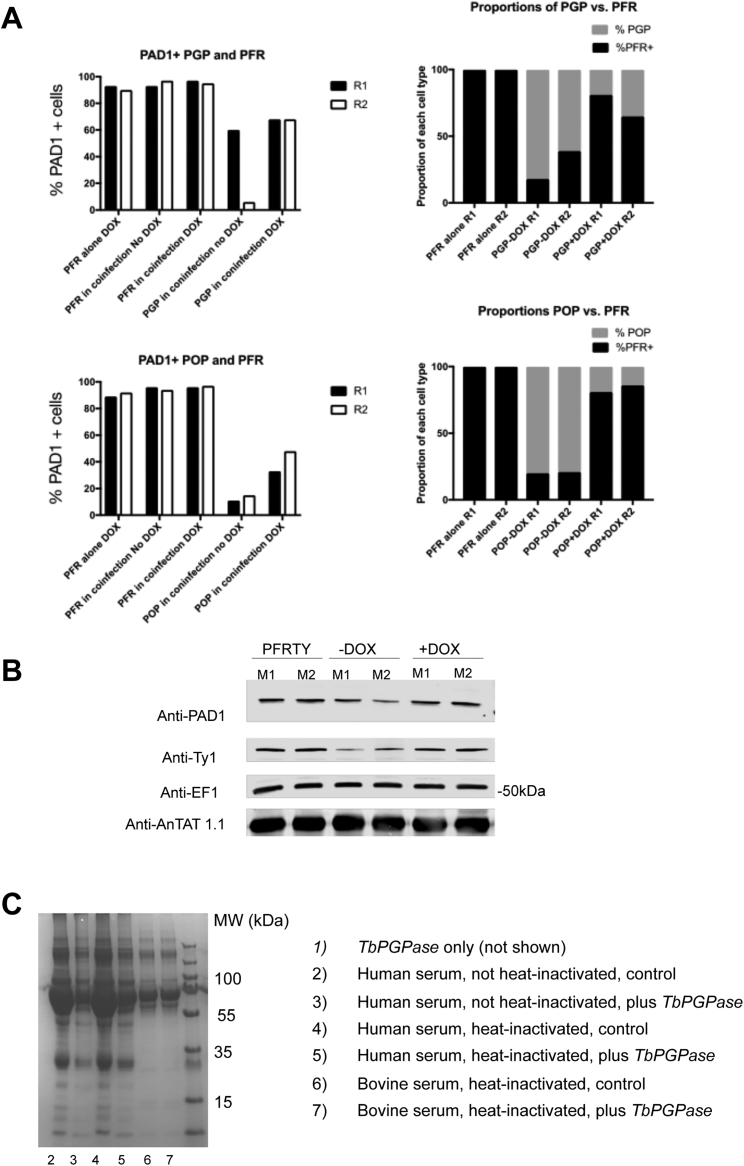
Trypanosome parasites control their virulence and spread by using quorum sensing (QS) to generate transmissible "stumpy forms" in their host bloodstream. However, the QS signal "stumpy induction factor" (SIF) and its reception mechanism are unknown. Although trypanosomes lack G protein-coupled receptor signaling, we have identified a surface GPR89-family protein that regulates stumpy formation. TbGPR89 is expressed on bloodstream "slender form" trypanosomes, which receive the SIF signal, and when ectopically expressed, TbGPR89 drives stumpy formation in a SIF-pathway-dependent process. Structural modeling of TbGPR89 predicts unexpected similarity to oligopeptide transporters (POT), and when expressed in bacteria, TbGPR89 transports oligopeptides. Conversely, expression of an E. coli POT in trypanosomes drives parasite differentiation, and oligopeptides promote stumpy formation in vitro. Furthermore, the expression of secreted trypanosome oligopeptidases generates a paracrine signal that accelerates stumpy formation in vivo. Peptidase-generated oligopeptide QS signals being received through TbGPR89 provides a mechanism for both trypanosome SIF production and reception.

Keywords: GPR89; Trypanosome brucei; differentiation; oligopeptide; parasite; quorum sensing; sleeping sickness; stumpy induction factor.


Figures

None
Graphical abstract
Figure S1
Figure S1
GPR89 Family Members in Kinetoplastid Organisms, Related to Figure 1 (A) Phylogenetic tree of GPR89 family representatives in eukaryota. Human GPR89, Arabidopsis GTG1/GTG2 and Trypanosoma GPR89 are highlighted. The optimal tree with the sum of branch length = 7.35 is shown. The analysis involved 15 amino acid sequences. All positions containing gaps and missing data were eliminated. There was a total of 383 positions in the final dataset. Accession numbers for each species are; H. sapiens, NP_001091081; T. adhaerens, XM_002112150; D. melanogaster; NP_611016; C. elegans,NP_499588; D.discoideum, XM_633754; A thaliana GTG1, NP_001031235; C. reinhardtii, XM_001695842; C. velia, Cvel_25352; T. gondii, TGME49_286490; P. tartaurelia,XM_001426347; P. falciparum, PF3D7_1008500; P. vivax, PV_094620 ; L. major, LmjF_07.0330. (B) Phylogenetic tree of GPR89 family representatives in the kinetoplastids. The optimal tree with the sum of branch length = 4.48 is shown. The percentage of replicate trees in which the associated taxa clustered together in the bootstrap test (1000 replicates) are shown next to the branches (Felsenstein, 1981). The tree is drawn to scale, with branch lengths in the same units as those of the evolutionary distances used to infer the phylogenetic tree. The analysis involved 18 amino acid sequences. All positions containing gaps and missing data were eliminated. There are a total of 302 positions in the final dataset. The tree is shown rooted on the Bodo saltans GPR89 sequence. B. saltans is a free-living nonparasitic marine kinetoplastid of the bodonid clade from which trypanosomatids descended (Jackson et al., 2016). (C) Domain structure of GPR89 members in the kinetoplastida highlighting the position of predicted transmembrane domains (red) Pfam domain 12537 (gray) and Pfam domain 12430 (green).
Figure 1
Figure 1
Tb927.8.1530 Encodes a GPR89 Family Member that Promotes Stumpy Formation (A) Topology map of TbGPR89 showing the TMDs predicted using the TOPCONs server (http://topcons.cbr.su.se) and rendered via Protter (http://wlab.ethz.ch/protter/start). (B) Location of TbGPR89 on bloodstream form trypanosomes. Left: phase contrast image of a slender bloodstream form trypanosome. Right: surface staining with anti-TbGPR89 antibody. Scale bar, 15 μm. (C) Stage regulation of TbGPR89. Proteins were isolated from parasite populations enriched in slender (SL) forms or stumpy (ST) forms. Samples were reacted with antibodies recognizing TbGPR89, the stumpy specific marker PAD1 or EF1α, as a loading control. TbGPR89 runs aberrantly with respect to its anticipated molecular weight (53 kDa), similar to other GPR89 proteins, likely due to its 9 TMDs and potential post translational modification. (D) Growth of monomorphic Lister 427 90:13 parasites induced (+DOX) or not (−DOX) to express TbGPR89-Ty. Error bars, SEM. Right: protein expression of TbGPR89-Ty1 in monomorphic parasites 4 hr and 24 hr post induction with doxycycline, detected using the Ty1 epitope-specific BB2 antibody. Note that ectopically expressed TbGPR89 predominantly migrates at <40 kDa perhaps due to the efficiency of post translational modification and presence of the epitope tag. Anti EF1α provides the loading control. (E) Growth of pleomorphic T. brucei parasites induced (+DOX) or not (−DOX) to express TbGPR89-Ty. Error bars, SEM. Right: protein expression of TbGPR89-Ty1 4 hr and 24 hr post induction with doxycycline. Anti EF1α provides the loading control. (F) Cell-cycle status of pleomorphic T. brucei induced (+DOX) or not (−DOX) to ectopically express TbGPR89 in culture. The proportion of cells in G1, GS, or G2/M was determined by flow cytometry. (G) Morphology of pleomorphic T. brucei cells induced (+DOX) or not (−DOX) to express TbGPR89-Ty1 in culture for 24 hr. DAPI stains the cell nucleus and kinetoplast. Scale bar, 10 μm. See also Figure S1.
Figure 2
Figure 2
TbGPR89 Expression Drives Stumpy Formation through the SIF Signaling Pathway (A) Parasitemia of pleomorphic T. brucei parasites induced (+DOX) or not (−DOX) to ectopically express TbGPR89 in vivo. TbGPR89 expression was induced 24 hr post infection by doxycycline (arrowed). n = 3 per group. (B) The percentage of cells with 1K1N or 2K1N plus 2K2N on days 1–3 post infection in the presence or absence of TbGPR89 ectopic expression. n = 3; 250 cells per time point. Error bars, SEM. (C) Expression of the stumpy marker PAD1 is elevated when TbGPR89 expression is induced. Slender parental T. brucei EATRO 1125 AnTat1.1. 90:13 (“90-13”) provides the negative control. (D) Expression of EP procyclin on parasites harvested from bloodstream infections and exposed to the differentiation signal, 6 mM cis-aconitate. The stumpy form parasites induced to express TbGPR89 (red bars) differentiated as efficiently to procyclic forms as uninduced stumpy forms (blue bars), despite being arrested at lower parasitemia. Independent slender (black bars) and stumpy forms (white bars) provide negative and positive controls, respectively. Error bars, SEM. (E) TbGPR89 expression arrests growth of pleomorphic trypanosomes grown in vitro (n = 3) but does not arrest growth when RBP7 expression is silenced by RNAi (n = 3). Error bars, SEM. Uninduced and induced RBP7 RNAi lines were passaged every 24 hr to show that cells continue to proliferate in the presence of TbGPR89 overexpression, as with monomorphic cells. Right: TbGPR89-Ty1 expression in the RBP7 RNAi cells; anti-paraflagellar rod protein is used as a loading control. (F) Representation of the stumpy formation pathway. Components of the SIF-dependent pathway (C1, C2) also include identified molecules such as RBP7, whose silencing inactivates the pathway (Mony et al., 2014). Hence, if TbGPR89-induced stumpy formation is inhibited by RBP7 RNAi, signaling via the SIF pathway is indicated. If not, SIF-independent signaling pathway is implicated. (G) Parasitemia of pleomorphic parental cells and the TbGPR89 WT/N67Q mutants generated by CRISPR. Results from two independent mutant cell lines are shown, both exhibiting elevated parasitemia and delayed differentiation compared to the parent line. Error bars, SEM. (H) Summary of phenotypes generated upon ectopic expression of TbGPR89 mutants detailed in Figure S3. See also Figures S2 and S3.
Figure S2
Figure S2
Cre-lox Strategy for the Deletion of TbGPR89, Related to Figure 2 (A–D) For cre-lox based gene deletion, the TbGPR89 gene locus was initially disrupted by integration of a BSD gene and thymidine kinase (TK) flanked by LoxP sites in a cell background capable of doxycycline inducible cre recombinase expression (A). After recombinase induction (+DOX) and ganciclovir (GCV) selection to derive single allele replacements, the cells were transfected with a further loxP-flanked cassette with a TbGPR89 gene linked to a puromycin (PURO) resistance cassette and thymidine kinase (TK), and selectant lines isolated based on their puromycin resistance. Upon doxycycline-mediated cre recombinase induction (+DOX, B) the cells grew more slowly and the expression of both TbGPR89 and puromycin was reduced, indicating deletion of the LoxP flanked cassette in some cells in the population (C). However, when null mutants were selected by cre recombinase induction in the presence of ganciclovir (GCV), the population initially grew but then died after 5 days, when TbGPR89 protein was lost by division (D). Uninduced cells were killed by Gancyclovir through their TK expression.
Figure S3
Figure S3
GPR89 Mutants Do Not Drive Stumpy Formation, Related to Figure 2 (A) Schematic representation of different domains mutated within TbGPR89. (B–D) Growth of pleomorphic parasites induced or not to express TbGPR89 with a C-terminal truncation (TbGPR89 ΔC, B), a deleted loop region (TbGPR89 Δ loop; C), or a mutated predicted N-glycosylation site (TbGPR89 N67Q ; D). In C and D, cultures were diluted at 48h to keep cell numbers below 2x10⁶/ml. Error bars = SEM. (E) protein expression of TbGPR89 mutants in the respective cells lines in panels B-D at 4h post induction and, for the N glycosylation site, at 4h and 24h. In each case, the loading control is EF1α. The detected protein in the TbGPR89 ΔC samples is reduced because of the presence of fewer viable cells after induction of the ectopic protein expression. (F) Allelic replacement of wild-type TbGPR89 with TbGPR89 N67Q by CRISPR. One TbGPR9 allele was replaced with the TbGPR89 N67Q mutant (linked to a blasticidin resistance gene) and the other with a hygromycin resistance gene. Analysis of two resulting clones (Clone A, Clone B) showed retention of a wild-type TbGPR89 gene copy, validated by PCR (not shown) and sequence analysis, where both the mutant and wild-type sequence are detected. PCR using primers targeting flanking sequences demonstrated that the mutant allele and hygromycin resistance cassette integrated at the expected genomic location; the additional wild-type allele genomic location has not been mapped, but retains the endogenous 3′UTR (not shown).
Figure 3
Figure 3
TbGPR89 Transports Oligopeptides (A) Homology modeling of TbGPR89 and the G. kaustophilus POT protein. Superimposition of the TbGPR89 model (green) onto the G. kaustophilus template (purple), centered on the dipeptide analog alafosfalin binding pocket (residues of which are shown as lines). Side chains of TbGPR89 residues within interaction distance of the ligand are shown as thicker lines. Potential H-bonds between the model and the ligand are highlighted by dashed yellow lines. The predicted substrate interacting tyrosine 48 in TbGPR89 is annotated. (B) Representation of the syntenic regions of the genomes of respective kinetoplastid organisms, with the location of a conventional POT family member highlighted in orange. This is missing in African trypanosomes. (C) Relative uptake of fluorescent dipeptide β-ALA-Lys-AMCA in E. coli induced (+IPTG) or not induced (−IPTG) to express TbGPR89, E. coli YjdL, or an empty plasmid control. Fluorescence is in arbitrary units. n = 3; error bars, SEM. (D) Mutation of the predicted dipeptide interacting residue tyrosine 48 to histidine 48 in TbGPR89 reduces transport of the fluorescent dipeptide β-Ala-Lys-AMCA when expressed in E. coli. Fluorescence is in arbitrary units. n = 3; error bars, SEM. (E) Wild-type and Y48H mutant TbGPR89 are expressed at equivalent levels in induced (+IPTG) and uninduced (−IPTG) E. coli. See also Figure S4.
Figure S4
Figure S4
TbGPR89 Is an Oligopeptide Transporter, Related to Figure 3 (A) iTASSER output following submission of the TbGPR89 sequence in September 2015. The description of the top 10 identified structural analogs is shown in the ‘call out’ box. (B) Structural homology between TbGPR89 and structure 4ikvA derived from the Geobacillus kaustophilus POT oligopeptide transporter. The G. kaustophilus template (PDB: 4IKZ) is shown as secondary structure and colored accordingly, with side chains of the residues of the alafosfalin binding pocket shown as lines and the ligand as sticks. The TbGPR89 model is shown on the right, with equivalent ligand binding pocket residues shown as sticks. Note that the overall model misrepresents the intracellular domain of TbGPR89 as an additional 5TMs because the threading forces a match to the 14 TMs in the Geobacillus POT (and other threaded transporters identified by iTASSER). (C) Expression of TbGPR89 generates time and concentration dependent dipeptide uptake when expressed in E. coli. E. coli were induced to express TbGPR89 under IPTG induction and monitored for their uptake of β-Ala-Lys-AMCA (measured in arbitrary fluorescence units). The left panel shows uptake of fluorescent dipeptide by TbGPR89 when expressed in E. coli is not saturable up to 4mM, consistent with transport but not binding. +IPTG, TbGPR89 expression induced; -IPTG, TbGPR89 expression not induced; the right panel shows the uptake of 200μM β-Ala-Lys-AMCA at 15 min, 30 min and 60min after addition. Error bars = SEM. p = 0.006; ∗∗p ≤ 0.0001. (D) Inhibition of florescent dipeptide uptake by TbGPR89 or E. coli YjdL in the presence of CCCP which inhibits proton gradient-dependent transport. (E) Fluorescent dipeptide uptake by TbGPR89 at 4°C, 20°C or 37°C over 15 minutes. Dipeptide uptake is enhanced at 37°C with respect to 4°C and 20°C, reflective of uptake rather than binding.
Figure 4
Figure 4
Expression of a Bacterial POT in Trypanosomes Induces Stumpy Formation (A) Expression of E. coli YjdL arrests growth of pleomorphic T. brucei in vitro when induced with doxycycline. n = 3 per group; error bars, SEM. (B) Expression of E. coli YjdL assessed by western blotting 48 hr and 72 hr after induction with doxycycline. PAD1 indicates stumpy formation, evident in the high density uninduced samples and the low density induced samples. Anti-EF1α provides a loading control. (C) E. coli YjdL (green) is located on the trypanosome cell surface when expression is induced. AMCA-sulfo-NHS (in blue) labels the parasite surface and flagellar pocket. Scale bar, 10 μm. (D) Expression of E. coli YjdL arrests growth of pleomorphic T. brucei in vivo when induced with doxycycline. n = 3 +DOX, n = 3 –DOX. (E) Mitochondrial and cell morphology of pleomorphic T. brucei induced or not to express E. coli YjdL at day 3 of infection. Uninduced cells have a linear mitochondrion (revealed by MitoTracker staining, “Mito”) characteristic of slender forms whereas induced parasites show branched mitochondrial staining and stumpy form morphology. Scale bar, 10 μm. (F) Differentiation to procyclic forms of pleomorphic T. brucei after harvest from infection on day 4 and exposure to 6 mM cis-aconitate for parasites induced (+DOX) or not (−DOX) to express E. coli YjdL. The low parasitemia E. coli YjdL-induced stumpy cells, and the uninduced high parasitemia stumpy cells generated by QS differentiated with similar efficiency. Error bars, SEM. (G) Expression of an E. coli YjdL E388A mutant in pleomorphic T. brucei grown in vivo. Reduced differentiation is observed compared to expression of the wild-type YjdL (A) despite effective protein expression (right). The introduced mutation is shown far right. Error bars, SEM.
Figure 5
Figure 5
Oligopeptide Mixtures Promote Stumpy Formation In Vitro (A) Growth of pleomorphic or monomorphic T. brucei cells in varying concentrations of autoclaved brain heart infusion broth at 48 hr. Error bars, SEM. (B) PAD1 expression of pleomorphic T. brucei cells in varying concentrations of autoclaved brain heart infusion broth at 48h. Error bars, SEM. (C) Representative images of PAD1 expression and morphology of pleomorphic cells in varying concentrations of BHI broth at 48 hr. PAD1 expression (in green) is evident on increasing proportions of the parasites with higher concentrations of autoclaved BHI; these cells also appear stumpy in morphology. The parasite nucleus and kinetoplast (stained with DAPI) is pseudo colored in magenta. Bar, 25 μm. (D) Growth of pleomorphic T. brucei in vitro in the presence of different oligopeptide containing extracts expressed relative to their growth without extract (“control”) at 48 hr. Error bars, SEM. (E) PAD1 expression of pleomorphic T. brucei exposed to the different concentrations of oligopeptide containing extracts at 48 hr. Error bars, SEM.
Figure 6
Figure 6
Pleomorphic Trypanosomes Exposed to Dipeptide or Tripeptide Combinations Terminated in Specific N-Terminal Amino Acids (A) The growth of pleomorphic T. brucei exposed to 500 μM dipeptide sublibraries over 72 hr compared to DMSO. Error bars, SEM. (B) The growth of pleomorphic T. brucei exposed to dipeptide sublibrary titrations from 250–62.5 μM over 72 hr compared to DMSO. Error bars, SEM. (C) The growth of pleomorphic T. brucei exposed to 125 μM tripeptide sublibraries (at 500 μM, all tripeptide sublibraries inhibited growth) over 72 hr compared to DMSO. Error bars, SEM. (D) The growth of pleomorphic T. brucei exposed to tripeptide sublibrary titrations from 250–62.5 μM over 72 hr compared to DMSO. Error bars, SEM. (E) PAD1 expression by pleomorphic T. brucei exposed to 125 μM of the specified tripeptide sublibraries at 72 hr. Error bars, SEM. (F) Immunofluorescence image of PAD1 expression by parasites exposed to 125 μM of the Trp-Aa1-Aa2 sublibrary. Scale bar, 20 μm. (G) The uptake of β-ALA-Lys-AMCA by E. coli expressing TbGPR89 in the presence of 2.5 mM competing unlabeled tri- or dipeptide sublibrary. Error bars, SEM.
Figure S5
Figure S5
Oligopeptidase Expression in Trypanosomes, Related to Figure 7 (A) Expression TbPGP or BiPN-TbPGP in vitro. Panels show the growth of parasites ± induction to express BiPN-TbPGP (left panel) or TbPGP (right panel) in vitro (n = 3). In each case expression does not affect the growth of the cells. Error bars = SEM. Inset western blots are shown to confirm protein expression with the BIPN fusion resulting in a larger protein. (B) Expression of BiPN-TbPOP or TbPOP in vitro. The panels show the growth of parasites ± induction to express BiPN-TbPOP (left panel) or TbPOP (right panel) in vitro (n = 3). In each case expression slows the growth of the cells. Error bars = SEM. Inset western blots show the induced expression of TbPOP and the expresison of the stumpy marker PAD1, which is present on the high density parasites not induced to express TbPOP and the low density parasites induced to express TbPOP. (C) Western blot demonstrating the extracellular release of TbPOP detected in the culture supernatant (S) with TbPOP in the absence of a BIPN secretory signal; samples were prepared after 1h or 2hr incubation in Creek’s minimal medium without serum (Creek et al., 2013) with TbPOP expression being induced or not with doxycycline. Tubulin remains in the pellet (P) fraction showing that there is no cell lysis.
Figure S6
Figure S6
Oligopeptidase Expression In Vivo Drives Stumpy Formation, Related to Figure 7 Growth of parasites induced to express BIPN-TbPGP, TbPGP or TbPOP in vivo. In each case the parasitemias are shown of equivalent numbers of parasites inoculated to initiate the infection, doxycycline being provided to the mice from day 1 of infection. In all cases there is reduced growth upon peptidase expression, this being more pronounced and consistent for BIPN-TbPGP than TbPGP. TbPOP was only analyzed without a BIPN leader, because the protein is naturally secreted (Figure S5C). Each growth profile represents analysis of duplicate or triplicate infections for each condition. Error bars = SEM. The western blot demonstrates inducible TbPOP expression, with the expression of the stumpy marker PAD1 being present on the high density parasites not induced to express TbPOP and the low density parasites induced to express TbPOP. EF1 alpha provides a loading control. M; mouse.
Figure 7
Figure 7
Peptidase-Expressing Bloodstream Trypanosomes Generate a Stumpy-Inducing Paracrine Signal (A) Schematic representation of the experimental regimen. Trypanosomes were induced to express secreted peptidases under doxycycline regulation, so generating an enhanced signal that promotes stumpy formation (“Producer line”). Co-infection with pleomorphic T. brucei cells with a Ty1 epitope tagged PFR acts as a “receiver” cell line that can be distinguished from “producer” cells via labeling of the flagellum. Right: representative field comprising “producer” cells (PFR) and “receiver” cells (PFR+) co-labeled or not with the stumpy marker, PAD1 (green). Scale bar, 15 μm. (B) Parasitemias of mice infected with the PFR-Ty1 cell line alone, or a coinfection of the PFR-Ty1 cell line with the BIPN-TbPGP line either induced or not to express the peptidase by doxycycline. Right: percentage PAD1+ PFRTy1 divided by the overall parasitemia revealing that the PFR-TY1 cells are induced to become stumpy despite the low parasitemia of the coinfection when induced. Data are derived from microscopic analysis of 2,000 cells in each sample on day 5 of infection; for PFR-Ty1 cells, >250 cells were scored as PAD1+ or PAD1. Error bars, SEM. (C) Parasitemias of mice infected with the PFR-Ty1 cell line alone, or a coinfection of the PFR-Ty1 cell line with the TbPOP line either induced or not to express the peptidase by doxycycline regulation. Right: percentage PAD1+ PFRTy1 cells divided by the overall parasitemia revealing that the PFR-TY1 cells are induced to become stumpy despite the low parasitemia of the coinfection when induced. Data are derived from microscopic analysis of 2,000 cells in each sample on day 5 of infection; for PFR-Ty1 cells, >250 cells were scored as PAD1+ or PAD1. Error bars, SEM. See also Figures S5, S6, and S7 and Tables S1, S2, S3, and S4.
Figure S7
Figure S7
Oligopeptidase Expression Generates a Paracrine Signal Driving Stumpy Formation, Related to Figure 7 (A) Coinfection of BIPN-PGP or TbPOP expressing cells (‘Producers’) with PFR-Ty1 pleomorphic parasites (‘receivers’). The histograms represent the % PAD1 cells for each cell type. PFR1-Ty1 cells express high levels of PAD1 at high parasitaemia (either when in a monoinfection or when co-infected with the producer line not induced to express the peptidase). With peptidase induction, the overall parasitemia is much lower (Figure 7) but high levels of PAD1 expression are expressed on the ‘receiver’ PFR-Ty1 line. The relative proportion of producer and receiver cells was also determined by microscopical scoring of the number of parasites with a labeled flagellum after reaction with the Ty1 specific antibody BB2, with at least 2000 cells analyzed in each infection, except the monoinfection with PFR-Ty1 cells alone (where all cells were PFR labeled from an analysis of at least 250 cells). The relative proportion of PFRTy1 cells was higher upon peptidase induction reflecting either reduced growth of the producer cells upon peptidase expression or a combination of autocrine and paracrine induced arrest in the producer cells, while receiver cells only exhibit a paracrine response to the induced peptidase expression. (B) The western blot detects the stumpy marker PAD1, which is present on the high density parasites not induced to express TbPOP and the low density parasites induced to express TbPOP, as well as the high density PFR-ty tagged cells alone. BB2 detects the epitope tag present on the PFR-Ty1 tagged ‘recipient cell line’, EF1alpha provides a loading control and the AnTat1.1 lanes demonstrate the integrity of the VSG regardless of the expression of the TbPOP peptidase by the producer cells. (C) Samples of human and bovine serum were mixed with an equal volume of standard PGPase assay buffer (50 mM HEPES, 1 mM EDTA and 10 mM DTT) and incubated overnight at 37°C with either recombinant TbPGP (5μl per 100μl) or an equivalent volume of assay buffer. When centrifuged following incubation, significant-sized, gelatinous (‘clot-like’) pellets were formed in the human serum samples which had been incubated without TbPGP; these pellets were much smaller in the samples incubated with TbPGP and were virtually absent from the bovine serum samples. The pellets were solubilised in equal volumes of SDS-PAGE loading buffer and analyzed by SDS-PAGE (see below). The pellets appeared to be composed of bulk serum proteins with no obvious enrichment for specific proteins, however, the total amount of protein was clearly much reduced in the human serum samples which included TbPGPase.

Comment in

References

    1. Aslett M., Aurrecoechea C., Berriman M., Brestelli J., Brunk B.P., Carrington M., Depledge D.P., Fischer S., Gajria B., Gao X. TriTrypDB: a functional genomic resource for the Trypanosomatidae. Nucleic Acids Res. 2010;38:D457–D462. - PMC - PubMed
    1. Bangs J.D., Brouch E.M., Ransom D.M., Roggy J.L. A soluble secretory reporter system in Trypanosoma brucei. Studies on endoplasmic reticulum targeting. J. Biol. Chem. 1996;271:18387–18393. - PubMed
    1. Barquilla A., Saldivia M., Diaz R., Bart J.M., Vidal I., Calvo E., Hall M.N., Navarro M. Third target of rapamycin complex negatively regulates development of quiescence in Trypanosoma brucei. Proc. Natl. Acad. Sci. USA. 2012;109:14399–14404. - PMC - PubMed
    1. Bastin P., Bagherzadeh Z., Matthews K.R., Gull K. A novel epitope tag system to study protein targeting and organelle biogenesis in Trypanosoma brucei. Mol. Biochem. Parasitol. 1996;77:235–239. - PubMed
    1. Bastos I.M., Motta F.N., Charneau S., Santana J.M., Dubost L., Augustyns K., Grellier P. Prolyl oligopeptidase of Trypanosoma brucei hydrolyzes native collagen, peptide hormones and is active in the plasma of infected mice. Microbes Infect. 2010;12:457–466. - PubMed

Publication types

MeSH terms