Review
. 2018 Dec 13;175(7):1731-1743.e13.
doi: 10.1016/j.cell.2018.10.014. Epub 2018 Nov 29.

Anti-NKG2A mAb Is a Checkpoint Inhibitor that Promotes Anti-tumor Immunity by Unleashing Both T and NK Cells

Affiliations
Review

Anti-NKG2A mAb Is a Checkpoint Inhibitor that Promotes Anti-tumor Immunity by Unleashing Both T and NK Cells

Pascale André et al. Cell. .

Abstract

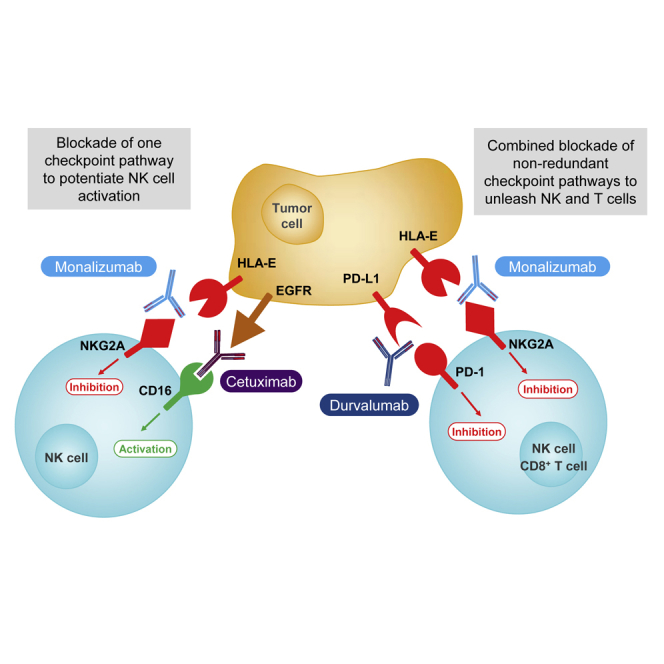
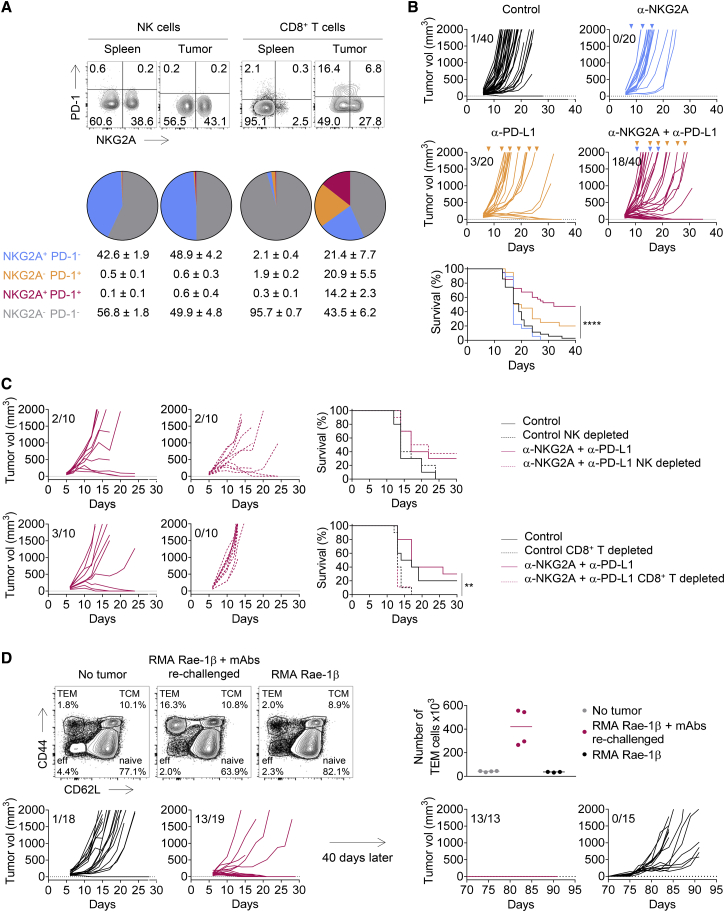
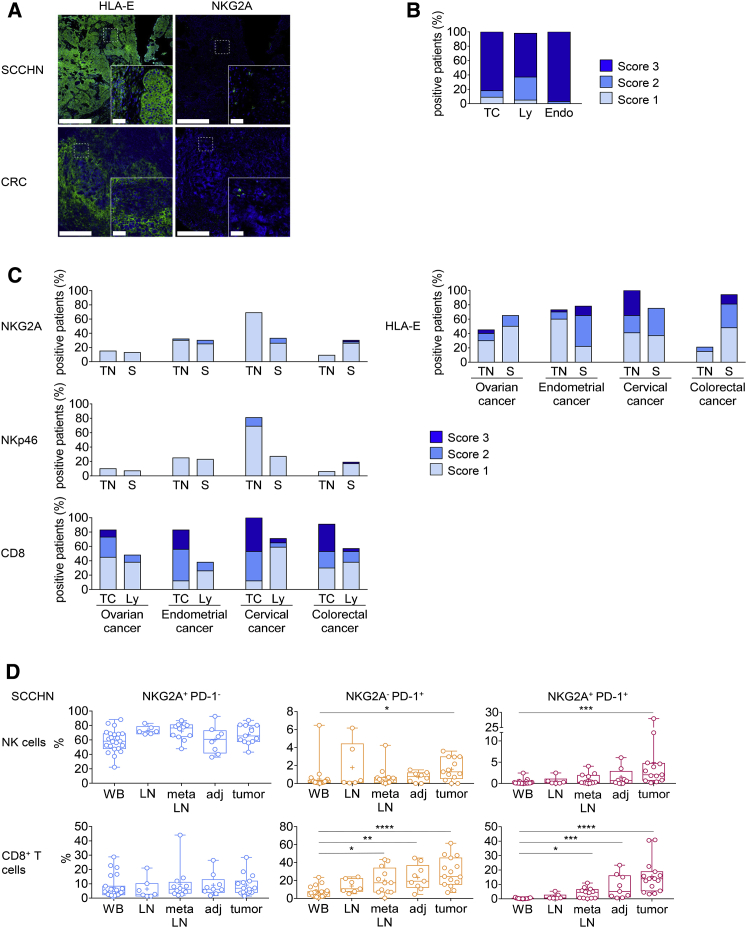
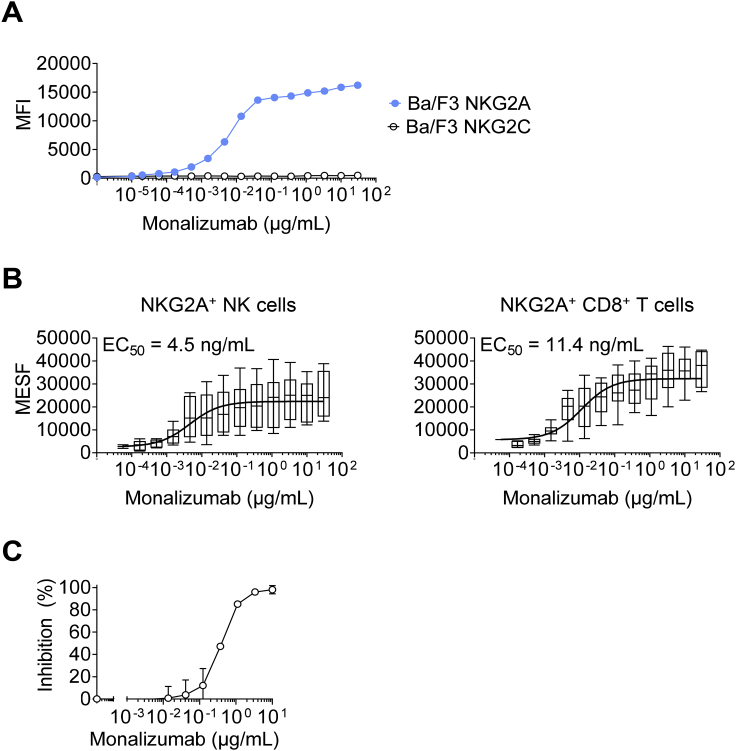
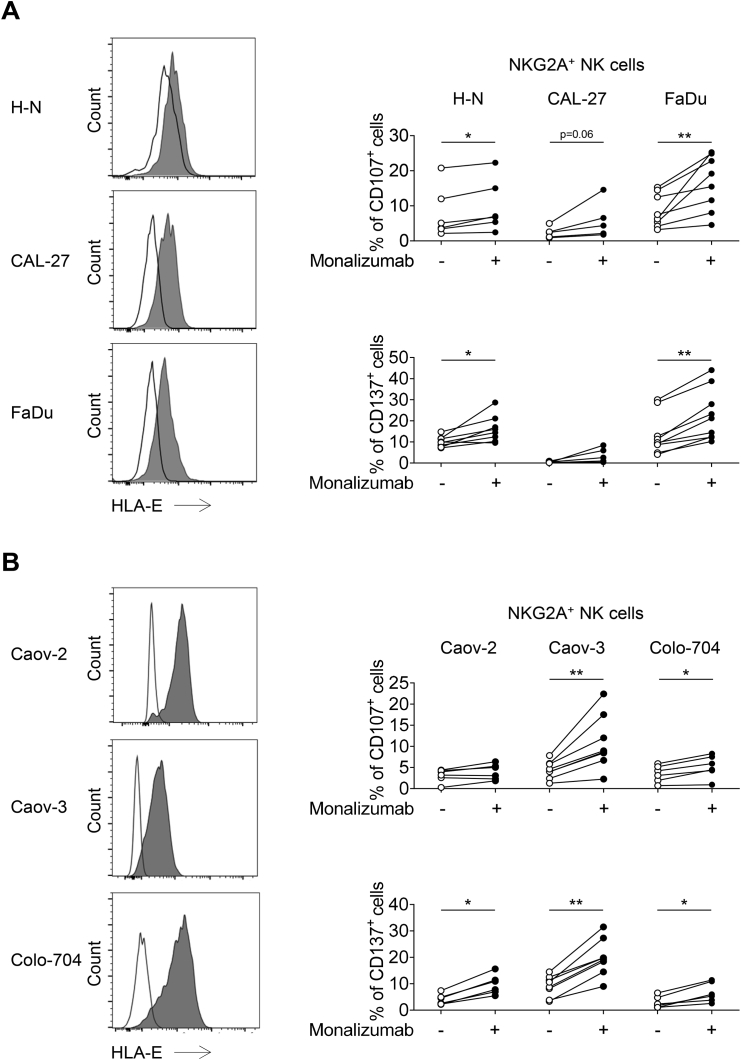
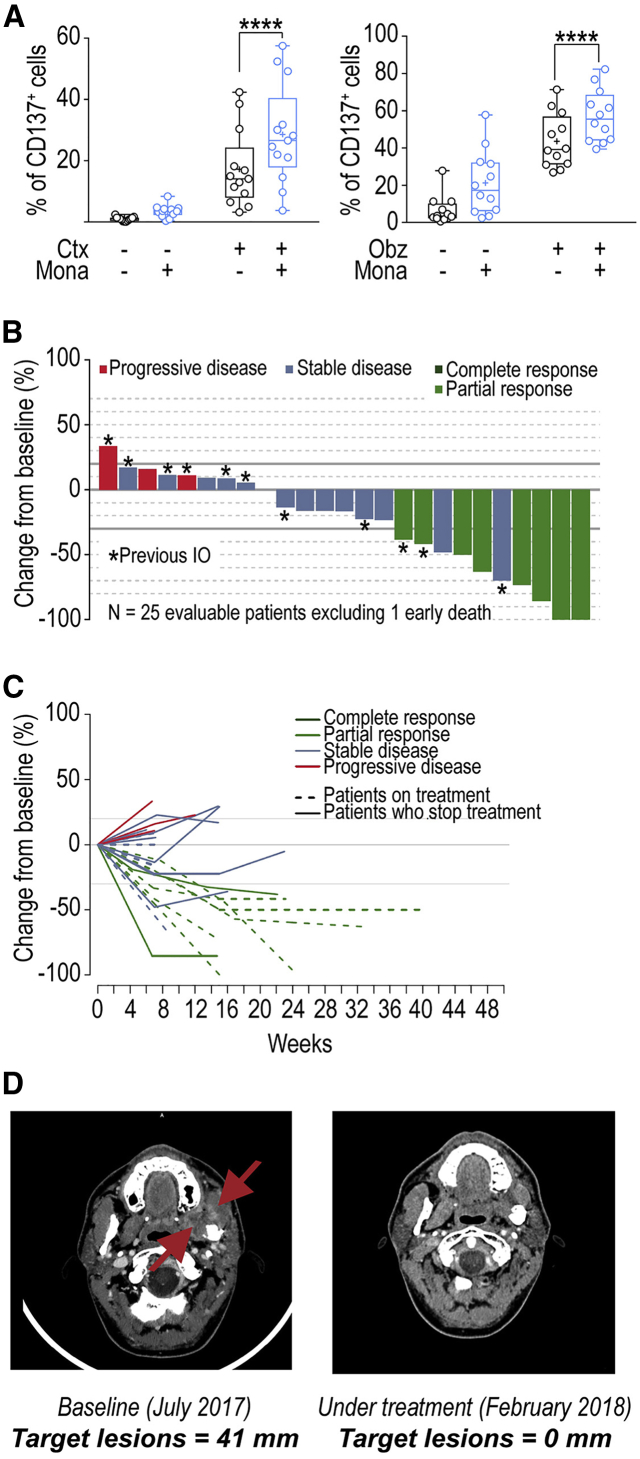
Checkpoint inhibitors have revolutionized cancer treatment. However, only a minority of patients respond to these immunotherapies. Here, we report that blocking the inhibitory NKG2A receptor enhances tumor immunity by promoting both natural killer (NK) and CD8+ T cell effector functions in mice and humans. Monalizumab, a humanized anti-NKG2A antibody, enhanced NK cell activity against various tumor cells and rescued CD8+ T cell function in combination with PD-x axis blockade. Monalizumab also stimulated NK cell activity against antibody-coated target cells. Interim results of a phase II trial of monalizumab plus cetuximab in previously treated squamous cell carcinoma of the head and neck showed a 31% objective response rate. Most common adverse events were fatigue (17%), pyrexia (13%), and headache (10%). NKG2A targeting with monalizumab is thus a novel checkpoint inhibitory mechanism promoting anti-tumor immunity by enhancing the activity of both T and NK cells, which may complement first-generation immunotherapies against cancer.

Keywords: CD8(+) T cells; cancer immunotherapy; immunce checkpoint inhibitor; inhibitory receptors; lymphocytes; natural killer cells; therapeutic monoclonal antibodies.


Figures

None
Graphical abstract
Figure S1
Figure S1
NKG2A Is an Inhibitory Receptor that Blocks the Anti-tumor Efficacy of NK and CD8+ T Cells, Related to Figure 1 (A) FACS histograms showing Qa-1b expression on A20 and A20 Qa-1b KO cells after stimulation with IFN-γ. White histograms: isotype control; gray histograms: anti-Qa-1b mAb. Numbers indicate the median fluorescence intensity. (B) NK cells were co-cultured with Qa-1b-deficient YAC-1 or Qa-1b-expressing A20 cells or targets in the presence of an anti-NKG2A mAb (m20d5) or an isotype control (IC). CD107a degranulation was measured and is represented on box and whiskers plots, with crosses to represent the mean values. The data presented are the pooled results of three independent experiments (n = 7). Wilcoxon matched-pairs signed rank test, p = 0.0156. (C) NKG2A+PD-1+CD8+ TILs were stimulated in vitro with A20 tumor cells in the presence of the indicated mAbs. The frequencies of CD107a-producing cells are shown. The data presented are the pooled results of four independent experiments (n = 15). One-way ANOVA followed by Dunn’s test, p = 0.043, ∗∗p = 0.0014, ∗∗∗p = 0.0005, ∗∗∗∗p < 0.0001.
Figure 1
Figure 1
NKG2A Is an Inhibitory Receptor that Blocks the Anti-tumor Efficacy of NK and CD8+ T Cells (A) Qa-1b-sufficient or -deficient A20 tumor cells were engrafted subcutaneously (s.c.) in BALB/c mice. (B) BALB/c mice were treated with an anti-aGM1 pAbs or with control rabbit serum, an anti-CD8α mAb, or rat IgG2b isotype control and then subcutaneously engrafted with A20 tumor cells. Graphs show tumor growth in each individual mouse and combined survival curves. Complete regressions are indicated. log rank test, ∗∗p = 0.0020; ns, no significant. (C) Experiment similar to that in (B), but with Qa-1b KO A20 tumor cells. Complete regressions are indicated. log rank test, ∗∗∗p = 0.0002 (NK cell depletion) and ∗∗∗p = 0.0006 (CD8+ T cell depletion). See also Figure S1.
Figure 2
Figure 2
Combined Blockade of NKG2A and PD-1/PD-L1 Promotes Anti-tumor Immunity in A20 Tumor-Bearing BALB/c Mice (A) Flow cytometry characterization of NK and CD8+ TILs 19 days after A20 tumor cells engraftment. The spleen was used as control. Upper panels: representative fluorescence-activated cell sorting (FACS) profiles of PD-1 and NKG2A expression on NK and CD8+ T cells in the spleen and the tumor bed. Lower panels: pie chart analysis (mean ± SD). The data presented are the pooled results of three independent experiments (n = 12). (B) A20 tumor cells were engrafted in BALB/c mice. Tumor-bearing mice were then treated at 3- to 4-day intervals with an isotype control (IC), anti-NKG2A, anti-PD-L1, or a combination of these last two mAbs. Graphs show tumor growth in each individual mouse and combined survival curves. The data presented are the pooled results of three independent experiments. Complete regression are indicated. log rank test, ∗∗p = 0.0087; ∗∗∗p = 0.0001; ∗∗∗∗p < 0.0001. (C) Experiment similar to that described in (B) but with treatment of the mice with an anti-asialo-GM1 pAbs or an anti-CD8α mAb 1 day before the initiation of immunotherapy with the combination of anti-NKG2A and anti-PD-L1 mAbs. Graphs show tumor growth in each individual and combined survival curves. Complete regression are indicated. log rank test, p < 0.0016; ∗∗p < 0.01; ∗∗∗p = 0.0001. See also Figure S2.
Figure S2
Figure S2
The Combined Blockade of NKG2A and PD-1/PD-L1 Promotes Anti-tumor Immunity in A20 Tumor-Bearing BALB/c Mice, Related to Figure 2 (A) A20 tumor cells were engrafted in BALB/c mice. Tumor-bearing mice were then treated at three- to four-day intervals with isotype control (IC) antibody, anti-NKG2A antibody, anti-PD-1 antibody or a combination of these last two antibodies. Graphs show tumor growth in each individual and combined survival curves. The data presented are the pooled results of two independent experiments. Log-rank test, ∗∗p = 0.0087, ∗∗∗p = 0.0001, ∗∗∗∗p < 0.0001. (B) Experiment similar to that described in (A) but with treatment of the mice with an anti-asialo-GM1 pAbs or an anti-CD8α mAb one day before the initiation of immunotherapy. Graphs show tumor growth in each individual and combined survival curves. Log Rank test, p < 0.0016, ∗∗p < 0.01, ∗∗∗p = 0.0001.
Figure S3
Figure S3
Qa-1b and PD-L1 Expression on RMA Rae-1β Tumor Cells, Related to Figure 3 FACS histograms showing Qa-1b and PD-L1 expression on RMA Rae-1β tumor cells. White histograms: isotype control; gray histograms: anti-Qa-1b or anti-PD-L1 mAbs. Numbers indicate the median fluorescence intensity.
Figure 3
Figure 3
Combined Blockade of NKG2A and PD-1/PD-L1 Promotes Anti-Tumor Immunity in RMA Rae-1β Tumor-Bearing C57BL/6J Mice (A) RMA Rae-1β tumor cells were injected subcutaneously into C57BL/6J mice. Flow cytometry characterization of NK and CD8+ TILs 12 days post-injection, with the spleen used as the standard. Upper panels: representative FACS profiles of PD-1 and NKG2A expression at the surface of NK and CD8+ T cells in the spleen and the tumor bed. Lower panels: pie chart analysis (mean ± SD). The data presented are the pooled results of two independent experiments (n = 8 mice). (B) RMA Rae-1β tumor-bearing C57BL/6J mice were treated with IC antibodies, anti-NKG2A, anti-PD-L1, or a combination of these last two mAbs. Graphs show tumor growth in each individual mouse and combined survival curves. The data presented are the pooled results of four independent experiments. Complete regressions are indicated. log rank test, ∗∗∗∗p < 0.0001. (C) Experiment similar to that in (B), except that the mice were treated with anti-NK1.1 mAb or anti-aCD8α mAb 1 day before the initiation of immunotherapy with the combination of anti-NKG2A and anti-PD-L1 mAbs. Graphs show tumor growth in each individual mouse and combined survival curves. Complete regressions are indicated. log rank test, ∗∗p = 0.0024. (D) Upper left panels: FACS profiles of CD44 and CD62L expression on CD8+ T cells in the spleen of naive (no tumor) mice, mice receiving their first injection of RMA Rae-1β tumor cells (RMA Rae-1β), and mice previously injected with RMA Rae-1β tumors, cured by immunotherapy and rechallenged (RMA Rae-1β + mAbs rechallenged). Percentages of naive (CD44CD62L+), central memory (TCM, CD44+CD62L+), effector memory (TEM, CD44+CD62L) and effector CD8+ T cells (eff, CD44CD62L) are indicated. Upper right panel: absolute numbers of effector memory CD8+ T cells in the spleen are shown. Lines represent medians. Lower panels: RMA Rae-1β tumor-bearing C57BL/6J mice were treated with IC antibody or with a combination of anti-NKG2A and anti-PD-L1 mAbs. Mice cured by immunotherapy (n = 13) were rechallenged subcutaneously with RMA-Rae-1β tumor cells after 70 days. Untreated C57BL/6J mice (n = 15) also received injections of RMA-Rae-1β cells as a control. The graphs show tumor growth in each individual mouse. The data presented are the pooled results of two independent experiments. See also Figure S3.
Figure 4
Figure 4
CD8+, NKp46+ and NKG2A+ Immune Cells Are Present in Several Types of HLA-E-Expressing Solid Cancers (A) Representative example of HLA-E and NKG2A expression on frozen sections from SCCHN and CRC cancer samples. Bright-field images were inverted, and RGB channel splitting was performed. Pseudocolors were attributed to each marker (blue for hematoxylin and green for HLA-E or NKG2A). Scale bars represent 500 μm for low magnification or 50 μm for right inserts. (B) Semiquantitative analysis of HLA-E expression on formalin-fixed paraffin-embedded (FFPE) SCCHN samples (n = 65). HLA-E expression was assessed on tumor cells (TC), lymphocytes (Ly), and endothelial cells (Endo). Score 1 = 1%–33%; score 2 = 34%–66%; score 3 ≥ 66% of positive cell. (C) Semiquantitative analysis of NKG2A-, NKp46-, and CD8-positive cells and of HLA-E expression on colorectal cancer (n = 48), ovarian cancer (n = 40), endometrial cancer (n = 40) and cervical cancer (n = 17). CD8, NKp46 and NKG2A cells were quantified in the tumor nest (TN) and stroma (S). HLA-E expression was assessed separately on tumor cells (TC) and lymphocytes (Ly.). Score 1 = 1%–33%; Score 2 = 34%–66%; Score 3 ≥ 66% of positive cells. (D) Percentages of NK cells (upper panels) and CD8+ T cells (lower panels) expressing NKG2A and PD-1 in SCCHN cancer samples. Cells from WB (whole blood, n = 23), LN (normal lymph node, n = 6), meta LN (metastatic lymph node, n = 12), adj (healthy tissue adjacent to the tumor, n = 8), and tumor (n = 13) were analyzed by flow cytometry. Box and whiskers plot, in which the means are indicated by crosses. Kruskal-Wallis analysis followed by Dunn’s multiple comparisons test. p < 0.05; ∗∗p ≤ 0.01; ∗∗∗p ≤ 0.001; ∗∗∗∗p < 0.0001. See also Figure S4 and Table S1.
Figure S4
Figure S4
HLA-E and PD-L1 Expression in Solid Cancers, Related to Figure 4 Formalin-fixed paraffin-embedded (FFPE) tissue microarrays were stained by immunohistochemistry with anti-HLA-E (clone MEM-E/02) or anti-PD-L1 (clone E1L3N) antibodies. For each indication, scatterplots represent the percentage of the area stained for HLA-E or PD-L1 for each spot. Quantification was performed with Halo (Indicalabs). Colored bars indicate the mean (±SD). Lung (n = 45), pancreas (n = 79), stomach (n = 76), colon (n = 109), H&N (n = 70) and liver tumors (n = 106) were studied.
Figure S5
Figure S5
Characterization of Monalizumab, Related to Figures 5 and 6 (A) Titration of monalizumab on Ba/F3 cells expressing human NKG2A or NKG2C. Monalizumab was detected with a secondary antibody conjugated to PE. (B) Titration of monalizumab on NKG2A+ NK and CD8+ T cells from the PBMCs of healthy donors. (C) Monalizumab inhibits the binding of HLA-E tetramers to CD94/NKG2A receptors on human peripheral NK cells. Human PBMCs (n = 4 with NKG2C+ NK cells < 3.5%) were incubated with various concentrations of monalizumab (ranging from 0 to 10 μg/mL), washed and then incubated with PE-conjugated HLA-E tetramers. NK cells were defined as CD56+ CD3- lymphocytes. The percentage inhibition was calculated as follows: inhibition (%) = 100 – 100[(MFI PE (at X μg/mL of monalizumab) – MFI PE FMO)/(MFI PE (at 0 μg/mL of monalizumab) - MFI FMO)]. MFI: mean fluorescence intensity; FMO: fluorescence minus one.
Figure 5
Figure 5
Monalizumab and Durvalumab Unleash NK and CD8+ T Cell Function In Vitro (A) NK cells were co-cultured with K562 or K562 cells expressing HLA-E in the presence or absence of monalizumab. The frequencies of CD107-positive NK cells are shown. Box and whiskers plot, with the means indicated by crosses. N = 8. The whiskers are drawn down to the 25th percentile minus 1.5 times IQR (interquartile range) and up to the 75th percentile plus 1.5 times IQR. Friedman analysis followed by Dunn’s multiple comparisons test. ∗∗p = 0.006; ∗∗∗p = 0.0001. (B) Purified 7 days IL-2-activated NK cells were co-cultured or K562 cells expressing HLA-E in the presence or absence of monalizumab. The frequencies of CD107 and IFN-γ-positive NK cells are shown. Non-parametric Wilcoxon matched-pairs rank test. N = 6; p = 0.0313. (C) NK cells were stimulated in vitro with IL-15 for 9 days. The data shown are the frequencies of NK cells expressing NKG2A or PD-1 before (day 0) and after (day 9) culture. (D) The NK cells generated in (C) were co-cultured with K562 cells expressing HLA-E or co-expressing HLA-E and PD-L1 without (control) or with monalizumab (mona), durvalumab (durva), or both these antibodies (combo). The data shown are the frequencies of CD107-expressing NKG2A+ PD-1+or PD-1 NK cells. Box and whiskers plot, with the means indicated by crosses like in Figure 5A. N = 13 donors. p < 0.05; ∗∗p < 0.01; ∗∗∗p < 0.001; ∗∗∗∗p < 0.0001. (E) CD8+ T cells were co-cultured in vitro with monocytes in the presence of IL-15 and Flu peptide for 9 days. Top panel: one representative dot plot showing the frequency of Flu tetramer positive (TMr+) CD8+ T cells after culture (n = 14). Bottom panel: frequencies of NKG2A+ and/or PD-1+ cells after gating on TMr+ CD8+ T cells (n = 14). (F) The CD8+ T cells generated in (E) were co-cultured with Flu peptide-pulsed K562 cells expressing PD-L1, HLA-E and HLA-A2 without (control) or with monalizumab (mona), durvalumab (durva), or both antibodies (combo). The data shown are the frequencies of CD107-expressing (upper panels) and IFN-γ-secreting (lower panels) NKG2A+ or NKG2A CD8+ T cells (n = 17). The whiskers are drawn like in Figure 5A. p ≤ 0.05; ∗∗p < 0.01; ∗∗∗p < 0.001; ∗∗∗∗p < 0.0001. (G) The CD8+ T cells generated in (E) were co-cultured with Flu peptide-pulsed K562 cells expressing PD-L1, HLA-E, and HLA-A2 loaded with Cr51 without (control) or with monalizumab (mona), durvalumab (durva), or both antibodies (combo). The data shown are the frequencies of K562 target cell lysis. N = 14 donors. The whiskers are drawn like in Figure 5A. p < 0.05; ∗∗p < 0.01; ∗∗∗p < 0.001. See also Figures S5 and S6.
Figure S6
Figure S6
Monalizumab Unleash NK Cell Function In Vitro, Related to Figure 5 (A) FACS profiles showing HLA-E expression at the cell surface in SCCHN cell lines. White histograms: isotype control; gray histograms: anti-HLA-E mAb. NK cells were co-cultured with the cell line indicated, in the presence or absence of monalizumab. The frequencies of CD107- and CD137-producing NKG2A+ NK cells are shown. Each donor is represented by a single dot. Wilcoxon matched-pairs signed-rank test,  p < 0.05, ∗∗ p < 0.01. (B) FACS profiles showing HLA-E expression at the cell surface in ovarian cancer cell lines. White histograms: isotype control; gray histograms: anti-HLA-E mAb. NK cells were co-cultured with the cell line indicated (after overnight stimulation of the cell line with IFN-γ) in the presence or absence of monalizumab. The frequencies of CD107- and CD137-producing NKG2A+ NK cells are shown. Each donor is represented by a single dot. Wilcoxon matched-pairs signed-rank test, p < 0.05, ∗∗ p < 0.01.
Figure 6
Figure 6
Monalizumab Enhances Human NK Cell-Mediated ADCC and Anti-tumor Activity of Monalizumab and Cetuximab (A) Left panel: NK cells from healthy donors were co-cultured with the CAL-27 SCCHN cell line in the presence or absence of monalizumab (Mona) or cetuximab (Ctx). The data shown are the frequencies of CD137-expressing NKG2A+ NK cells after 24 hr. N = 13. Student t test comparing the Mona + Cetux combination with Ctx as single agent ∗∗∗∗p < 0.0001. Right panel: NK cells from healthy donors were co-cultured with 721.221 cells expressing HLA-Cw3 and HLA-Cw4 in the presence or absence of monalizumab (Mona) or obinutuzumab (Obz). The data shown are the frequencies of CD137-expressing NKG2A+ NK cells after 24 hr. N = 12. Student’s t test comparing the Mona + Obz combination with Obz as a single agent. ∗∗∗∗p < 0.0001. (B) Waterfall plot of the largest change in target lesion relative to the baseline. (C) Spider plot of the largest change in target lesion relative to the baseline. The patient who died early, due to disease progression, before the first assessment is not represented in these graphs. In accordance with RECIST 1.1, a confirmation of response was required. (D) Example of a partial response after treatment with the Mona + Cetux combination in a patient with recurrent oral cavity cancer (left masticator space) previously treated by surgery, chemotherapy (cisplatin), and radiation therapy. See also Table 1.

Comment in

References

    1. André P., Brunet C., Guia S., Gallais H., Sampol J., Vivier E., Dignat-George F. Differential regulation of killer cell Ig-like receptors and CD94 lectin-like dimers on NK and T lymphocytes from HIV-1-infected individuals. Eur. J. Immunol. 1999;29:1076–1085. - PubMed
    1. Baumeister S.H., Freeman G.J., Dranoff G., Sharpe A.H. Coinhibitory pathways in immunotherapy for cancer. Annu. Rev. Immunol. 2016;34:539–573. - PubMed
    1. Benson D.M., Jr., Hofmeister C.C., Padmanabhan S., Suvannasankha A., Jagannath S., Abonour R., Bakan C., Andre P., Efebera Y., Tiollier J. A phase 1 trial of the anti-KIR antibody IPH2101 in patients with relapsed/refractory multiple myeloma. Blood. 2012;120:4324–4333. - PMC - PubMed
    1. Bertone S., Schiavetti F., Bellomo R., Vitale C., Ponte M., Moretta L., Mingari M.C. Transforming growth factor-beta-induced expression of CD94/NKG2A inhibitory receptors in human T lymphocytes. Eur. J. Immunol. 1999;29:23–29. - PubMed
    1. Brady J., Hayakawa Y., Smyth M.J., Nutt S.L. IL-21 induces the functional maturation of murine NK cells. J. Immunol. 2004;172:2048–2058. - PubMed

Publication types

MeSH terms

Substances