. 2018 Dec 11;11(6):1462-1478.
doi: 10.1016/j.stemcr.2018.11.001. Epub 2018 Nov 29.

Transcription Factor Levels after Forward Programming of Human Pluripotent Stem Cells with GATA1, FLI1, and TAL1 Determine Megakaryocyte versus Erythroid Cell Fate Decision

Affiliations

Transcription Factor Levels after Forward Programming of Human Pluripotent Stem Cells with GATA1, FLI1, and TAL1 Determine Megakaryocyte versus Erythroid Cell Fate Decision

Amanda Dalby et al. Stem Cell Reports. .

Abstract

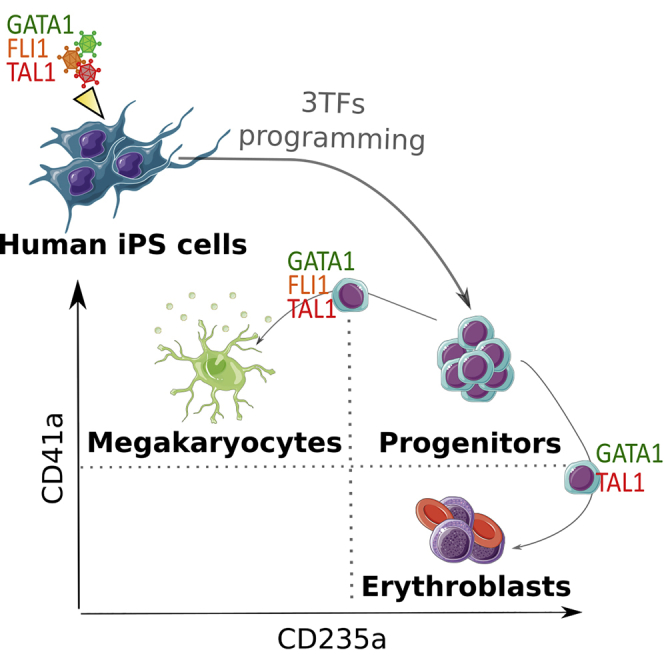
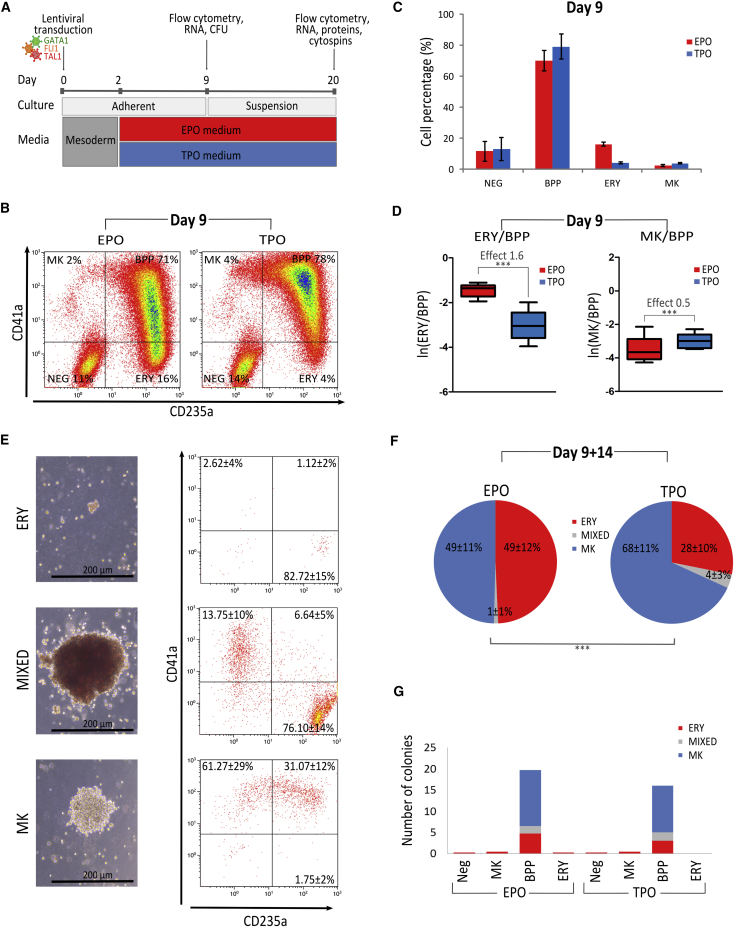
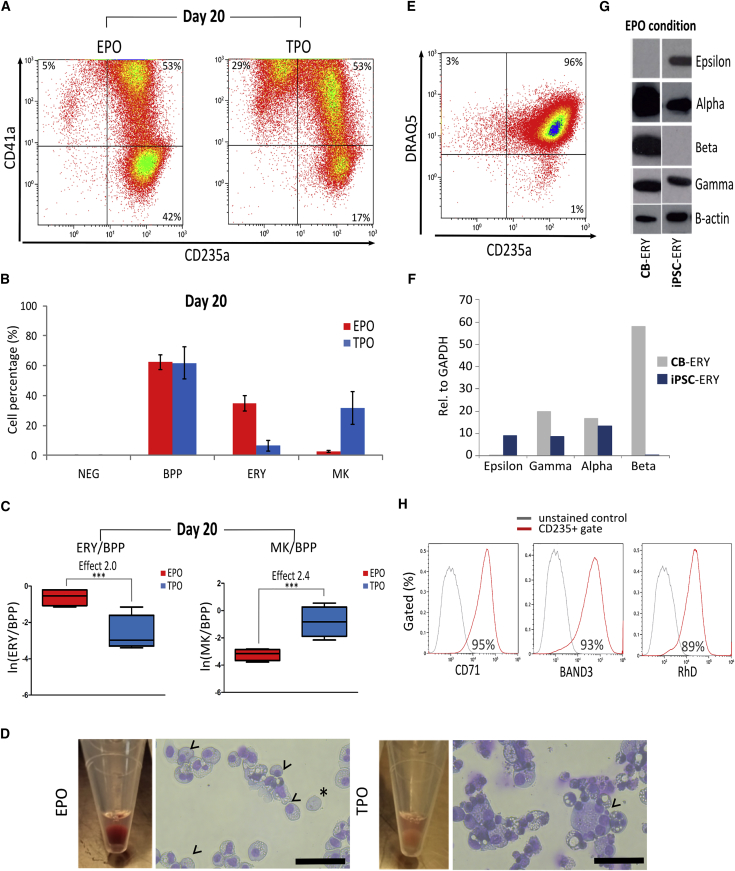
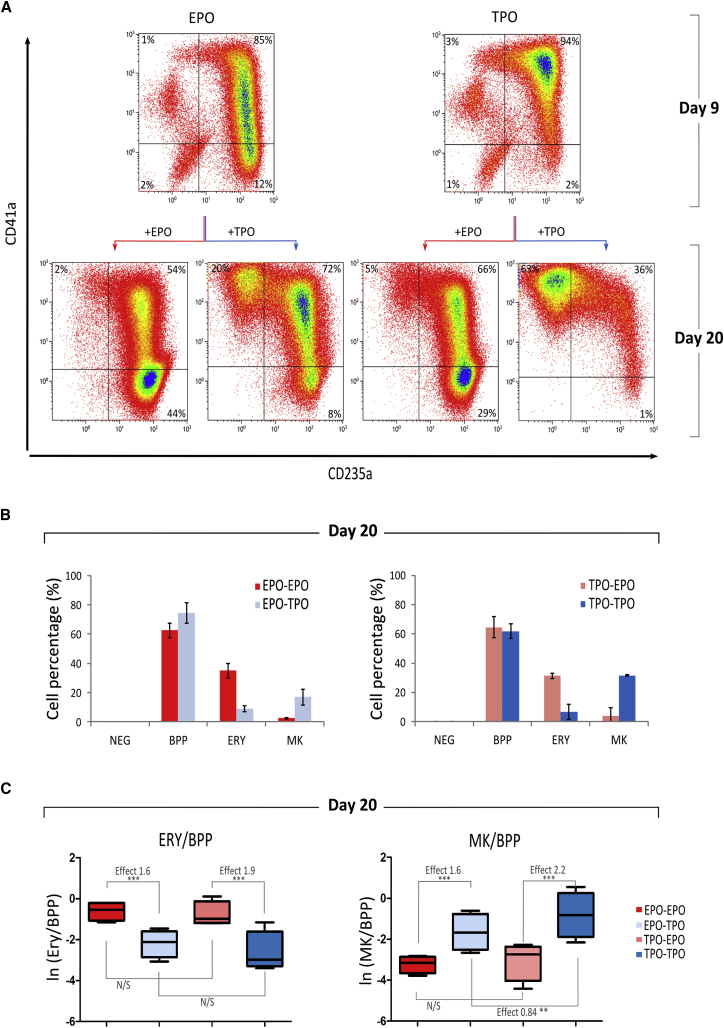
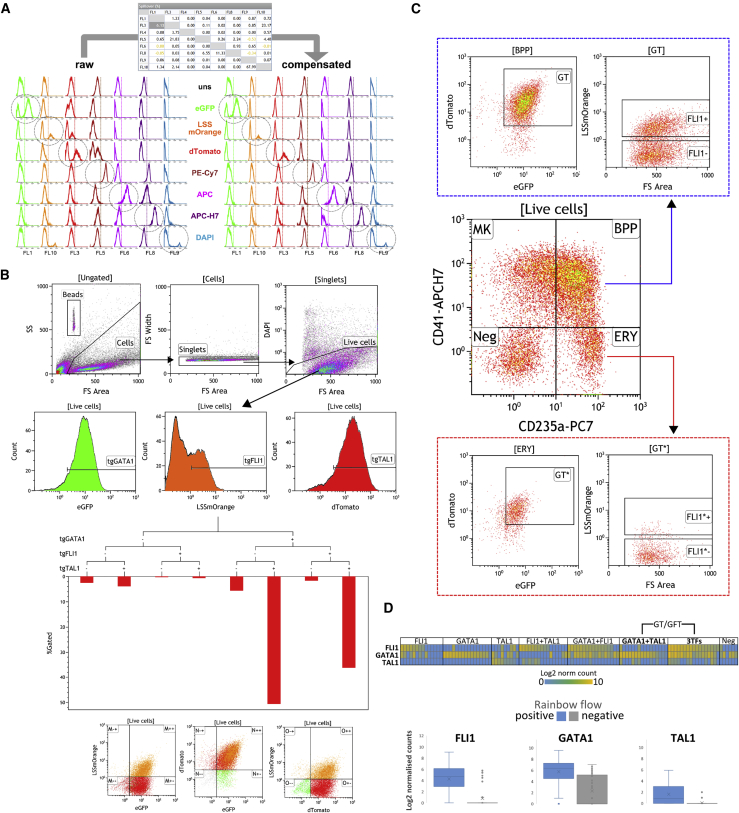
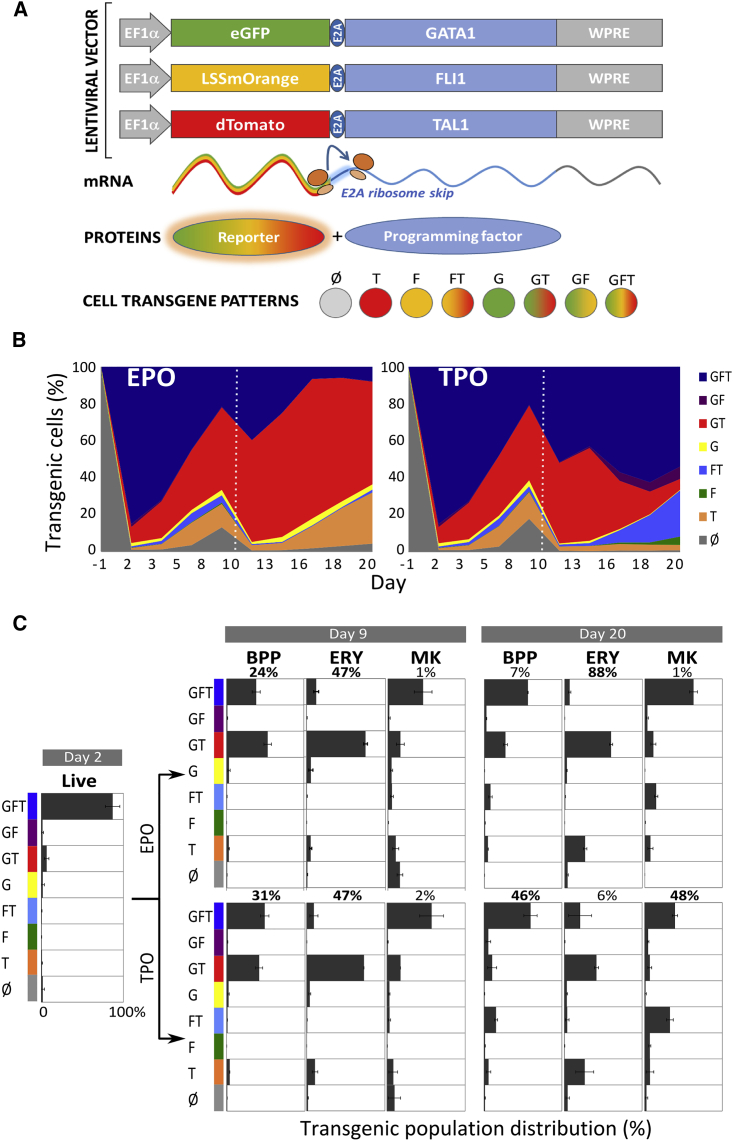
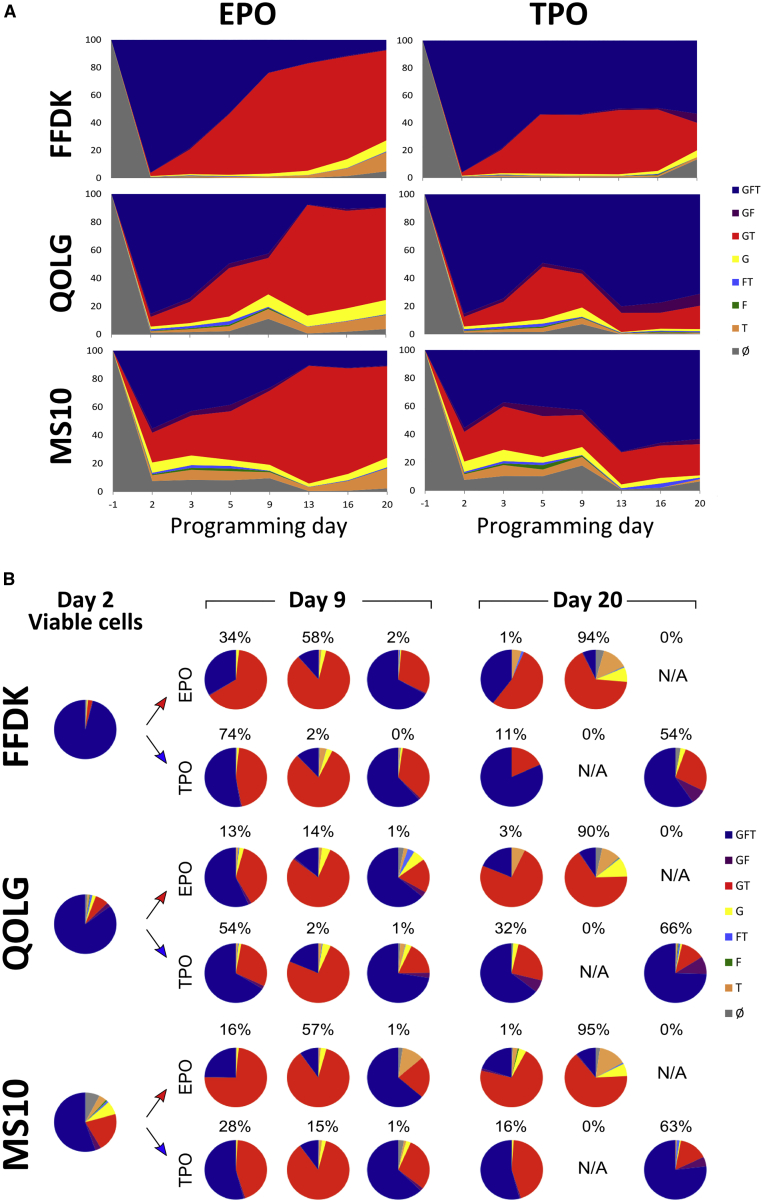
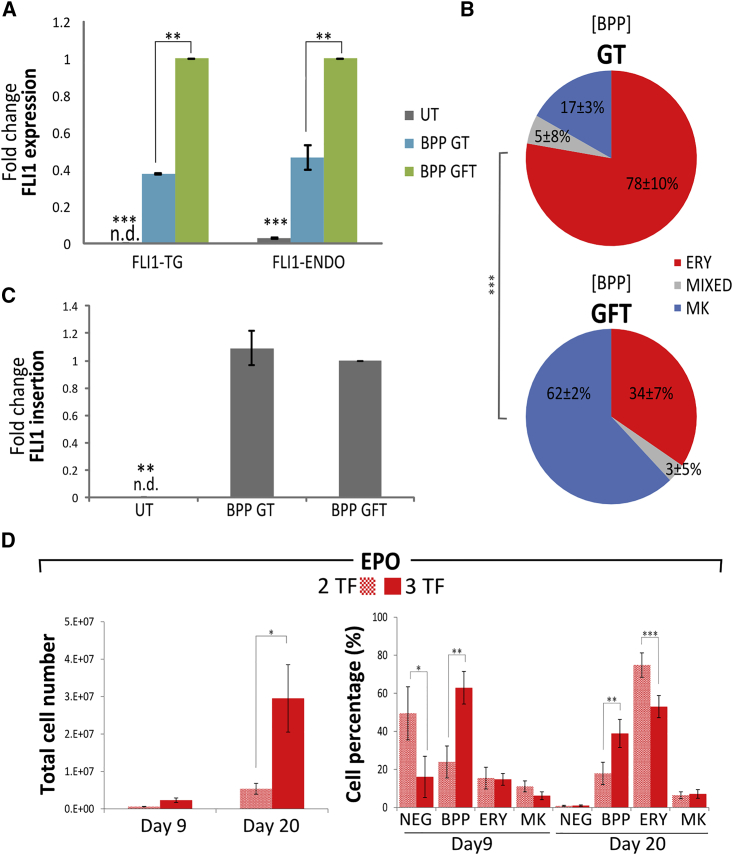
The production of blood cells and their precursors from human pluripotent stem cells (hPSCs) in vitro has the potential to make a significant impact upon healthcare provision. We demonstrate that the forward programming of hPSCs through overexpression of GATA1, FLI1, and TAL1 leads to the production of a population of progenitors that can differentiate into megakaryocyte or erythroblasts. Using "rainbow" lentiviral vectors to quantify individual transgene expression in single cells, we demonstrate that the cell fate decision toward an erythroblast or megakaryocyte is dictated by the level of FLI1 expression and is independent of culture conditions. Early FLI1 expression is critical to confer proliferative potential to programmed cells while its subsequent silencing or maintenance dictates an erythroid or megakaryocytic fate, respectively. These committed progenitors subsequently expand and mature into megakaryocytes or erythroblasts in response to thrombopoietin or erythropoietin. Our results reveal molecular mechanisms underlying hPSC forward programming and novel opportunities for application to transfusion medicine.

Keywords: erythroblast; forward programming; lineage fate decision; megakaryocyte; pluripotent stem cells.


Figures

None
Graphical abstract
Figure 1
Figure 1
Forward Programming of hPSCs with GATA1, FLI1, and TAL1 Generates a Bipotent Megakaryocyte/Erythroid Population (A) Schematic representation of the experimental setup. Following transduction with three lentiviruses and an initial mesoderm-promoting 2-day culture, cells were divided into an erythroid (EPO) or MK (TPO) culture. (B and C) Cells from the EPO and TPO culture conditions were analyzed by flow cytometry at day 9 post-transduction. (B) Representative dot plots for CD41a and CD235a expression and (C) chart summarizing the percentages of cells belonging to the non-programmed (NEG) (CD41a−/CD235a−), bipotent (BPP) (CD41a+/CD235a+), erythrocyte (ERY) (CD41a−/CD235a+), and megakaryocyte (MK) (CD41a+/CD235a−) populations, respectively (n = 5, mean ± SEM); EPO culture (red bars), TPO culture (blue bars). (D) Boxplots over five replicates of the log(e) of the number of ERYs (left plot) and MKs (right plot) divided by the number of BPPs as detected by flow cytometry at day 9. The log odds of cells being ERY rather than BPP (“mean effect”) in EPO (versus TPO) was 1.6, while the log odds of a cell being an MK rather than BPP in TPO (versus EPO) was 0.5 (∗∗∗p < 0.001). (E and F) The colony potential of day 9 cells was assessed by colony-forming unit (CFU) assays. Cells were cultivated in duplicate in semi-solid medium and the colony outcome (number and morphology) analyzed blindly by at least two operators after 14 days. (E) Exemplars of the three types of colonies recorded, including erythroid (ERY), megakaryocytic (MK), or mixed colonies containing both erythroid and MK cell types (MIXED). (F) The pie charts show CFU distribution depending on culture condition (EPO versus TPO; n = 4, mean% ± SEM); ERY in red, MK in blue and MIXED in gray. Poisson regression analysis shows that the distribution of the number of colonies per cell type depends on cytokine exposure (∗∗∗p < 0.001). (G) Colony potential of day 9 cells sorted according to their cell surface markers. Only cells expressing both CD235a and CD41a showed colony-forming potential.
Figure 2
Figure 2
Maturation of the Forward Programmed hPSCs Day 9 FoP cells were further cultured in suspension in EPO or TPO conditions and cell differentiation analyzed at day 20 post-transduction. (A) Representative flow cytometry dot plots for CD41a and CD235a expression. (B) Percentages of cells belonging to the undifferentiated NEG (CD41a−/CD235a−), BPP (CD41a+/CD235a+), ERY (CD41a−/CD235a+), and MK (CD41a+/CD235a−) populations, respectively, in the different culture conditions (n = 4, mean ± SEM); EPO culture (red bars), TPO culture (blue bars). (C) Boxplots over sets of four replicates of the log(e) of the number of ERYs (left plot) and MKs (right plot) over the number of BPPs as detected by flow cytometry. The log odds of cells being ERY or MK (mean effect) rather than BPP were strongly associated with cytokine exposure and were 2.0 (ERY in EPO) and 2.4 (MK in TPO) (∗∗∗p < 0.001). (D) Pictures of day 20 cell pellets from representative EPO (left) and TPO (right) cultures and cell morphology analyzed by Giemsa staining. Cytospins show normoblasts with condensed eccentric nuclei (arrowheads) and an enucleated reticulocyte (asterisk) from the EPO (left) culture and large polyploid MKs (arrowheads) from the TPO (right) culture. Scale bar, 50 μm. (E) Representative flow cytometry dot plot of day 20 cells analyzed for expression of CD235a and the nuclear staining DRAQ5. Enucleated reticulocytes (bottom right quadrant) represent only a single-figure percentage of the whole-cell population. (F) RNA was extracted from day 20 forward-programmed cells (iPSC-ERY) and cord blood-derived erythroblasts (CB-ERY) and analyzed by qRT-PCR to quantify the expression of the ε-, γ-, α-, and β-globin chains (n = 1). (G) Whole-cell extracts were analyzed for ε-, γ-, α-, and β-globin content by western blotting. The left panels represent the results from cell lysates of CB-ERY and the right panels those from iPSC forward-programmed erythroblasts (iPSC-ERY); β-actin was used as protein loading control (n = 1). (H) Representative flow cytometry histograms of CD71, BAND3, and RhD expression in CD235a+-gated cells from the EPO cultures; isotype control (gray line) and stained cells (red line).
Figure 3
Figure 3
The impact of Cytokines Used in the Early and Late Phases of Culture on Erythroid and MK Differentiation Cells were FoP in EPO or TPO until day 9 (early phase) and then maintained in the same medium or switched to the other cytokine condition for the second phase (days 9–20). The impact on MK and ERY differentiation was monitored by flow cytometry at days 9 and 20. (A) Representative flow cytometry dot plots for CD41a and CD235a expression on days 9 and 20 of FoP following culture regimens indicated by arrows. (B) Percentages of cells at day 20 belonging to the NEG (CD41−/CD235−), BPP (CD41+/CD235+), ERY (CD41-/CD235+), and MK (CD41+/CD235−) populations, respectively (n = 4, mean ± SEM). (C) Boxplots over sets of four replicates of the log(e) of the number of ERYs (left plot) and MKs (right plot) over the number of BPPs as detected by flow cytometry at day 20, broken down by cytokine exposure at days 9 and 20. The mean effect of TPO used between days 9 and 20 on a cell being an MK rather than BPP was similar (2.2 and 1.6) for cells cultured in TPO and EPO between days 2 and 9, respectively (∗∗∗p < 0.001). The mean effect of EPO used between days 9 and 20 on a cell being an ERY rather than BPP was similar too (1.9 and 1.6) for each of the condition used between days 2 and 9, respectively (∗∗∗p < 0.001). By contrast, conditional on the second cytokine, the effect of the cytokine used between days 2 and 9 on the MK/BPP and ERY/BPP were not significant in three of the four comparisons and below one for the fourth.
Figure 4
Figure 4
Rainbow Analysis by Flow Cytometry Faithfully Reports Levels of 3TF Transgenic Expression Human iPSCs were transduced with the three rainbow vectors designed to report transgene expression and analyzed by multicolor flow cytometry for expression of eGFP(GATA1), LSSmOrange(FLI1), and dTomato(TAL1), in addition to the surface markers Pe-Cy7(CD235a), APC(CD309/CD42a), and APC-H7(CD41), and the DNA stain DAPI (viability). Representative data shown from the FFDK cell line at day 9 post-transduction. (A) Single-color control samples were run alongside each flow experiment to set up a compensation matrix efficiently correcting for spillover between optical channels. (B) Gating strategy for analysis of the rainbow sub-populations. Single-color histograms were used to read each rainbow color separately from the single live cell gate. The statistics for the eight unique transgenic populations were then collected using the radar plot capacity of the Beckman Coulter Kaluza software. (C) Flow cytometry sorting gating strategy for day10 cells. The [BPP] population was defined from the single live cell gate as cells co-expression the surface markers CD41 and CD235. The [BPP] population was further gated for cells co-expressing the reporters eGFP(GATA1) and dTomato(TAL1) further split into LSSmOrange(FLI1) positive and negative cells: this led to the collection of the [BPP-GFT] and [BPP-GT] populations, respectively, for the downstream analyses described in the manuscript. Illustration of the rainbow expression profile in the [ERY] population is also shown as a contrasting profile. (D) The expression of the transgenic TFs from flow-sorted populations based on rainbow reporter expression was further analyzed at the transcript level and single-cell resolution by RNA sequencing. The Log2 normalized transgenic read counts from the eight possible rainbow combinations are shown as a heatmap (n = 111 cells). The boxplots show pooled data from rainbow-positive (blue) or -negative (gray) cells taking in consideration a single rainbow reporter at a time from the same dataset.
Figure 5
Figure 5
Bipotent Progenitors, Megakaryocytes, and Erythroblasts Have Consistent Transgene Expression Patterns Regardless of the Culture Cytokines Forward programming was performed using rainbow vectors and transgene expression patterns were identified by flow cytometry. (A) Schematic representation of the rainbow vector system. The open reading frame (GATA1, FLI1, and TAL1) for each transcription factor was cloned downstream of a different reporter gene (eGFP, LSSmOrange, and dTomato, respectively) separated by a self-cleaving E2A sequence (see vector maps in Supplemental Experimental Procedures). This ensures the production of the reporter, and programming transcription factor proteins are proportional since they are derived from a single mRNA. The fluorescence directly reports the programming factor expression in every single cell (see Figure S5). (B) Representative depiction of the dynamic evolution of transgene expression patterns in viable cells from the hPSC stage (day −1) until day 20 post-transduction in EPO (left) and TPO (right) conditions. Cells were gated according to expression of G(ATA1), F(LI1), and T(AL1). (C) FoP cell surface markers expression and transgene expression were analyzed by flow cytometry at day 2 (left column), day 9 (middle column), and day 20 (right column) post-transduction (EPO cultures in the top panel and TPO cultures in the bottom panel). Cells have been divided according to expression of differentiation markers (CD235a and CD41a) into BPP (CD41a+ CD235a+), ERY (CD235a+ CD41a−), and MK (CD235a− CD41a+). Transgene expression patterns (G and/or F and/or T) are shown as mean% ± SEM (n = 3).
Figure 6
Figure 6
Pattern of Transgene Expressions during Differentiation in EPO and TPO Three additional cell lines are presented here, additional to the one presented in Figure 4. FFDK and QOLG are iPSC lines, MS10 is an ESC line. The cells were forward programmed with the rainbow vectors and split at day 2 into EPO or TPO cultures. (A) Representative depiction of the dynamic evolution of transgene expression patterns in viable cells from the hPSC stage (day −1) to day 20 post-transduction in EPO (left) and TPO (right) conditions. Cells were gated according to expression of G(ATA1), F(LI1), and T(AL1). (B) FoP cell surface marker expression and transgene expression were analyzed by flow cytometry at day 2 (left panel), day 9 (middle panel), and day 20 (right panel) post-transduction (EPO cultures in the top line and TPO cultures in the bottom line). Cells have been divided according to expression of differentiation markers (CD235a and CD41a) into BPP (CD41a+ CD235a+), ERY (CD235a+ CD41a−), and MK (CD235a− CD41a+). Transgene expression patterns (G and/or F and/or T) are shown in the pie charts.
Figure 7
Figure 7
Changes in FLI1 Transgene Expression Dictates Forward Programming Outcome Day 9 CD41+ CD235a+ BPPs were sorted by flow cytometry into GATA1+/FLI1+/TAL1+ (GFT) and GATA1+/FLI1−/TAL1+ (GT) populations. (A) FLI1 transgene and endogenous expression was measured by qRT-PCR on sorted populations and normalized to the GFT population; GFT (green bars), GT (blue bars), and untransduced (gray bars). (B) The clonogenic potential of the GFT and GT-sorted BPPs cells was tested by CFU assay. The pie charts show colony distribution from both populations after 14 days (n = 2, mean%); erythroid colonies (ERY, red), megakaryocyte-erythrocyte mixed colonies (MIXED, gray), and megakaryocyte colonies (blue). Poisson regression analysis shows that the distribution of the number of colonies per cell type depends strongly on the set of expressed TFs (∗∗∗p < 2.2 × 10−16). (C) Detection of integrated FLI1 provirus by qPCR in the genomic DNA of day 9 GFT and GT-sorted BPPs; UT, untransduced cells (n = 2, mean% normalized to GFT cells). (D) Forward programming was performed using 3TFs (GATA1, FLI1, and TAL1) or 2TFs (GATA1 and TAL1) in EPO culture conditions. Cells were monitored by flow cytometry at days 9 and 20 post-transduction to determine viable cell numbers (left) and the CD41a/CD235a cell phenotype (right) (n = 5, mean% ± SEM). Cell numbers were significantly decreased with 2TFs as well the overall proportion of BPPs generated at days 9 and 20.

References

    1. Ali A., Auvinen M.K., Rautonen J. The aging population poses a global challenge for blood services. Transfusion. 2010;50:584–588. - PubMed
    1. Debili N., Coulombel L., Croisille L., Katz A., Guichard J., Breton-Gorius J., Vainchenker W. Characterization of a bipotent erythro-megakaryocytic progenitor in human bone marrow. Blood. 1996;88:1284–1296. - PubMed
    1. Dore L.C., Crispino J.D. Transcription factor networks in erythroid cell and megakaryocyte development. Blood. 2011;118:231–239. - PMC - PubMed
    1. Griffiths R.E., Kupzig S., Cogan N., Mankelow T.J., Betin V.M., Trakarnsanga K., Massey E.J., Lane J.D., Parsons S.F., Anstee D.J. Maturing reticulocytes internalize plasma membrane in glycophorin A-containing vesicles that fuse with autophagosomes before exocytosis. Blood. 2012;119:6296–6306. - PMC - PubMed
    1. Han G.C., Vinayachandran V., Bataille A.R., Park B., Chan-Salis K.Y., Keller C.A., Long M., Mahony S., Hardison R.C., Pugh B.F. Genome-wide organization of GATA1 and TAL1 determined at high resolution. Mol. Cell. Biol. 2016;36:157–172. - PMC - PubMed

Publication types

MeSH terms