Comparative Study
. 2018 Dec:242:59-66.
doi: 10.1016/j.tvjl.2018.10.008. Epub 2018 Oct 30.

Comparison of ultrasonic pachymetry and Fourier-domain optical coherence tomography for measurement of corneal thickness in dogs with and without corneal disease

Affiliations
Comparative Study

Comparison of ultrasonic pachymetry and Fourier-domain optical coherence tomography for measurement of corneal thickness in dogs with and without corneal disease

A L Hoehn et al. Vet J. 2018 Dec.

Erratum in

Abstract

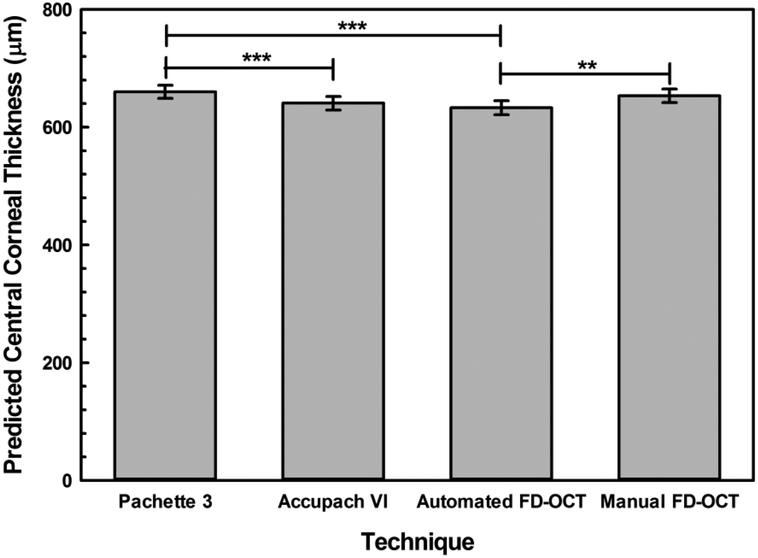
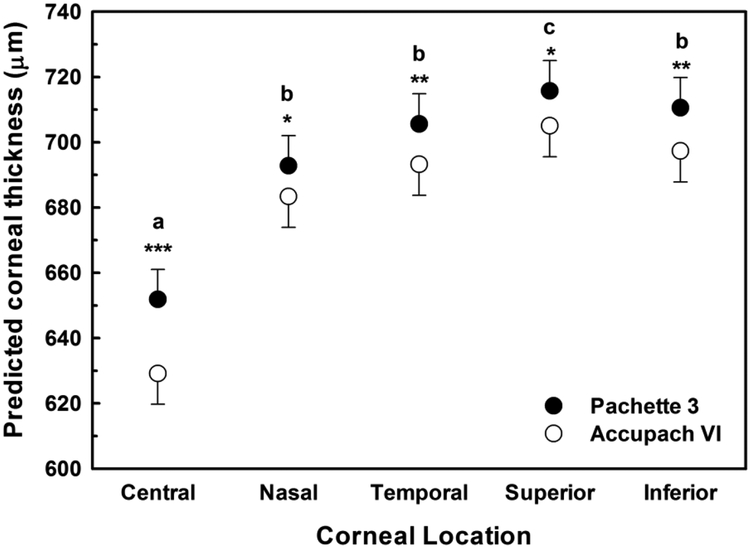
Several ultrasonic and Fourier-domain optical coherence tomography (FD-OCT) pachymeters are used to measure corneal thickness in canine patients and research subjects. This study assessed the reliability of and consistency between two ultrasonic pachymetry (USP) devices, Pachette 3 and Accupach VI, as well as automated and manual measurements obtained using FD-OCT in dogs with and without corneal disease. Corneal thickness measurements were compiled from 108 dogs and analyzed using mixed effects linear regression, with Bonferonni adjustments for post-hoc comparisons, to determine the effects of age, weight and disease state. Data are presented as predicted mean±standard error. Canine corneal disease can result in marked increases in thickness that frequently exceed the upper limits of measurement of some pachymetry devices developed for human use. In this study, the corneas of dogs with endothelial disease or injury frequently exceeded the upper limits of quantitation of 999 and 800μm for the Accupach VI and automated FD-OCT pachymeters, respectively. Using values <800μm, the Pachette 3 generated significantly greater values for central corneal thickness (CCT) than the Accupach VI, manual FD-OCT and automated FD-OCT at 625±7.0, 615±7.2, 613±7.2, and 606±7.4μm respectively (P<0.001). Of the two devices where measurements >1000μm were obtained, manual FD-OCT demonstrated less variability than the Pachette 3. Corneal thickness increased linearly with age and weight with an increase of 6.9±1.8μm/year and 1.6±0.8μm/kg body weight (P<0.005 and P=0.038, respectively).

Keywords: Canine; Corneal endothelial dystrophy; Corneal thickness; Optical coherence tomography; Ultrasonic pachymetry.


Conflict of interest statement

Conflict of interest statement

None of the authors has any financial or personal relationships that could inappropriately influence or bias the content of the paper.

Figures

Fig. 1.
Fig. 1.
Central corneal thickness is automatically generated (A) and measured manually (B) using Fourier-domain optical coherence tomography (FD-OCT) images. Images were obtained from an 11-year-old castrated male Boston terrier with a clear cornea and no ophthalmic abnormalities. The automated measurement generated by the pachymetry software was 559 μm and the value obtained manually using the RTVue measurement tool was 545 μm.
Fig. 2.
Fig. 2.
Predicted mean ± standard error (SE) central corneal thickness (CTT) for four measurement techniques including all data from 108 dogs with or without corneal disease (A). The CTT values from Pachette 3 were significantly greater than those from Accupach VI (P < 0.001) and automated Fourier-domain optical coherence tomography (FD-OCT) measurements (P = 0.001). Values from the manual FD-OCT measurements were significantly greater than those from Accupach VI (P = 0.032). All other techniques were not significantly different from one another. Predicted mean CCT ± SE for four measurement techniques excluding data >999 μm from 98 dogs with or without corneal disease (B). The CCT values from Pachette 3 were significantly greater than Accupach VI (P < 0.001) and automated FD-OCT measurements (P < 0.001). The manual FD-OCT measurements were significantly higher than automated measurements (P = 0.005). All other techniques were not significantly different from one another. Predicted mean CCT ± SE for four measurement techniques excluding data >800 μm from 91 dogs with or without corneal disease (C). The CCT values from Pachette 3 were significantly higher than those from all other techniques (P < 0.001). All other techniques were not significantly different from each other. All P values were determined by a mixed effects linear regression model. *P < 0.05. **P < 0.01, ***P < 0.001.
Fig. 2.
Fig. 2.
Predicted mean ± standard error (SE) central corneal thickness (CTT) for four measurement techniques including all data from 108 dogs with or without corneal disease (A). The CTT values from Pachette 3 were significantly greater than those from Accupach VI (P < 0.001) and automated Fourier-domain optical coherence tomography (FD-OCT) measurements (P = 0.001). Values from the manual FD-OCT measurements were significantly greater than those from Accupach VI (P = 0.032). All other techniques were not significantly different from one another. Predicted mean CCT ± SE for four measurement techniques excluding data >999 μm from 98 dogs with or without corneal disease (B). The CCT values from Pachette 3 were significantly greater than Accupach VI (P < 0.001) and automated FD-OCT measurements (P < 0.001). The manual FD-OCT measurements were significantly higher than automated measurements (P = 0.005). All other techniques were not significantly different from one another. Predicted mean CCT ± SE for four measurement techniques excluding data >800 μm from 91 dogs with or without corneal disease (C). The CCT values from Pachette 3 were significantly higher than those from all other techniques (P < 0.001). All other techniques were not significantly different from each other. All P values were determined by a mixed effects linear regression model. *P < 0.05. **P < 0.01, ***P < 0.001.
Fig. 3.
Fig. 3.
Predicted mean ± standard error corneal thickness at five different locations as measured by ultrasonic pachymetry (USP) devices, Pachette 3 and Accupach VI excluding data >999 μm in 99 dogs with or without corneal disease. At all locations, Pachette 3 generated significantly greater corneal thickness measurements than the Accupach VI (P < 0.05). In normal dogs, central corneal thickness (CTT) was significantly less than the other four regions for both USP devices; superior perilimbal corneal thickness was significantly greater than inferior, nasal and temporal perilimbal thickness and CCT (P < 0.05). The P values were determined by mixed effects linear regression with a Bonferroni test for post-hoc analysis. *P < 0.05, **P < 0.01, ***P < 0.001 for technique. a,b,c P < 0.05 for location.
Fig. 4.
Fig. 4.
Bland-Altman plots displaying corneal thickness measurement differences between automated Fourier-domain optical coherence tomography (FD-OCT) and Accupach (A), manual FD-OCT and Accupach (B), automated FD-OCT and Pachette (C), manual FD-OCT and Pachette (D), automated and manual FD-OCT (E) and Pachette and Accupach (F) in 108 dogs with and without corneal disease. The vertical axis represents the difference between the two techniques, and the horizontal axis plots the mean value for the two techniques. The mean of the differences is represented as the solid horizontal line intersecting the vertical axis and should be close to zero. The dashed lines represent the 95% limits of agreement.
Fig. 5.
Fig. 5.
Predicted mean ± standard error corneal thickness from 108 dogs with or without corneal disease and/or treatment administration. Dogs affected with corneal endothelial degeneration (CED) with or without treatment with a superficial keratectomy and conjunctival advancement hood flap (SKCAHF) had significantly thicker corneas in comparison to normal dogs (PCED <0.001, PSKCAHF < 0.010). Similarly, Beagles treated with transcorneal freezing + phosphate buffer solution (TF + PBS) or TF + rho kinase inhibitor (RKI) also had significantly thicker corneas than normal dogs (P < 0.001). Beagles treated with 5% NaCl had significantly thinner corneas, while Beagles treated with artificial tears (AT) had significantly thicker corneas than normal dogs (P < 0.001). Predicted corneal thickness did not significantly differ between keratoconjunctivitis sicca (KCS)-affected and normal dogs (P = 0.615). **P < 0.01, ***P < 0.001.

Similar articles

Cited by

References

    1. Alario A, Pirie C, 2013a. Central corneal thickness measurements in normal dogs: a comparison between ultrasound pachymetry and optical coherence tomography. Veterinary Ophthalmology 17, 207–211. - PubMed
    1. Alario A, Pirie C, 2014. Reliability of manual measurements of corneal thickness obtained from healthy canine eyes using spectral-domain optical coherence tomography (SD-OCT). The Canadian Journal of Veterinary Research 78, 221–225. - PMC - PubMed
    1. Alario AF, Pirie CG, 2013b. A spectral-domain optical coherence tomography device provides reliable corneal pachymetry measurements in canine eyes. The Veterinary Record 172, 605. - PubMed
    1. Amano S, Honda N, Amano Y, Yamagami S, Miyai T, Samejima T, Ogata M, Miyata K, 2006. Comparison of central corneal thickness measurements by rotating Scheimpflug camera, ultrasonic pachymetry, and scanning-slit corneal topography. Ophthalmology 113, 937–941. - PubMed
    1. Befanis P, JR RP, Brown D, 1981. Endothelial repair of the canine cornea. American Journal of Veterinary Research 42, 590–595. - PubMed

Publication types