. 2019 Jan 3;73(1):107-118.e4.
doi: 10.1016/j.molcel.2018.10.031. Epub 2018 Nov 29.

Widespread Backtracking by RNA Pol II Is a Major Effector of Gene Activation, 5' Pause Release, Termination, and Transcription Elongation Rate

Affiliations

Widespread Backtracking by RNA Pol II Is a Major Effector of Gene Activation, 5' Pause Release, Termination, and Transcription Elongation Rate

Ryan M Sheridan et al. Mol Cell. .

Abstract

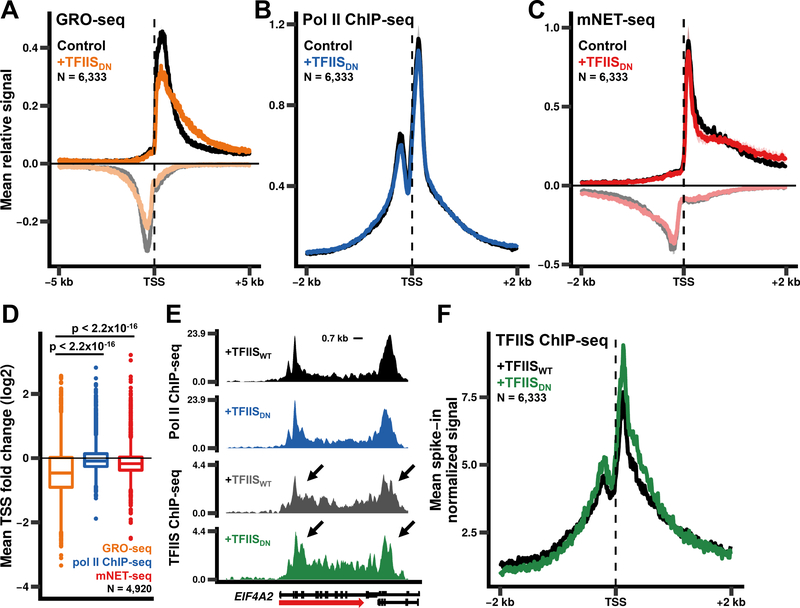
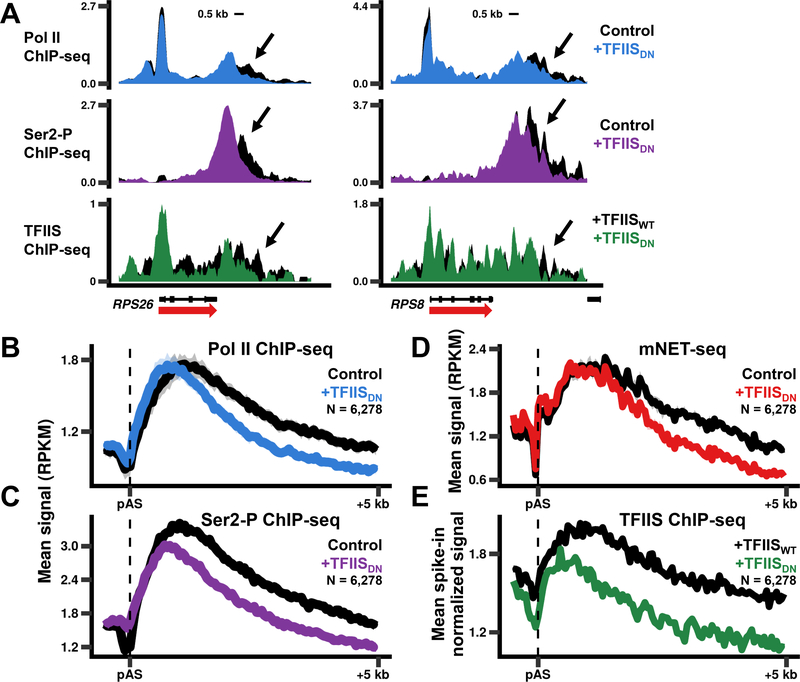
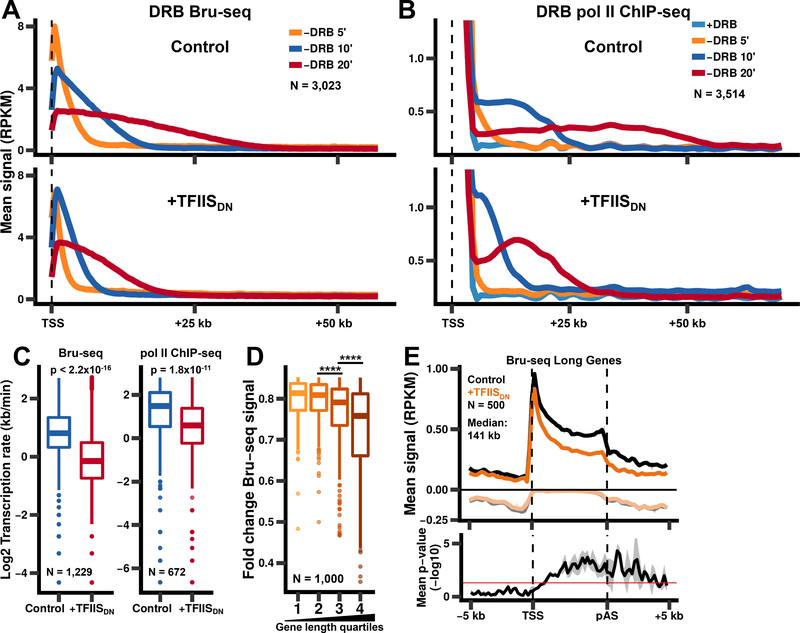
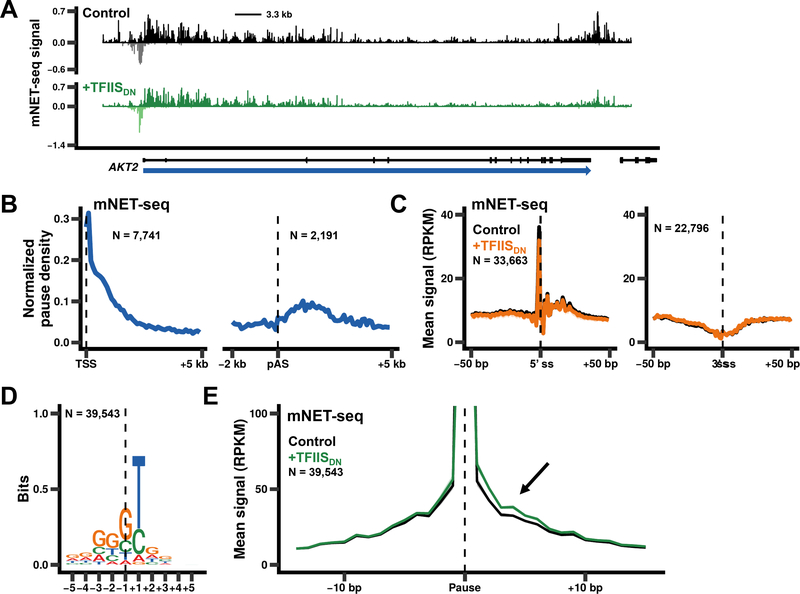
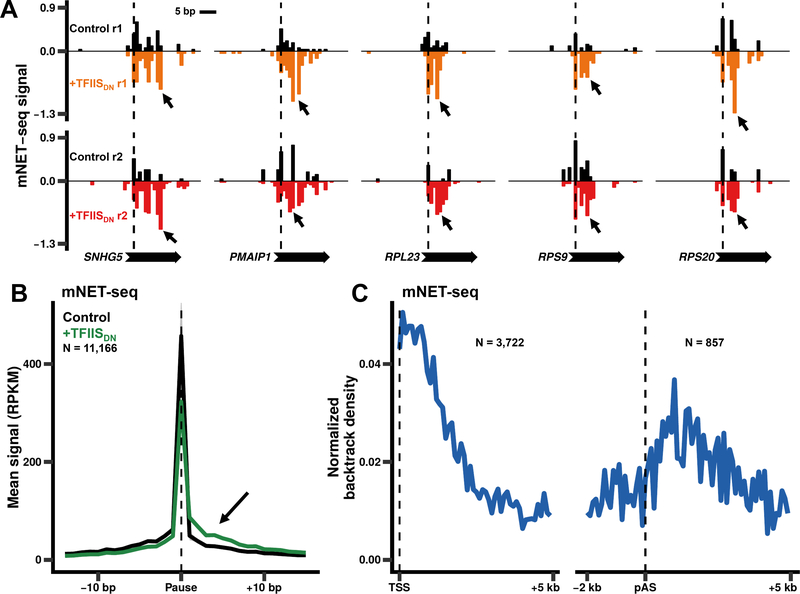
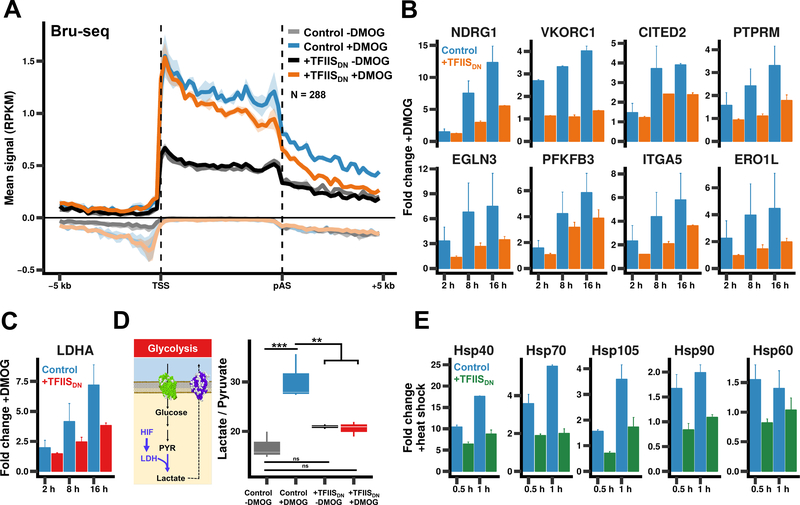
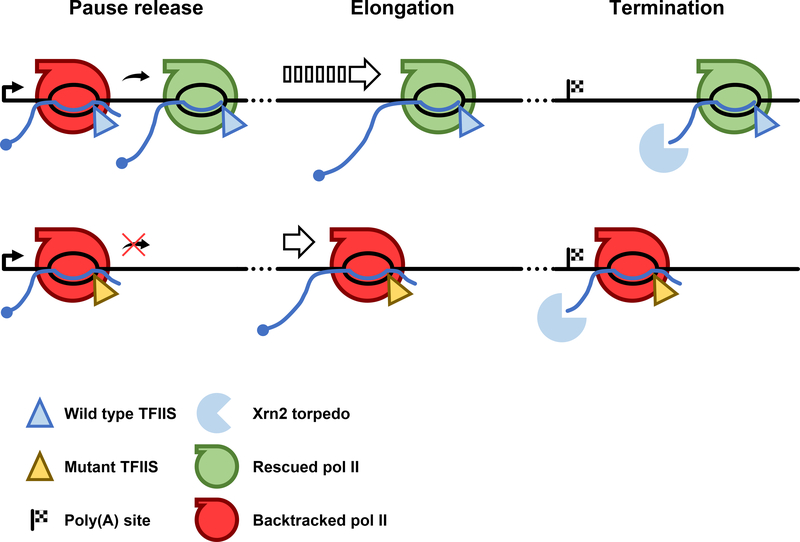
In addition to phosphodiester bond formation, RNA polymerase II has an RNA endonuclease activity, stimulated by TFIIS, which rescues complexes that have arrested and backtracked. How TFIIS affects transcription under normal conditions is poorly understood. We identified backtracking sites in human cells using a dominant-negative TFIIS (TFIISDN) that inhibits RNA cleavage and stabilizes backtracked complexes. Backtracking is most frequent within 2 kb of start sites, consistent with slow elongation early in transcription, and in 3' flanking regions where termination is enhanced by TFIISDN, suggesting that backtracked pol II is a favorable substrate for termination. Rescue from backtracking by RNA cleavage also promotes escape from 5' pause sites, prevents premature termination of long transcripts, and enhances activation of stress-inducible genes. TFIISDN slowed elongation rates genome-wide by half, suggesting that rescue of backtracked pol II by TFIIS is a major stimulus of elongation under normal conditions.

Keywords: RNA polymerase pausing; TFIIS; hypoxia response; transcription elongation; transcription termination; transcriptional backtracking.


Conflict of interest statement

Declaration of interests

Authors declare no competing interests.

Figures

Figure 1.
Figure 1.. Pol II RNA cleavage activity promotes escape from 5’ pause sites
(A)Expression of TFIISDN results in genome-wide loss of GRO-seq signal from promoter proximal regions. Metaplots of relative GRO-seq signals (10 bp bins) for genes >5 kb long and separated by >2 kb. The relative signal for each gene was calculated by dividing the signal in each bin by the total signal within the region plotted. The mean relative signal was calculated for each individual replicate. The mean relative signal was then averaged for the replicates with the shaded region representing the standard error of the means (SEM) for two biological replicates. Negative values correspond to anti-sense signal. (B)Metaplots of relative anti-pol II ChIP-seq signals as in A. The mean and SEM for three biological replicates is shown. (C)Metaplots of relative anti-pol II mNET-seq signals as in A. The mean and SEM for two biological replicates is shown. (D)Fold change in GRO-seq, pol II ChIP-seq, and mNET-seq signals for the region from the TSS to +300 bp. The average fold change for two (GRO-seq, mNET-seq) or three (pol II ChIPseq) biological replicates is shown for genes >1 kb long and separated by >2 kb. p-values were calculated using the Welch two sample t-test with Bonferroni-Holm correction. (E)TFIIS localizes to 5’ and 3’ ends of genes. Avi-TFIISWT and Avi-TFIISDN ChIP-seq signals for EIF4A2 normalized to a yeast spike-in (see Methods). (F)WT TFIIS and TFIISDN associate with pol II at similar levels. Metaplots of Avi-TFIIS ChIPseq signals (10 bp bins) as in E.
Figure 2.
Figure 2.. Pol II cleavage activity antagonizes termination at 3’ ends of genes
(A)Expression of TFIISDN causes early transcription termination. Note the early drop in Pol II, Ser2-P, and TFIIS ChIP signals at gene 3’ ends when TFIISDN is expressed. (B)Metaplots of anti-pol II ChIP-seq signals near poly(A) sites (pAS) (50 bp bins) for genes >1 kb long and separated by >5 kb. The mean signal was calculated for each individual replicate. The replicates were then averaged with the shaded region representing the SEM for three replicates. RPKM, reads per kb per million mapped reads. (C) Metaplots of anti-CTD Ser2-P pol II signals as in B for one replicate. (D)Metaplots of mNET-seq signals as in B for two replicates. (E) Metaplots of WT TFIIS and TFIISDN ChIP-seq signals (50 bp bins) normalized to a yeast spike-in as in Fig. 1F for genes shown in B.
Figure 3.
Figure 3.. Pol II cleavage activity is required for rapid elongation through the gene body
(A) Inhibition of pol II cleavage activity reduces the rate of transcription elongation. Metaplots of Bru-seq signals (500 bp bins) after washout of DRB for non-overlapping genes >75 kb long. (B) Metaplots of pol II ChIP-seq signals after washout of DRB as in A. (C)Transcription rates were calculated using Bru-seq data shown in A (left) or pol II ChIP-seq data shown in B (right) by comparing the 10 min and 20 min timepoints for genes where waves were detected for both timepoints. p-values were calculated using the Welch two sample t-test. (D)Transcription of long genes is more sensitive to inhibition of pol II RNA cleavage activity. The fold change in Bru-seq signal was plotted for the top 1,000 genes that show reduced Bru-seq signal after expression of TFIISDN, divided into quartiles based on gene length. Fold changes were calculated from two biological replicates for genes >1 kb long and separated by >2 kb. pvalues were calculated using the Welch two sample t-test with Bonferroni-Holm correction. **** p < 0.0001. (E)Metaplots of Bru-seq signals for genes from the 3rd and 4th quartiles from E (N = 500, median length: 141 kb). The mean signal and SEM was plotted as in Fig. 2A for two biological replicates. Negative values correspond to anti-sense signal. p-values (bottom panel) were calculated by comparing the sense Bru-seq signals for uninduced and TFIISDN-expressing cells for each replicate using the Welch two sample t-test. p-values were then averaged across the two biological replicates with the shaded region representing the SEM.
Figure 4.
Figure 4.. Pol II pausing is most frequent near the 5’ ends and termination zones.
(A) mNET-seq signals are shown for AKT2. Note the high frequency of pauses that occur close to the 5’ end and downstream of the poly(A) site. Negative values correspond to anti-sense signal. (B) Metaplots (100 bp bins) of pause density (pauses / bp) normalized to total mNET-seq signal. Pauses were identified as positions where there were >5 mapped reads and NET-seq signal rose three standard deviations above the mean for the surrounding 200 bp. Pauses shared between two control datasets (179,605 pauses) were used to calculate the pause density for the region downstream of the TSS for non-overlapping genes >5 kb long (left panel, N = 7,741 genes) and for the region around the poly(A) site (pAS) for genes >2 kb long and separated by >5 kb (right panel, N = 2,191 genes). (C) Pausing is not enriched at splice sites. Metaplots of mNET-seq signals around 5’ and 3’ splice sites (ss, 1 bp bins) for sites contained within non-overlapping genes >1 kb long. The peak at the 5’ss corresponds to step 1 intermediates associated with pol II. The mean signal and SEM was plotted for two biological replicates as in Fig. 2A. (D) The consensus sequence observed for pause sites present in both control datasets, separated by >30 bp, and containing signal within 15 bp of the pause (N = 39,543/179,605 pauses). Dotted line marks the 3’ end of nascent transcripts. (E) Expression of TFIISDN causes an extension of nascent RNA 3’ ends associated with pause sites. Metaplots of mNET-seq signals (1 bp bins) around pause sites shown in D. The mean signal and SEM was plotted for two biological replicates as in Fig. 2A. Note the downstream shift in mNET-seq signal after inhibition of pol II cleavage activity.
Figure 5.
Figure 5.. Pol II backtracking occurs throughout the transcription cycle
(A) Examples of pauses identified as high confidence backtracking sites in two biological replicates (r1, r2). The dotted line indicates the position of the pause site identified in the control datasets. Note the increase in RNA 3’ ends downstream of the pauses after expression of TFIISDN. Values represent reads per million mapped reads. (B) Metaplots of mNET-seq signals (1 bp bins) around pauses identified as high confidence backtracking sites (N = 11,166/39,543 pauses). The mean signal and SEM was plotted for two biological replicates as in Fig. 2A. (C) Backtracking is most frequent near 5’ ends and downstream of poly(A) sites. Metaplots (100 bp bins) of backtrack density (sites / bp) normalized to total mNET-seq signal as in Fig. 4B. High confidence backtrack sites shown in B (11,166/39,543 pauses) were used to calculate the density for the regions downstream of the TSS (left panel, N = 3,722 genes) and around the poly(A) site (right panel, N = 857 genes).
Figure 6.
Figure 6.. Pol II cleavage activity is required to rapidly activate gene expression
(A) TFIISDN impairs transcriptional activation of hypoxia inducible genes in response to DMOG. Metaplots of pulse-labelled nascent RNA-seq (Bru-seq) signals for cells treated +/−2 mM DMOG for 16 hours. Data were plotted for genes with increased signal +DMOG (p-value < 0.01). The mean signal and SEM was plotted for two biological replicates as in Fig. 2A. Negative values correspond to anti-sense signal. (B) qRT-PCR showing the fold change in mRNA abundance for hypoxia-responsive transcripts in cells treated with 2 mM DMOG for indicated times. Error bars represent the SEM for at least two biological replicates. (C) Lactate/pyruvate ratios were determined by UHPLC-MS in uninduced and TFIISDNexpressing cells +/−2 mM DMOG for 16 hrs. ** p < 0.01, *** p < 0.001 ANOVA. (D) qRT-PCR showing the fold change in LDHA mRNA as in B. (E) qRT-PCR showing the fold change in heat shock mRNA after incubation at 42° as in B.
Figure 7.
Figure 7.. Expression of TFIISDN causes widespread effects throughout the transcription cycle
Model showing the effect TFIISDN expression has on the release of promoter proximally paused pol II, elongation through the gene, and transcription termination.

Similar articles

Cited by

References

    1. Adelman K, Marr MT, Werner J, Saunders A, Ni Z, Andrulis ED, and Lis JT (2005). Efficient release from promoter-proximal stall sites requires transcript cleavage factor TFIIS. Mol Cell 17, 103112. - PubMed
    1. Anamika K, Gyenis À, Poidevin L, Poch O, and Tora L (2012). RNA polymerase II pausing downstream of core histone genes is different from genes producing polyadenylated transcripts. PLoS ONE 7, e38769. - PMC - PubMed
    1. Bentley DL (2014). Coupling mRNA processing with transcription in time and space. Nat Rev Genet 15, 163–175. - PMC - PubMed
    1. Bondarenko VA, Steele LM, Ujvari A, Gaykalova DA, Kulaeva OI, Polikanov YS, Luse DS, and Studitsky VM (2006). Nucleosomes can form a polar barrier to transcript elongation by RNA polymerase II. Mol Cell 24, 469–479. - PubMed
    1. Bourgeois C, Kim Y, Churcher M, West M, and Karn J (2002). Spt5 cooperates with Human Immunodeficiency virus Type 1 Tat by Preventing Premature Release at Terminator Sequences. Mol. Cell. Biol 22, 1079–1093. - PMC - PubMed

Publication types