. 2019 Feb:20:194-204.
doi: 10.1016/j.molmet.2018.11.004. Epub 2018 Nov 20.

Hypothalamic POMC or MC4R deficiency impairs counterregulatory responses to hypoglycemia in mice

Affiliations

Hypothalamic POMC or MC4R deficiency impairs counterregulatory responses to hypoglycemia in mice

Benjamin P Tooke et al. Mol Metab. 2019 Feb.

Abstract

Objective: Life-threatening hypoglycemia is a major limiting factor in the management of diabetes. While it is known that counterregulatory responses to hypoglycemia are impaired in diabetes, molecular mechanisms underlying the reduced responses remain unclear. Given the established roles of the hypothalamic proopiomelanocortin (POMC)/melanocortin 4 receptor (MC4R) circuit in regulating sympathetic nervous system (SNS) activity and the SNS in stimulating counterregulatory responses to hypoglycemia, we hypothesized that hypothalamic POMC as well as MC4R, a receptor for POMC derived melanocyte stimulating hormones, is required for normal hypoglycemia counterregulation.

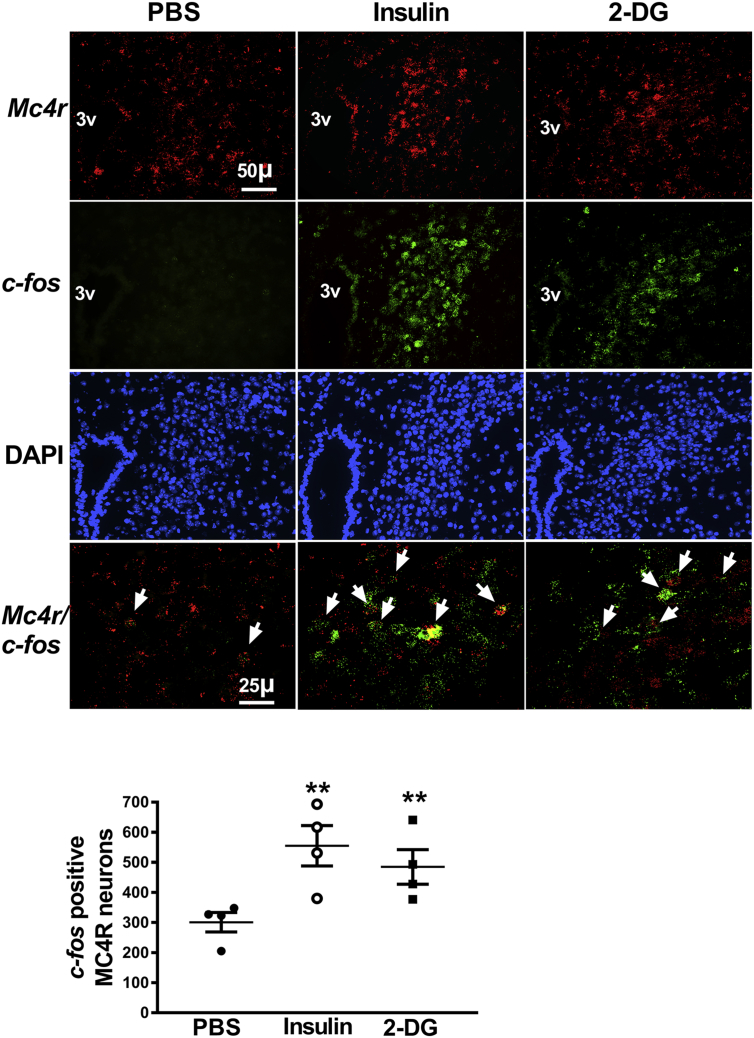
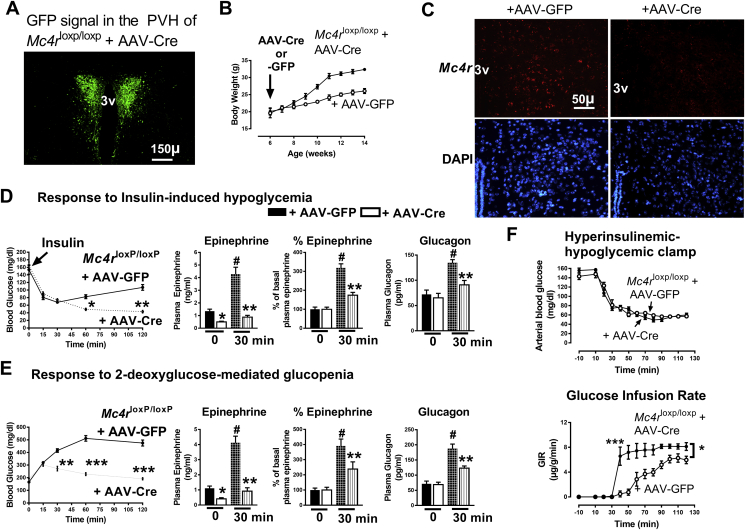
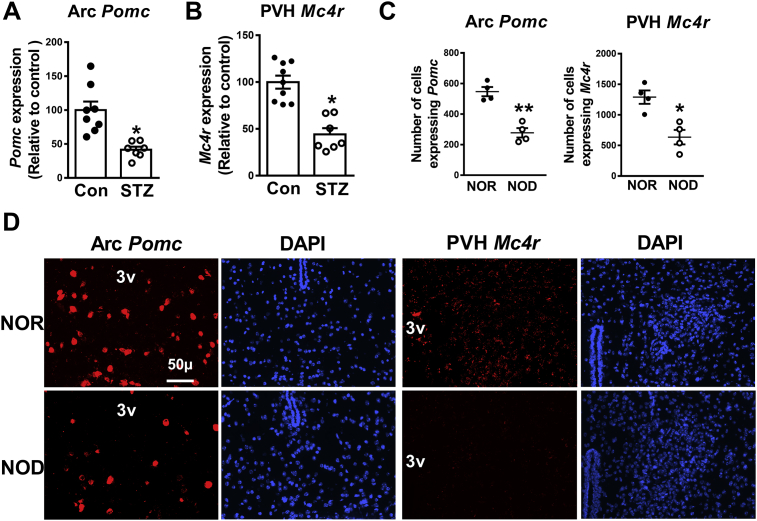
Methods: To test the hypothesis, we induced hypoglycemia or glucopenia in separate cohorts of mice deficient in either POMC or MC4R in the arcuate nucleus (ARC) or the paraventricular nucleus of the hypothalamus (PVH), respectively, and measured their circulating counterregulatory hormones. In addition, we performed a hyperinsulinemic-hypoglycemic clamp study to further validate the function of MC4R in hypoglycemia counterregulation. We also measured Pomc and Mc4r mRNA levels in the ARC and PVH, respectively, in the streptozotocin-induced type 1 diabetes mouse model and non-obese diabetic (NOD) mice to delineate molecular mechanisms by which diabetes deteriorates the defense systems against hypoglycemia. Finally, we treated diabetic mice with the MC4R agonist MTII, administered stereotaxically into the PVH, to determine its potential for restoring the counterregulatory response to hypoglycemia in diabetes.

Results: Stimulation of epinephrine and glucagon release in response to hypoglycemia or glucopenia was diminished in both POMC- and MC4R-deficient mice, relative to their littermate controls. Similarly, the counterregulatory response was impaired in association with decreased hypothalamic Pomc and Mc4r expression in the diabetic mice, a phenotype that was not reversed by insulin treatment which normalized glycemia. In contrast, infusion of an MC4R agonist in the PVH restored the counterregulatory response in diabetic mice.

Conclusion: In conclusion, hypothalamic Pomc as well as Mc4r, both of which are reduced in type 1 diabetic mice, are required for normal counterregulatory responses to hypoglycemia. Therefore, enhancing MC4R function may improve hypoglycemia counterregulation in diabetes.

Keywords: Diabetes; Hypoglycemia counterregulation; Hypothalamus; Melanocortin 4 receptor (MC4R); Pro-opiomelanocortin (POMC).


Figures

Image 1
Graphical abstract
Figure 1
Figure 1
Activation of POMC neurons in the arcuate nucleus by hypoglycemia or glucopenia in 8-week old male WT mice. Representative images of fluorescence in situ hybridization following insulin-induced hypoglycemia or 2-deoxyglucose (2-DG) mediated glucopenia. Higher number of c-fos positive POMC neurons in the arcuate nucleus 30 min after insulin (2 U/kg, ip) or 2-DG (200 mg/kg, ip) treatment compared to PBS administration. Arrowheads point to colocalization of Pomc (red) and c-fos (green) imaged using a 40× objective lens. POMC neuron profiles overlapping with at least 3 green dots (representing c-fos) per neuron were included in the analysis for counting the number of c-fos positive POMC neurons. All other images were captured under a 20× objective lens. Quantification of fluorescence signal was performed using CellProfiler. **P < 0.01 for insulin or 2-DG vs PBS (n = 4, 4 sections per mouse and 4 areas of interest per section were analyzed), 1-way ANOVA followed by Tukey's multiple comparisons test. Error bars reflect mean ± SEM.
Figure 2
Figure 2
Activation of MC4R neurons in the paraventricular nucleus of the hypothalamus by hypoglycemia or glucopenia in 8-week old male WT mice. Representative images of fluorescence in situ hybridization following insulin-induced hypoglycemia or 2-deoxyglucose (2-DG) mediated glucopenia. Increase in number of c-fos positive MC4R neurons in the paraventricular nucleus 30 min after insulin (2 U/kg, ip) or 2-DG (200 mg/kg, ip) treatment compared to PBS administration. Arrowheads point to colocalization of Mc4r (red) and c-fos (green) imaged using a 40× objective lens. MC4R neuron profiles overlapping with at least 3 green dots (representing c-fos) per neuron were included in the analysis for counting the number of c-fos positive MC4R neurons. All other images were captured with a 20× objective lens. Quantification of fluorescence signal was performed using CellProfiler. **P < 0.01 for insulin or 2-DG vs PBS (n = 4, 4 sections per mouse and 4 areas of interest per section were analyzed), 1-way ANOVA followed by Tukey's multiple comparisons test. Error bars reflect mean ± SEM.
Figure 3
Figure 3
Pomc in the arcuate nucleus is essential to counteract hypoglycemia or glucopenia. A) Restoration of baseline glycemia is impaired together with reduced stimulation of release of epinephrine (absolute values and % change) and glucagon in ArcPomc−/− mice following insulin-induced hypoglycemia; B) Diminished response to glucose deficit, impaired stimulation of release of epinephrine (absolute values and % change) and glucagon in ArcPomc−/− mice following 2-deoxyglucose (2-DG) mediated glucopenia. 2-way RMANOVA followed by Tukey's multiple comparison test was used for comparisons. For the blood glucose levels, *P < 0.05, **P < 0.01 vs WT; for the epinephrine and glucagon values, *P < 0.05 vs WT at 0 min, **P < 0.01 vs WT at 30 min, #P < 0.01 vs both the groups at 0 min and ArcPomc−/− at 30 min, n = 6–8. Error bars are mean ± SEM.
Figure 4
Figure 4
Mc4r in the paraventricular nucleus is required to counteract glucose deficit. A) Representative image of GFP signal confined to the paraventricular nucleus of the hypothalamus (PVH), validating the accuracy of AAV-Cre-GFP injections in Mc4rloxP/loxP mice; B) Increased body weight in Mc4rloxP/loxP + AAV-Cre mice; C) Representative images of fluorescence in situ hybridization showing decreased Mc4r levels in Mc4rloxP/loxP + AAV-Cre mice.; D) Restoration of baseline glycemia is impaired together with reduced stimulation of release of epinephrine (absolute values and % change) and glucagon in 9-week old Mc4rloxP/loxP mice injected with AAV-Cre (generating PVH-specific Mc4r deficiency) following insulin-induced hypoglycemia; E) Diminished response to glucose deficit, impaired stimulation of release of epinephrine (absolute values and % change), and glucagon in 9-week old Mc4rloxP/loxP mice injected with AAV-Cre (generating PVH-specific Mc4r deficiency) following 2-deoxyglucose (2-DG) mediated glucopenia; F) Glucose infusion rate (GIR) in 12-week old male Mc4rloxP/loxP + AAV-Cre and Mc4rloxP/loxP + AAV-GFP mice during hyperinsulinemic-hypoglycemic clamps, glucose clamped at hypoglycemic level using 20 mU/kg/min insulin. 2-way RMANOVA followed by Tukey's multiple comparison test was used for comparisons. For the blood glucose levels, *P < 0.05, **P < 0.01, ***P < 0.001 vs Mc4rloxP/loxP + AAV-GFP; for the epinephrine and glucagon values, *P < 0.05 vs Mc4rloxP/loxP + AAV-GFP at 0 min, **P < 0.01 vs Mc4rloxP/loxP + AAV-GFP at 30 min, #P < 0.01 vs both the groups at 0 min and Mc4rloxP/loxP + AAV-Cre at 30 min; for the GIR, *P < 0.05, ***P < 0.001 vs Mc4rloxP/loxP + AAV-GFP, n = 6–8. Error bars are mean ± SEM.
Figure 5
Figure 5
Reduced expression of hypothalamic Pomc and Mc4r in type 1 diabetes mouse models. A) Data from qRT-PCR showing decreased Pomc mRNA levels in the arcuate nucleus (Arc) in streptozotocin (STZ) induced diabetes mouse model and control (con) group (12-week old mice); B) Data from qRT-PCR showing reduced Mc4r in the paraventricular nucleus (PVH) in STZ induced diabetes mouse model and control group (12-week old mice); C) Quantification of fluorescence in situ hybridization signal for Pomc and Mc4r in 30-week old female NOR (non-obese diabetes resistant) and NOD (non-obese diabetic) mice for the representative images shown in D (n = 4, 4 sections per mouse and 4 areas of interest per section were analyzed). 2-tailed Student's t-test was used for comparisons. *P < 0.05, **P < 0.01 vs control or NOR group. Error bars are mean ± SEM. control, mice injected with Na-Citrate Buffer.
Figure 6
Figure 6
Hypoglycemia counterregulatory response and effects of chronic insulin or MC4R agonist infusion in the streptozotocin (STZ) induced diabetes mouse model. A) Restoration of baseline glycemia is impaired in 12-week old STZ treated mice following insulin-induced hypoglycemia (STZ mice were pretreated with 10 U/kg insulin, ip, 1-h prior to this experiment to match their baseline glycemia with control group), *P < 0.05, **P < 0.01 vs control; B) Reduced stimulation of epinephrine and glucagon release in the STZ treated mice following insulin-induced hypoglycemia, *P < 0.05 vs control at 30 min for epinephrine and at 0 min for glucagon, #P < 0.05 vs control at 0 min; C) Restoration of normoglycemia in diabetic mice by insulin treatment (10 U/kg/day, 14 days), ***P < 0.001 vs vehicle, ###P < 0.001 vs STZ + Insulin, n = 6; D) Insulin (INS) treatment did not normalize either Pomc or Mc4r mRNA levels in diabetic mice, *P < 0.05, **P < 0.01 vs control, n = 5; E) Insulin treatment did not enhance the release of counterregulatory hormones in diabetic mice, **P < 0.01 vs control at 30 min for epinephrine and at 0 min for glucagon, ##P < 0.01 vs control at 0 min, n = 6; F) Melanotan (MT) II (1 nmol/day, PVH) improves counterregulatory response to hypoglycemia in diabetes induced by STZ (the mice were pretreated with 10 U/kg insulin, ip, 1-h prior to this experiment to normalize their baseline glycemia), **P < 0.01 vs STZ, n = 6; G) MT II increased the release of counterregulatory hormones in the diabetic mice,**P < 0.01 vs STZ. 1-way ANOVA or 2-way RMANOVA followed by Tukey's multiple comparison test were used for comparisons as appropriate. Error bars are mean ± SEM. Vehicle or control, Na-Citrate Buffer.

References

    1. Salvo F., Moore N., Arnaud M., Robinson P., Raschi E., De Ponti F. Addition of dipeptidyl peptidase-4 inhibitors to sulphonylureas and risk of hypoglycaemia: systematic review and meta-analysis. BMJ. 2016:353. - PMC - PubMed
    1. Frier B.M. Hypoglycaemia in diabetes mellitus: epidemiology and clinical implications. Nature Reviews Endocrinology. 2014;10(12):711–722. - PubMed
    1. Wexler D.J., Meigs J.B., Cagliero E., Nathan D.M., Grant R.W. Prevalence of hyper- and hypoglycemia among inpatients with diabetes: a national survey of 44 U.S. hospitals. Diabetes Care. 2007;30(2):367–369. - PubMed
    1. McCrimmon R.J., Sherwin R.S. Hypoglycemia in type 1 diabetes. Diabetes. 2010;59(10):2333–2339. - PMC - PubMed
    1. Cryer P.E. Mechanisms of sympathoadrenal failure and hypoglycemia in diabetes. Journal of Clinical Investigation. 2006;116(6):1470–1473. - PMC - PubMed

Publication types

LinkOut - more resources