Comparative Study
. 2019 Feb;60(2):375-387.
doi: 10.1194/jlr.M088559. Epub 2018 Nov 30.

Global analysis of osteosarcoma lipidomes reveal altered lipid profiles in metastatic versus nonmetastatic cells

Affiliations
Comparative Study

Global analysis of osteosarcoma lipidomes reveal altered lipid profiles in metastatic versus nonmetastatic cells

Jahnabi Roy et al. J Lipid Res. 2019 Feb.

Abstract

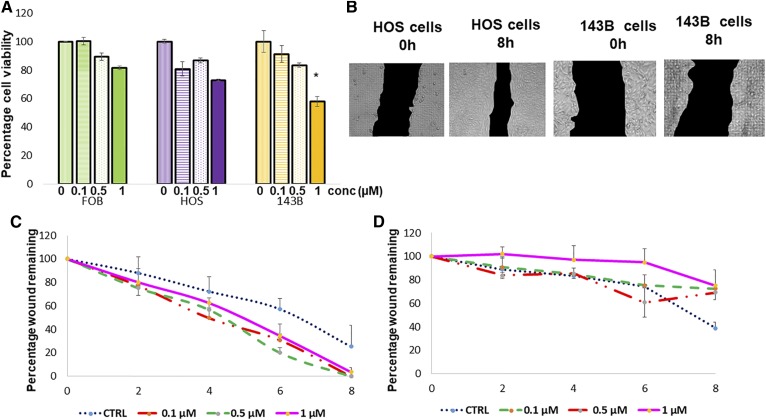
Osteosarcoma (OS) is the most common form of primary bone cancer in humans. The early detection and subsequent control of metastasis has been challenging in OS. Lipids are important constituents of cells that maintain structural integrity that can be converted into lipid-signaling molecules and are reprogrammed in cancerous states. Here, we investigate the global lipidomic differences in metastatic (143B) and nonmetastatic (HOS) human OS cells as compared with normal fetal osteoblast cells (FOB) using lipidomics. We detect 15 distinct lipid classes in all three cell lines that included over 1,000 lipid species across various classes including phospholipids, sphingolipids and ceramides, glycolipids, and cholesterol. We identify a key class of lipids, diacylglycerols, which are overexpressed in metastatic OS cells as compared with their nonmetastatic or nontumorigenic counterparts. As a proof of concept, we show that blocking diacylglycerol synthesis reduces cellular viability and reduces cell migration in metastatic OS cells. Thus, the differentially regulated lipids identified in this study might aid in biomarker discovery, and the synthesis and metabolism of specific lipids could serve as future targets for therapeutic development.

Keywords: cholesterol; diacylglycerol; lipidomics; mass spectrometry.


Figures

Fig. 1.
Fig. 1.
The various classes of lipids. The major classes of biological lipids are phospholipids, sterols, acylglycerides, and sphingolipids. Phospholipids are further classified into PCs, PEs, PSs, PGs, CLs, and phosphatidylinositols (PIs). The major human sterol is cholesterol, which is often stored as ChE. Acylglycerols can be MGs, DGs, and TGs based on the number of acyl groups attached. Sphingolipids are mainly classified into SMs and Cers.
Fig. 2.
Fig. 2.
The 15 major classes of lipids detected in three cell lines: osteoblast FOB (black), nonmetastatic HOS (horizontal striped), and metastatic 143B (gray) as analyzed by ANOVA. The various lipid classes are PCs, PEs, PSs, PGs, phosphatidylinositols (PIs), CL, ChE, MGs, DGs, TGs, SMs, Cers, LPCs, and LPEs. All experiments were performed in three biological replicates (n = 3).
Fig. 3.
Fig. 3.
The number of individual species that are significantly different among the three cell lines. Differences between FOB and HOS represents differences in lipids between normal and nonmetastatic state (yellow). Differences between 143B and HOS represents differences in lipids between nonmetastatic and metastatic state (blue). Differences between FOB and 143B represents differences in lipids between normal and metastatic state (orange).
Fig. 4.
Fig. 4.
A: PCA on all three cell lines, osteoblast FOB (red), nonmetastatic (green), and metastatic 143B (blue) cells as represented in a 3D space. B: The same PCA plot with osteoblast FOB (red), nonmetastatic (green), and metastatic 143B (blue) cells as represented in a 2D space. As shown, all three cell lines occupy a different space in the plot.
Fig. 5.
Fig. 5.
A: Levels of total cholesterol (black), free cholesterol (horizontal bars), and ChE (gray) in FOB, HOS, and 143B cells, as measured by the Amplex Red detection methodology. B: Specific ChE species significantly differentially regulated in the three cell lines FOB (black), HOS (white), and 143B (gray).
Fig. 6.
Fig. 6.
A: Differences in total lipidomic content of 143B cells on treatment with PLC inhibitor U73122. Solid bars represent the lipidomic composition before treatment, and striped bars represent composition after treatment with PLC inhibitor. B: Percentage changes in individual lipid species in treated versus untreated cells that are downregulated (blue) and upregulated (orange).
Fig. 7.
Fig. 7.
A: Reduction in cell viability in all three cell lines on treatment with PLC inhibitor (U73122) as measured by cell titer blue assay. B: Cell migration in 143B and HOS cells with 1 µM PLC inhibitor U73122. C: Cell migration in HOS cells at 0 to 8 h time points with different concentrations of U73122. D: Cell migration in 143B cells at 0 to 8 h time points with different concentrations of U73122. conc, concentration; CTRL, control.
Fig. 8.
Fig. 8.
Differentially regulated genes associated with the DG synthesis and metabolism pathway in 143B (light gray) versus HOS cells (dark gray).

References

    1. Bielack S. S., Kempf-Bielack B., Delling G., Exner G. U., Flege S., Helmke K., Kotz R., Salzer-Kuntschik M., Werner M., Winkelmann W., et al. 2002. Prognostic factors in high-grade osteosarcoma of the extremities or trunk: an analysis of 1,702 patients treated on neoadjuvant cooperative osteosarcoma study group protocols. J. Clin. Oncol. 20: 776–790. - PubMed
    1. Hughes D. P. 2009. Strategies for the targeted delivery of therapeutics for osteosarcoma. Expert Opin. Drug Deliv. 6: 1311–1321. - PMC - PubMed
    1. Baenke F., Peck B., Miess H., and Schulze A.. 2013. Hooked on fat: the role of lipid synthesis in cancer metabolism and tumour development. Dis. Model. Mech. 6: 1353–1363. - PMC - PubMed
    1. Dopico A. M., and Tigyi G. J.. 2007. A glance at the structural and functional diversity of membrane lipids. Methods Mol. Biol. 400: 1–13. - PubMed
    1. Shevchenko A., and Simons K.. 2010. Lipidomics: coming to grips with lipid diversity. Nat. Rev. Mol. Cell Biol. 11: 593–598. - PubMed

Publication types