. 2019 Feb 4;151(2):118-130.
doi: 10.1085/jgp.201812182. Epub 2018 Nov 30.

Chromogranin A, the major lumenal protein in chromaffin granules, controls fusion pore expansion

Affiliations

Chromogranin A, the major lumenal protein in chromaffin granules, controls fusion pore expansion

Prabhodh S Abbineni et al. J Gen Physiol. .

Abstract

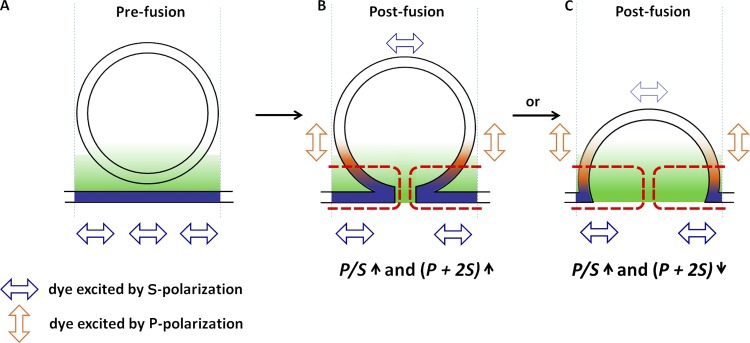
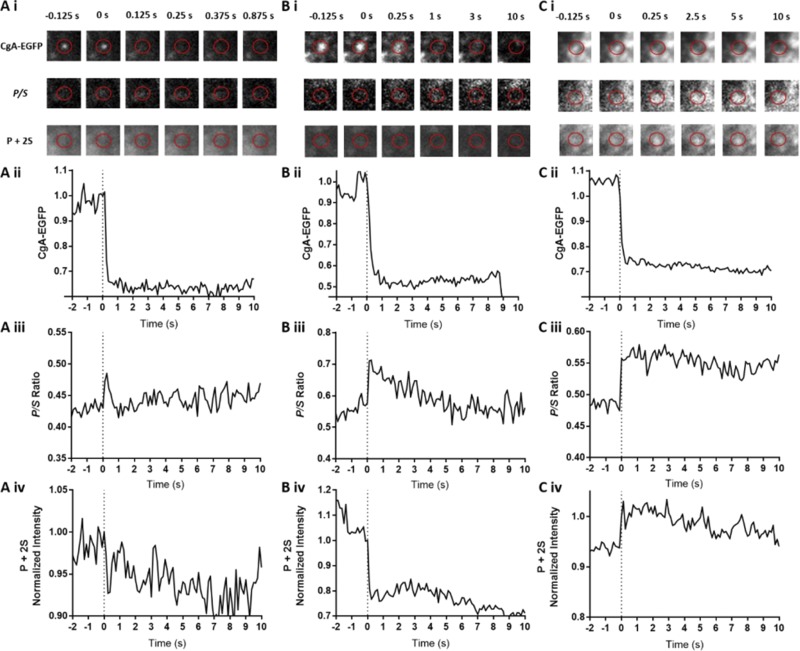
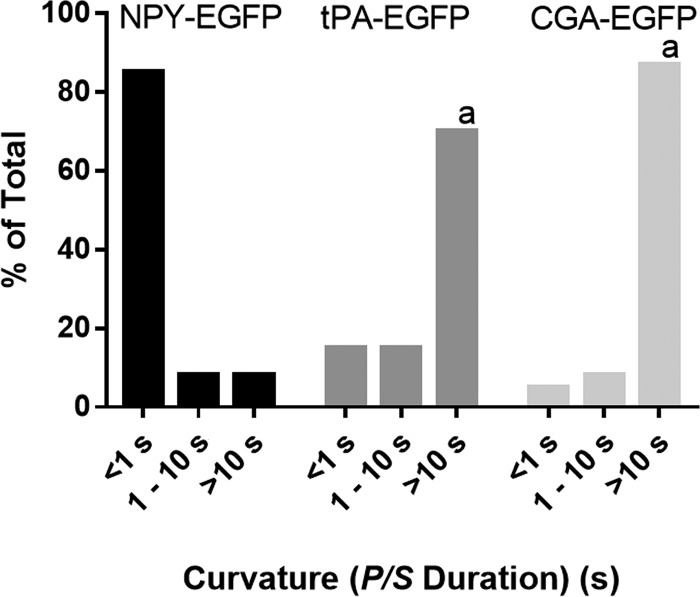
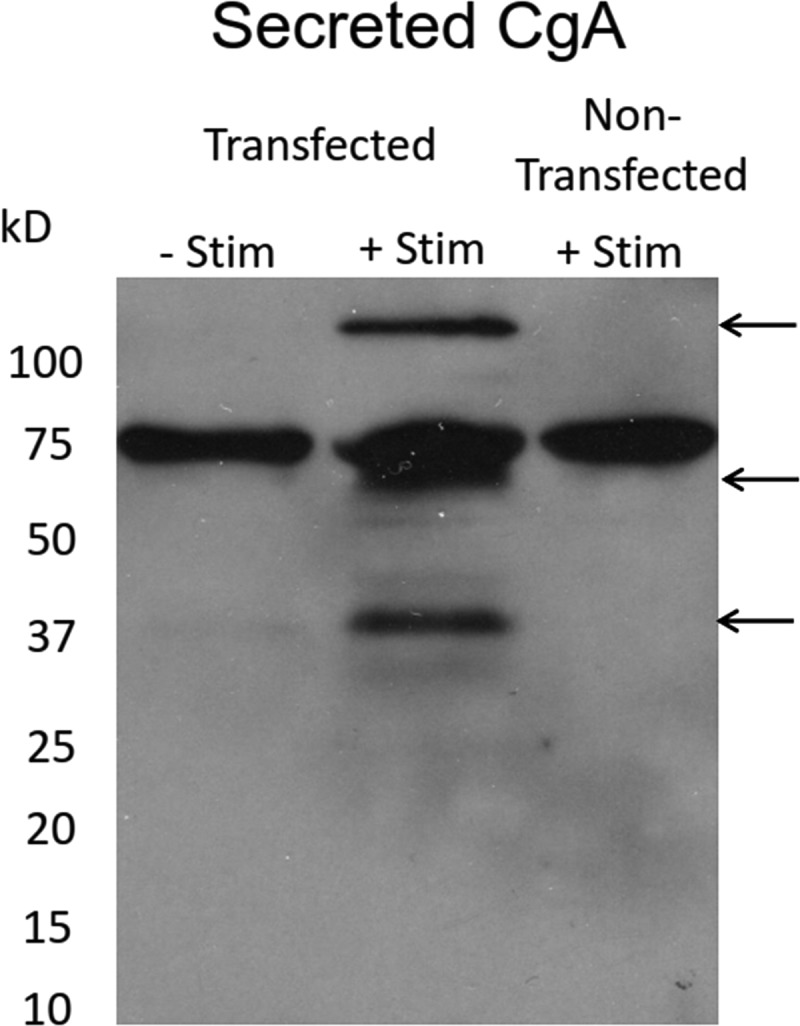
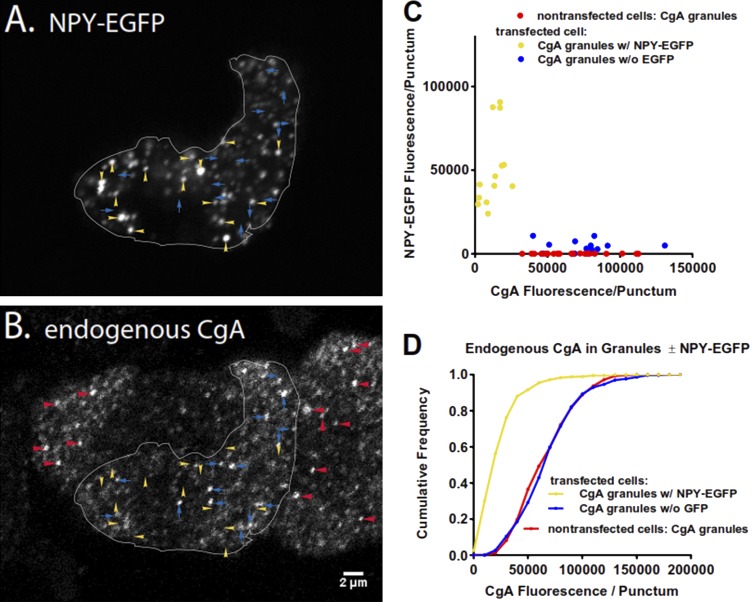
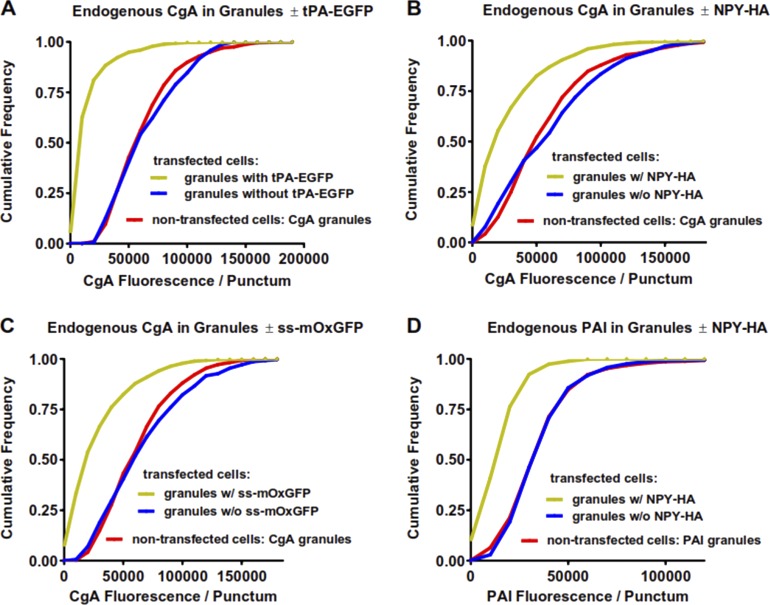
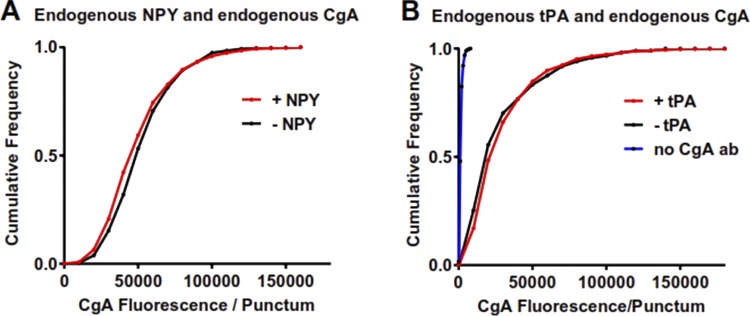
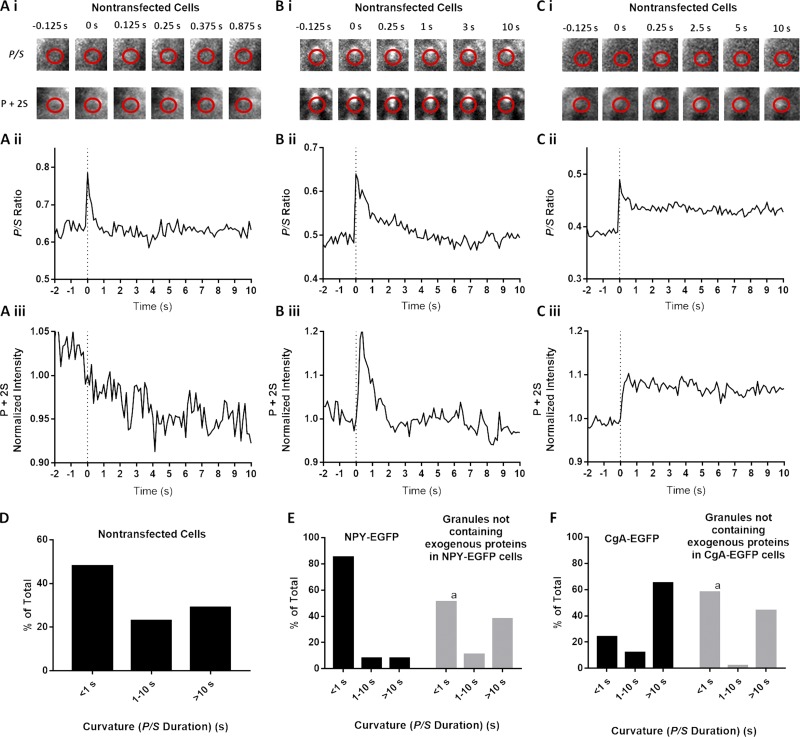
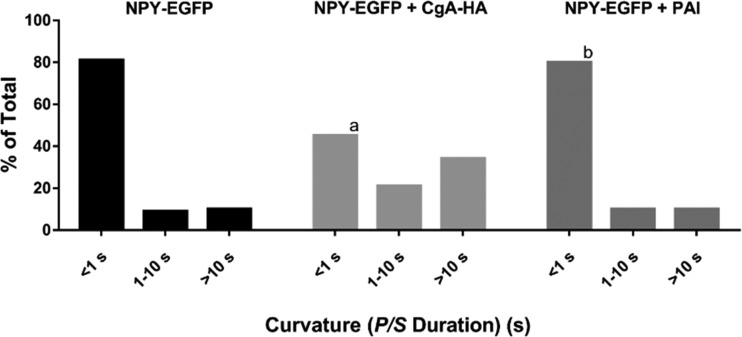
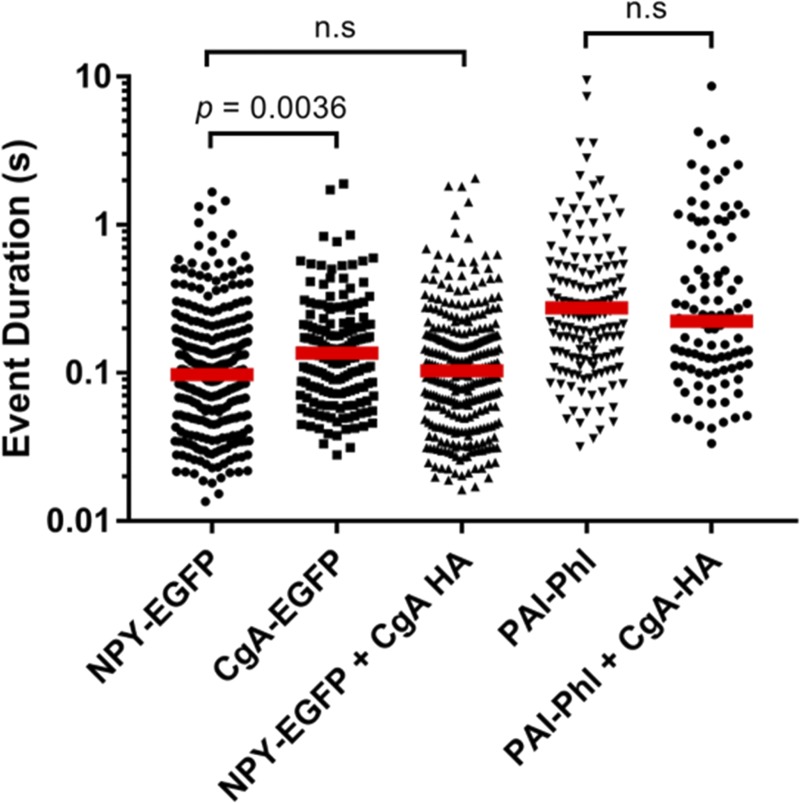
Upon fusion of the secretory granule with the plasma membrane, small molecules are discharged through the immediately formed narrow fusion pore, but protein discharge awaits pore expansion. Recently, fusion pore expansion was found to be regulated by tissue plasminogen activator (tPA), a protein present within the lumen of chromaffin granules in a subpopulation of chromaffin cells. Here, we further examined the influence of other lumenal proteins on fusion pore expansion, especially chromogranin A (CgA), the major and ubiquitous lumenal protein in chromaffin granules. Polarized TIRF microscopy demonstrated that the fusion pore curvature of granules containing CgA-EGFP was long lived, with curvature lifetimes comparable to those of tPA-EGFP-containing granules. This was surprising because fusion pore curvature durations of granules containing exogenous neuropeptide Y-EGFP (NPY-EGFP) are significantly shorter (80% lasting <1 s) than those containing CgA-EGFP, despite the anticipated expression of endogenous CgA. However, quantitative immunocytochemistry revealed that transiently expressed lumenal proteins, including NPY-EGFP, caused a down-regulation of endogenously expressed proteins, including CgA. Fusion pore curvature durations in nontransfected cells were significantly longer than those of granules containing overexpressed NPY but shorter than those associated with granules containing overexpressed tPA, CgA, or chromogranin B. Introduction of CgA to NPY-EGFP granules by coexpression converted the fusion pore from being transient to being longer lived, comparable to that found in nontransfected cells. These findings demonstrate that several endogenous chromaffin granule lumenal proteins are regulators of fusion pore expansion and that alteration of chromaffin granule contents affects fusion pore lifetimes. Importantly, the results indicate a new role for CgA. In addition to functioning as a prohormone, CgA plays an important role in controlling fusion pore expansion.


Figures

Figure 1.
Figure 1.
Measurement of fusion pore curvature using pTIRF microscopy. Cells are stained with DiI, a lipophilic dye that incorporates in the plasma membrane with its transition dipole moment (i.e., the preferred direction of excitation and emission) oriented as indicated by the arrowheads and by color (blue, S-polarized dye; orange, P-polarized dye). The gradient depicts the rapidly decaying evanescent field. (A) Prefusion, DiI is restricted to the plasma membrane, and its transition dipole moment is parallel to the glass interface. (B and C) Postfusion, DiI diffuses into the fused granule membrane, and membrane curvature increases the amount of DiI with its transition dipole moment orientated perpendicularly to the glass interface. Thus, the P/S ratio increases when a membrane is curved within an ROI. The increase occurs for both narrow (B) and wide-neck (C) fusion pores. P + 2S is a measure of the amount of DiI in a given ROI, and changes in P + 2S are dependent on the width of the fusion pore. Unlike P/S, P + 2S is sensitive to the geometric details of the fused granule-plasma membrane. A narrow fusion pore (B) will have more membrane close to the glass interface in a region of high evanescent field excitation, indicated by the red dotted lines, compared with the same ROI before fusion. Thus, a narrow fusion pore will increase the total amount of DiI (P + 2S) within the ROI that is excited by the evanescent field. In contrast, an expanded wide fusion pore (C) will result in less membrane in the region of high evanescent field excitation, indicated by the red dotted line in C, compared with the same ROI before fusion. This figure has been adapted from Bohannon et al. (2017).
Figure 2.
Figure 2.
CgA-EGFP discharge and associated pTIRF microscopy changes for three fusion events. (A–C) Chromaffin cells were transfected to express CgA-EGFP. 3–6 d later, plasma membranes were labeled with DiI. Within 30 min of labeling, individual cells were stimulated by perfusion with solution containing elevated K+. EGFP was detected by excitation at 488 nm, and the orientation of DiI was determined by sequentially exciting the cells with P-polarized and S-polarized 561-nm light (see Materials and methods). P/S and P + 2S were calculated pixel by pixel for each image, and the transformations were aligned to the EGFP images (A iii–C iii, A iv–C iv). A change in P + 2S for cell in A was uncertain. The decrease in P + 2S in B iv is difficult to discern in the corresponding P + 2S images above because of limited dynamic range of the printed images. P + 2S was elevated in B iv and C iv.
Figure 3.
Figure 3.
Fusion pore lifetime varies depending on the overexpressed lumenal protein. Chromaffin cells were transfected to express NPY, tPA, or CgA (all tagged with EGFP). Transfected cells were stimulated by perfusion with elevated K+ and imaged using pTIRF at 8 Hz. The length of time P/S was elevated was calculated as described in Materials and methods for n = 78 NPY-EGFP, n = 20 tPA-EGFP, and n = 60 CgA-EGFP and binned into three categories. A χ2 test was performed to compare the distributions. a, significant difference between distribution of curvature durations of NPY-EGFP–containing granules relative to tPA-EGFP– or CgA-EGFP–containing granules (P < 0.0001).
Figure 4.
Figure 4.
Processing of CgA-EGFP in chromaffin cells, and the molecular weight of released CgA-EGFP. 5 d before the experiment, chromaffin cells were transfected with or without CgA-GFP. Cells were stimulated ± 100 mM K+ PSS containing a protease inhibitor cocktail for 1 min at 34°C. Released material was concentrated and processed as described in Materials and methods. CgA-EGFP was detected with an anti-GFP antibody.
Figure 5.
Figure 5.
Overexpression of a lumenal protein (NPY-EGFP) leads to the reduction of endogenous CgA. (A and B) Chromaffin cells overexpressing NPY-EGFP were fixed with 4% paraformaldehyde, permeabilized, incubated with antibody to bovine CgA, and visualized by confocal microscopy. The transfected cell is outlined in both panels for clarity. Yellow arrowheads indicate examples of NPY-EGFP–containing granules, whereas CgA-containing granules are indicated by blue arrows. Note that NPY-EGFP granules contain little endogenous CgA. Examples of CgA-containing granules in nontransfected cells are indicated by red arrowheads in B. Scale bar = 2 µm. (C) The amount of endogenous CgA (B) was measured by immunofluorescence in NPY-EGFP–containing granules, neighboring granules with no NPY-EGFP, and CgA granules in nontransfected cells. Each point represents one of the individual granules indicated by arrows or arrowheads in the images. (D) The analysis was performed on additional cells and plotted as a cumulative histogram. n = 10 cells/group. Transfected cells, n = 685 CgA granules with NPY-EGFP and n = 298 CgA granules without NPY-EGFP; nontransfected cells, n = 570 CgA granules.
Figure 6.
Figure 6.
Overexpression of a various lumenal proteins with or without fluorophores leads to the reduction of the endogenous lumenal proteins CgA and PAI. (A–D) Chromaffin cells overexpressing various constructs were fixed with 4% paraformaldehyde; permeabilized; incubated with antibodies to bovine CgA (A–C), HA (B and D), or PAI (D) and appropriate secondary antibodies; and visualized by confocal microscopy. Images of transfected and nontransfected cells were analyzed as in Fig. 4, and the results were plotted as cumulative histograms. (A) Transfected cells, n = 1,285 granules with tPA-EGFP, and n = 190 granules without tPA-EGFP in 10 cells; nontransfected cells, n = 692 granules in 10 cells. (B) Transfected cells, n = 845 granules with NPY-HA, and n = 442 granules without NPY-HA in 14 cells; nontransfected cells, n = 767 granules in 17 cells. (C) Transfected cells, n = 1,342 granules with ss-mOxEGFP and n = 371 granules without ss-mOxEGFP in 11 cells; nontransfected cells, n = 569 granules in 13 cells. (D) Transfected cells, n = 800 granules with NPY-HA, and n = 547 granules without NPY-HA in 14 cells; nontransfected cells, n = 848 granules in 19 cells.
Figure 7.
Figure 7.
Granules containing endogenous NPY or tPA do contain CgA. Cultured bovine chromaffin cells were fixed with 4% paraformaldehyde and permeabilized with methanol. (A) Cells were incubated with antibodies to NPY and bovine CgA, followed by Alexa Fluor–labeled anti-mouse and anti-rabbit secondary antibodies, and then visualized by confocal microscopy. (B) Cells were incubated with a primary antibody to tPA, followed by Alexa488-labeled goat anti-rabbit Fab fragments, and then blocked with an excess of unlabeled goat anti-rabbit Fab fragments. Cells were then incubated with or without rabbit anti-bovine CgA, followed by an Alexa546-labeled anti-rabbit secondary antibody, and imaged by confocal microscopy. The absence of significant immunofluorescence in cells with no second primary antibody against CgA (blue line in B; n = 8 cells, 481 puncta) indicates that the first rabbit primary antibody against tPA was completely blocked before the addition of the second primary. Endogenous CgA in tPA-containing granules, n = 11 cells, 883 puncta. Endogenous CgA in granules in cells without tPA, n = 12 cells, 392 puncta.
Figure 8.
Figure 8.
Expression of exogenous lumenal protein alters fusion pore lifetimes. (A–C) Chromaffin cells were transfected to express NPY-EGFP or CgA-EGFP or used without transfection. Transfected and nontransfected cells were stained with DiI, stimulated with elevated K+, and imaged using pTIRF. In nontransfected cells stained with DiI, discrete, punctate changes in fluorescence became visible after stimulation with elevated K+. Three events detected by pTIRF microscopy in nontransfected cells are shown in A, B, and C. (D) P/S lifetimes for events in nontransfected cells (n = 135). (E and F) In transfected cells, granules expressing exogenous protein were identified by EGFP fluorescence, and their discharge and fusion pore expansion were monitored using pTIRF. In the same cells, fusion of granules without transfected protein (i.e., without fluorescent EGFP) was identified as discrete, punctate changes in DiI fluorescence that became visible after stimulation. P/S in the different groups were binned according to their durations. n = 78 NPY-EGFP–expressing granules, n = 37 granules without transfected protein in NPY-EGFP–transfected cells, n = 34 CgA-EGFP–expressing granules, n = 54 granules without transfected protein in CgA-EGFP–transfected cells. A χ2 test was performed to compare the distributions. a, significant difference between distribution of curvature durations of granules without transfected protein compared with NPY-EGFP–containing (P < 0.0001) or CgA-EGFP–containing (P = 0.0051) granules.
Figure 9.
Figure 9.
The presence of CgA slows fusion pore expansion. Chromaffin cells were transfected with NPY-EGFP + pcDNA, NPY-EGFP + CgA-HA, or NPY-EGFP + PAI. Transfected cells were stained with DiI, stimulated with elevated K+, and imaged using pTIRF. P/S ratios were calculated at the site of lumenal protein discharge. The length of time P/S was elevated was calculated as described in Materials and methods for n = 111 NPY-EGFP, n = 150 NPY-EGFP + CgA-HA, n = 30 NPY-EGFP + PAI and binned into three categories. A χ2 test was performed to compare the distributions. a, significant difference between distribution of curvature durations of NPY-EGFP–containing granules and NPY-EGFP + CgA-HA–containing granules (P < 0.0001). b, no significant difference between distribution of curvature durations of NPY-EGFP–containing granules and NPY-EGFP + PAI–containing granules.
Figure 10.
Figure 10.
Coexpression of CgA does not influence the release of NPY EGFP or PAI Phl. Chromaffin cells were transfected with combinations of plasmids encoding the indicated proteins. Secretion was stimulated by perfusion with elevated K+ and monitored using TIRF microscopy at the rate of 36–60 Hz for cells expressing NPY and CgA, and at 60 Hz for cells expressing PAI-Phl. Each data point represents one secretion event. The duration of each event was determined using a custom program written in IDL (described in Materials and methods). The red dashed lines represent the median duration. n = 288 for NPY-EGFP, n = 170 for CgA-EGFP, n = 297 for NPY-EGFP + CgA-HA, n = 162 for PAI-Phl, and n = 107 for PAI-Phl + CgA-HA. A Kolmogorov–Smirnoff test was performed to compare the distributions. n.s, not significant.
Figure 11.
Figure 11.
Possible mechanisms by which lumenal proteins can influence the fusion pore. (A) Lumenal proteins preferentially bind and stabilize the highly curved fusion pore (shown in rectangle). (B) Lumenal proteins bind the inner leaflet of the granule membrane, giving it stiffness or rigidity that prevents expansion and flattening of the granule membrane into the plasma membrane. (C) Lumenal proteins indirectly influence the protein or lipid composition of the granule membrane during granule biogenesis, thereby altering fusion pore dynamics.

References

    1. Anantharam A., Axelrod D., and Holz R.W.. 2010a Polarized TIRFM reveals changes in plasma membrane topology before and during granule fusion. Cell. Mol. Neurobiol. 30:1343–1349. 10.1007/s10571-010-9590-0 - DOI - PMC - PubMed
    1. Anantharam A., Onoa B., Edwards R.H., Holz R.W., and Axelrod D.. 2010b Localized topological changes of the plasma membrane upon exocytosis visualized by polarized TIRFM. J. Cell Biol. 188:415–428. 10.1083/jcb.200908010 - DOI - PMC - PubMed
    1. Anantharam A., Bittner M.A., Aikman R.L., Stuenkel E.L., Schmid S.L., Axelrod D., and Holz R.W.. 2011. A new role for the dynamin GTPase in the regulation of fusion pore expansion. Mol. Biol. Cell. 22:1907–1918. 10.1091/mbc.e11-02-0101 - DOI - PMC - PubMed
    1. Axelrod D. 1979. Carbocyanine dye orientation in red cell membrane studied by microscopic fluorescence polarization. Biophys. J. 26:557–573. 10.1016/S0006-3495(79)85271-6 - DOI - PMC - PubMed
    1. Bao H., Goldschen-Ohm M., Jeggle P., Chanda B., Edwardson J.M., and Chapman E.R.. 2016. Exocytotic fusion pores are composed of both lipids and proteins. Nat. Struct. Mol. Biol. 23:67–73. 10.1038/nsmb.3141 - DOI - PMC - PubMed

Publication types