. 2019 Jan 23;39(4):678-691.
doi: 10.1523/JNEUROSCI.1634-18.2018. Epub 2018 Nov 30.

Drebrin-like (Dbnl) Controls Neuronal Migration via Regulating N-Cadherin Expression in the Developing Cerebral Cortex

Affiliations

Drebrin-like (Dbnl) Controls Neuronal Migration via Regulating N-Cadherin Expression in the Developing Cerebral Cortex

Seika Inoue et al. J Neurosci. .

Abstract

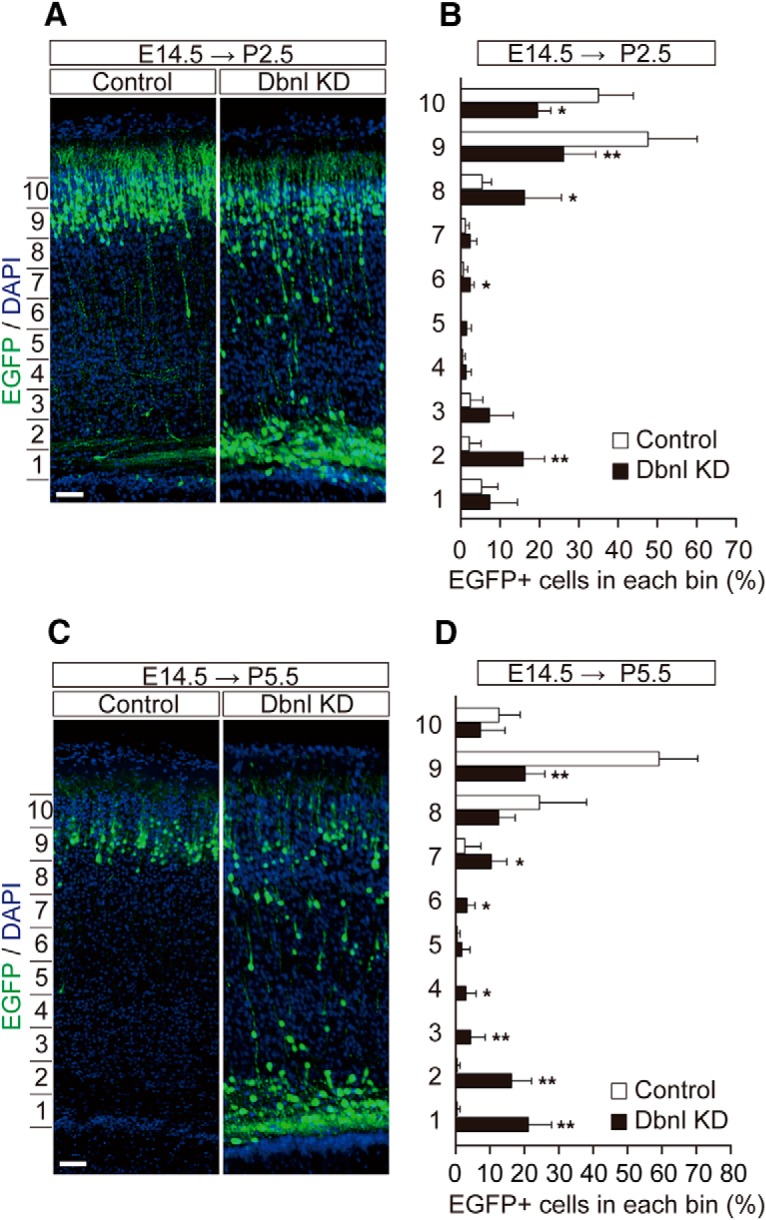
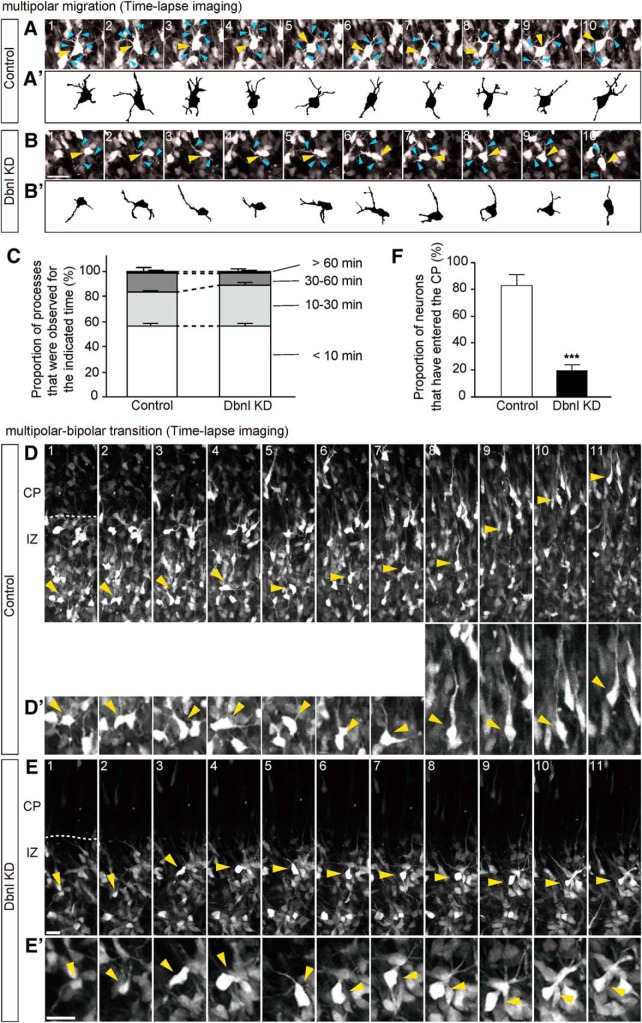
The actin cytoskeleton is crucial for neuronal migration in the mammalian developing cerebral cortex. The adaptor protein Drebrin-like (Dbnl) plays important roles in reorganization of the actin cytoskeleton, dendrite formation, and endocytosis by interacting with F-actin, cobl, and dynamin. Although Dbnl is known to be expressed in the brain, the functions of this molecule during brain development are largely unknown. In this study, to examine the roles of Dbnl in the developing cerebral cortex, we conducted experiments using mice of both sexes with knockdown of Dbnl, effected by in utero electroporation, in the migrating neurons of the embryonic cortex. Time-lapse imaging of the Dbnl-knockdown neurons revealed that the presence of Dbnl is a prerequisite for appropriate formation of processes in the multipolar neurons in the multipolar cell accumulation zone or the deep part of the subventricular zone, and for neuronal polarization and entry into the cortical plate. We found that Dbnl knockdown decreased the amount of N-cadherin protein expressed on the plasma membrane of the cortical neurons. The defect in neuronal migration caused by Dbnl knockdown was rescued by moderate overexpression of N-cadherin and αN-catenin or by transfection of the phospho-mimic form (Y337E, Y347E), but not the phospho-resistant form (Y337F, Y347F), of Dbnl. These results suggest that Dbnl controls neuronal migration, neuronal multipolar morphology, and cell polarity in the developing cerebral cortex via regulating N-cadherin expression.SIGNIFICANCE STATEMENT Disruption of neuronal migration can cause neuronal disorders, such as lissencephaly and subcortical band heterotopia. During cerebral cortical development, the actin cytoskeleton plays a key role in neuronal migration; however, the mechanisms of regulation of neuronal migration by the actin cytoskeleton still remain unclear. Herein, we report that the novel protein Dbnl, an actin-binding protein, controls multiple events during neuronal migration in the developing mouse cerebral cortex. We also showed that this regulation is mediated by phosphorylation of Dbnl at tyrosine residues 337 and 347 and αN-catenin/N-cadherin, suggesting that the Dbnl-αN-catenin/N-cadherin pathway is important for neuronal migration in the developing cortex.

Keywords: cerebral cortex; development; neuronal migration; phosphorylation.


Figures

Figure 1.
Figure 1.
Dbnl is expressed in the developing mouse cerebral cortex. A, B, Immunohistochemical staining for Dbnl (green), Unc5D (magenta) as a marker for the MAZ/SVZ (A‴), and DAPI (blue) using sections from the cerebral cortex at E16.5 (A–A‴) and P0.5 (B, B′) of the ICR mouse. Scale bars, 100 μm.
Figure 2.
Figure 2.
Dbnl controls neuronal migration in the MAZ/SVZ and IZ. A, KD of Dbnl by the pSilencer-Dbnl shRNA. The pSilencer-Dbnl shRNA with the pCAGGS-Dbnl-WT or -resist, which was a KD resistant form of Dbnl, was transfected into the HEK293T cells (N = 3 experiments). The cell lysates were subjected to Western blotting for Dbnl, with GAPDH measured as the internal control. B, A normalized graph represents the Dbnl/GAPDH ratio (A) (N = 3 experiments). C, pSilencer-Dbnl shRNA or the empty vector was introduced into the primary culture of cortical neurons. The cell lysates were subjected to Western blotting for Dbnl, with GAPDH measured as the internal control. D, A normalized graph represents the Dbnl/GAPDH ratio (C) (N = 3 experiments). E, G, Effects of Dbnl KD on the migration of cortical neurons. In utero electroporation of the mouse embryonic brains at E14.5 with Dbnl-shRNA plus pCAGGS-EGFP, or the pSilencer-control vector plus pCAGGS-EGFP, as control, was performed. There were no obvious differences in position between the control and Dbnl KD neurons at E17.5 (E; Control: N = 10 brains; Dbnl KD: N = 4 brains), whereas Dbnl KD suppressed migration of the cortical neurons at 4 d after transfection (G; Control, N = 7 brains; Dbnl KD, N = 8 brains). F, H, Graphs represent proportion of EGFP-positive cells in each bin. White bar represents Control. Black bar represents Dbnl KD. The entire cortex in the image was divided into 10 equally spaced bins (bin 1, deepest; bin 10, most superficial). Statistically significant differences were observed in bin 3 (Control vs Dbnl KD, **p = 0.001) and bin 10 (Control vs Dbnl KD, **p = 0.009) (H). I, Domain structure of Dbnl. Arrowheads on the sequence indicate Y337 and Y347 (green letters), which are the residues phosphorylated by Fyn. Dbnl 2F indicates the Dbnl mutant in which the tyrosine residues Y337 and Y347 were substituted with phenylalanine (magenta letters). J, Y337 and Y347 residues of Dbnl are important for the tyrosine residues phosphorylated by Fyn. Fyn [a constitutively active (CA) or kinase-dead] and Dbnl (WT, Y337F, Y347F, or 2F)-Flag were exogenously coexpressed in the HEK293T cells, and samples immunoprecipitated with the anti-FLAG antibody were subjected to Western blotting with anti-PY20 and FLAG antibodies, while the input was blotted with anti-FLAG and GAPDH antibodies. K, A normalized graph represents the PY20/FLAG ratio (J) (N = 6 experiments). L, Mouse embryonic brains at E14.5 were electroporated with Dbnl KD plus either pCAGGS-1 (N = 5 brains), pCAGGS-Dbnl-resist (N = 5 brains), pCAGGS-Dbnl 2F (N = 4 brains), or pCAGGS-Dbnl 2E (N = 7 brains), together with pCAGGS-EGFP. The pSilencer-control vector plus pCAGGS-1 and pCAGGS-EGFP were transfected as control (N = 5 brains). The brains were fixed at P0.5 and sectioned. Each section was stained with DAPI. M, Graph represents the proportion of EGFP-positive cells in each bin. White bar represents Control. Black bar represents Dbnl KD. Gray bar represents Dbnl KD + resist [Dbnl rescue]. Orange bar represents Dbnl KD + 2F. Blue bar represents Dbnl KD + 2E. The entire cortex in each image was divided into 10 equally spaced bins (bin 1, deepest; bin 10, most superficial). Statistically significant differences were observed in bin 3 (Control vs Dbnl KD, ***p < 0.001; Control vs Dbnl 2F, *p < 0.001; Dbnl rescue vs Dbnl KD, *p = 0.028; Dbnl rescue vs Dbnl 2F, **p = 0.007; Dbnl 2E vs Dbnl KD, **p = 0.005; Dbnl 2E vs Dbnl 2F, *p = 0.01), bin 4 (Control vs Dbnl KD, *p = 0.037; Dbnl KD vs Dbnl rescue, *p = 0.022; Dbnl KD vs Dbnl 2E, *p = 0.034), bin 9 (Dbnl KD vs Dbnl 2E, *p = 0.038), and bin 10 (Control vs Dbnl KD, ***p < 0.001; Control vs Dbnl 2F, *p < 0.001; Control vs Dbnl 2E, **p = 0.007; Dbnl rescue vs Dbnl 2F, **p = 0.001). N, O, Graphs represent the proportion of EGFP-positive cells in bin 3 (N) and bin 10 (O). M, Different letters on the bars within the same bin indicate a statistically significant difference between the pair, whereas the same letter within the same bin or the absence of any letters within the bins indicates the absence of any statistically significant difference. Error bar indicates mean ± SEM. Student's t test, Mann–Whitney's U test, or one-way ANOVA with Tukey–Kramer test: *p < 0.05; **p < 0.01; ***p < 0.001. Scale bars, 50 μm.
Figure 3.
Figure 3.
Dbnl controls the neuronal cell positioning after birth. A, C, Mouse embryonic brains at E14.5 were electroporated with Dbnl-KD and pCAGGS-EGFP, or pSilencer-control vector and pCAGGS-EGFP as a control, then fixed at P2.5 (A; control: N = 7 brains; Dbnl KD: N = 5 brains), or P5.5 (C; control: N = 6 brains; Dbnl KD: N = 4 brains). B, D, Graphs represent proportion of EGFP-positive cells in each bin. White bar represents Control. Black bar represents Dbnl KD. The entire cortex in the image was divided into 10 equally spaced bins (bin 1, deepest; bin 10, most superficial). Statistically significant differences were observed in bin 2 (Control vs Dbnl KD, **p = 0.003), bin 6 (Control vs Dbnl KD, *p = 0.048), bin 8 (Control vs Dbnl KD, *p = 0.048), bin 9 (Control vs Dbnl KD, **p = 0.010), bin 10 (Control vs Dbnl KD, *p = 0.018) (B), and bin 1 (Control vs Dbnl KD, **p = 0.004), bin 2 (Control vs Dbnl KD, **p = 0.004), bin 3 (Control vs Dbnl KD, **p = 0.004), bin 4 (Control vs Dbnl KD, *p = 0.03), bin 6 (Control vs Dbnl KD, *p = 0.03), bin 7 (Control vs Dbnl KD, *p = 0.03), and bin 9 (Control vs Dbnl KD, **p = 0.004) (D). Error bar indicates mean ± SEM. Student's t test or Mann–Whitney's U test: *p < 0.05; **p < 0.01. Scale bars, 50 μm.
Figure 4.
Figure 4.
Dbnl is involved in the morphological alterations and polarization of neurons located in the MAZ/SVZ and IZ. A, A′, Mouse embryonic brains at E14.5 were electroporated with the control (A) or Dbnl-KD (A′) vector together with pCAGGS-M-cre plus pCALNL-EGFP as visualized by the sparse labeling method, then fixed at E16.5 (Control, N = 4 brains; Dbnl KD, N = 4 brains). The entire cortex in the image was divided into 10 equally spaced bins (bin 1, deepest; bin 10, most superficial). B, B′, Magnified images of the control (B) and Dbnl-KD neurons (B′) located in bin 3 of A and A′, and reconstructed shapes of the EGFP-positive neurons. C, C′, Magnified images of the control (C) and Dbnl-KD neurons (C′) located in bin 3 of A and A′. Arrowheads indicate the Golgi apparatuses of the EGFP-positive neurons. Scale bars, 10 μm. D, Quantitative comparison of the number of processes between the control neurons (B) and Dbnl-KD neurons (B′) (n = 10–15 neurons per brain were counted). E, Quantitative comparison of the proportion of cells with their Golgi apparatus facing the basal part of the CP between control neurons (B) and Dbnl-KD neurons (B′) (n = 30–50 neurons per brain were counted). F, F′, Staining of the neuronal Golgi apparatuses (red) of the control neurons (F) and Dbnl-KD neurons (F′) transfected with pCAGGS-M-cre plus pCALNL-EGFP at E14.5 and fixed at E17.5 (control, N = 3 brains; Dbnl KD, N = 3 brains). G, G′, Magnified images of each of the control (G) and Dbnl-KD neurons (G′) located in bin 3 of F and F′. H, H′, Magnified images of the control (H) and Dbnl-KD neurons (H′) located in bin 3 of F and F′. Arrowheads indicate the location of Golgi apparatuses of the EGFP-positive neurons. Scale bars, 10 μm. I, Quantitative analysis of the control and Dbnl-KD neurons with the Golgi apparatuses facing the basal part of the CP (n = 30–50 neurons per brain were counted). J, J′, Mouse embryonic brains were electroporated with pCAGGS-M-cre and pCALNL-EGFP with either the control (J) or Dbnl-KD (J′) vector at E14.5 and fixed at E18.5 (control: N = 4 brains; Dbnl KD: N = 3 brains). The entire cortex in each image was divided into 10 equally spaced bins (bin 1, deepest; bin 10, most superficial). K, K′, Magnified images of the control (K) and Dbnl-KD neurons (K′) located in bin 3 of J and J′, and reconstructed shapes of the EGFP-positive neurons in E18.5 cortices. L, M, Quantitative analyses of the number of processes elongating from the cell body (L), and the length of the processes (n = 10–15 neurons per brain were counted) (M) between the control (K) and Dbnl KD neurons (K′). N, N′, Staining of the Golgi apparatuses of the E14.5 mouse embryonic neurons electroporated with pCAGGS-M-cre plus pCALNL-EGFP together with the control (N) or Dbnl-KD (N′) plasmid (control: N = 3 brains; Dbnl KD: N = 3 brains). O, O′, Magnified images of the control (O) and Dbnl-KD neurons (O′) located in bin 3 of N and N′, respectively. P, P′, Magnified images of the control (P) and Dbnl-KD neurons (P′) located in bin 3 of N and N′. Arrowheads indicate the location of Golgi apparatuses of the EGFP-positive neurons. Scale bars, 10 μm. Q, Quantitative analysis of neurons with their Golgi apparatuses facing the basal part of the CP in the control (O) and Dbnl-KD neurons (O′) (n = 30–50 neurons per brain were counted). Error bar indicates mean ± SEM. Student's t test: **p < 0.01; ***p < 0.001. Scale bars, 50 μm.
Figure 5.
Figure 5.
KD of Dbnl in migrating neurons restrains the entry of the neurons into the CP. A, B, Time-lapse images of migrating multipolar cells. The EGFP plasmid with either the pSilencer-control (A) or the Dbnl KD vector (B) was electroporated into the cells along the ventricle at E14.5, and time-lapse images of the multipolar cells (yellow arrowheads) with multiple processes (cyan arrowheads) were obtained from the cortical slices of the electroporated brain after 2 d. The time-lapse images were obtained every 10 min under a confocal microscope. The images obtained every 20 min are displayed. Reconstructed shapes of multipolar cells are shown in A′ (control) and B′ (Dbnl KD). A, B, Images are shown at the same magnification. Scale bar, 25 μm. C, Quantitative analysis of the processes that were observed for the indicated time (N = 4 brains, n = 3–5 neurons per brain, n = 8–20 processes per neuron in each group). D, E, The EGFP plasmid with either the pSilencer-control (D) or the Dbnl KD vector (E) was electroporated at E14.5, and time-lapse images of the migrating cells (yellow arrowheads) were obtained from the cortical slices of the electroporated brain after 2 d. Magnified images of cells indicated by the arrowheads in D and E are shown in D′ and E′, respectively. The time-lapse images were taken every 10 min. The images obtained every hour are displayed. D, E, Images are shown at the same magnification. Scale bar, 20 μm. F, Quantitative analysis of the neurons that have entered the CP (N = 4 brains, n = 17–25 neurons per brain in each group). Error bar indicates mean ± SEM. ***p < 0.001 (Student's t test).
Figure 6.
Figure 6.
Dbnl regulates neuronal migration in the developing cortex through regulation of N-cadherin and αN-catenin. A, in vitro membrane N-cadherin assay using primary cortical neurons at E16. The cultured neurons were treated with a guinea pig anti-N-cadherin antibody, and the amount of N-cadherin expressed on the neuronal plasma membrane was measured by quantifying the amount of anti-N-cadherin antibody bound to the neurons. The cell lysates were subjected to Western blotting with an anti-guinea pig IgG antibody and an anti-GAPDH antibody as an internal control. B, A normalized graph represents the guinea pig IgG (N-cadherin)/GAPDH ratio (A) (N = 4 experiments). C, E14.5 mouse embryonic brains were electroporated with the Dbnl-KD vector and pCAGGS-EGFP plus pCAGGS-1 (N = 5 brains), pCAGGS-N-cadherin (N = 4 brains), pCAGGS-αN-catenin (N = 5 brains), or both of pCAGGS-N-cadherin and pCAGGS-αN-catenin (N = 8 brains) plasmids. pSilencer-control vector plus pCAGGS-1 and pCAGGS-EGFP were used as the controls (N = 4 brains). The brains were fixed at P0.5 and sectioned. Each section was stained with DAPI. D, Graph showing the proportion of EGFP-positive cells in each bin. White bar represents Control. Black bar represents Dbnl KD. Gray bar represents Dbnl KD + N-cadherin. Orange bar represents Dbnl KD + αN-catenin. Blue bar represents Dbnl KD + N-cadherin + αN-catenin. The entire cortex in each image was divided into 10 equally spaced bins (bin 1, deepest; bin 10, most superficial). Statistically significant differences were observed in bin 2 (Dbnl KD vs Dbnl KD + N-cadherin, **p = 0.008; Dbnl KD vs Dbnl KD + αN-catenin, **p = 0.003; Dbnl KD vs Dbnl KD + N-cadherin + αN-catenin, *p = 0.025), bin 3 (Control vs Dbnl KD, *p = 0.015; Dbnl KD vs Dbnl KD + N-cadherin + αN-catenin, *p = 0.016), bin 4 (Control vs Dbnl KD, **p = 0.001; Dbnl KD vs Dbnl KD + αN-catenin, **p = 0.009; Dbnl KD vs Dbnl KD + N-cadherin + αN-catenin, **p = 0.007), and bin 9 (Control vs Dbnl KD, **p = 0.007; Dbnl KD vs Dbnl KD + N-cadherin, *p = 0.020; Dbnl KD vs Dbnl KD + N-cadherin + αN-catenin, *p = 0.026). E, F, Graphs represent the proportion of EGFP-positive cells in bin 3 (E) and bin 9 (F). D, Different letters on the bars within the same bin indicate a statistically significant difference between the pair, whereas the same letter within the same bin or the absence of any letters within the bins indicates the absence of any statistically significant difference. Error bar indicates mean ± SEM. Student's t test or one-way ANOVA with Tukey–Kramer post hoc test: **p < 0.01. Scale bars, 50 μm.

Similar articles

Cited by

References

    1. Ajioka I, Nakajima K (2005) Switching of alpha-catenin from alphaE-catenin in the cortical ventricular zone to alphaN-catenin II in the intermediate zone. Brain Res Dev Brain Res 160:106–111. 10.1016/j.devbrainres.2005.08.004 - DOI - PubMed
    1. Boateng LR, Cortesio CL, Huttenlocher A (2012) Src-mediated phosphorylation of mammalian Abp1 (DBNL) regulates podosome rosette formation in transformed fibroblasts. J Cell Sci 125:1329–1341. 10.1242/jcs.096529 - DOI - PMC - PubMed
    1. Cooke MP, Perlmutter RM (1989) Expression of a novel form of the fyn proto-oncogene in hematopoietic cells. New Biol 1:66–74. - PubMed
    1. Cotton PC, Brugge JS (1983) Neural tissues express high levels of the cellular src gene product pp60c-src. Mol Cell Biol 3:1157–1162. 10.1128/MCB.3.6.1157 - DOI - PMC - PubMed
    1. Franco SJ, Martinez-Garay I, Gil-Sanz C, Harkins-Perry SR, Müller U (2011) Reelin regulates cadherin function via Dab1/Rap1 to control neuronal migration and lamination in the neocortex. Neuron 69:482–497. 10.1016/j.neuron.2011.01.003 - DOI - PMC - PubMed

Publication types

MeSH terms