

Differentiating Alzheimer's Disease from Dementia with Lewy Bodies Using a Deep Learning Technique Based on Structural Brain Connectivity
- PMID: 30504639
- PMCID: PMC6630050
- DOI: 10.2463/mrms.mp.2018-0091
Differentiating Alzheimer's Disease from Dementia with Lewy Bodies Using a Deep Learning Technique Based on Structural Brain Connectivity
Abstract
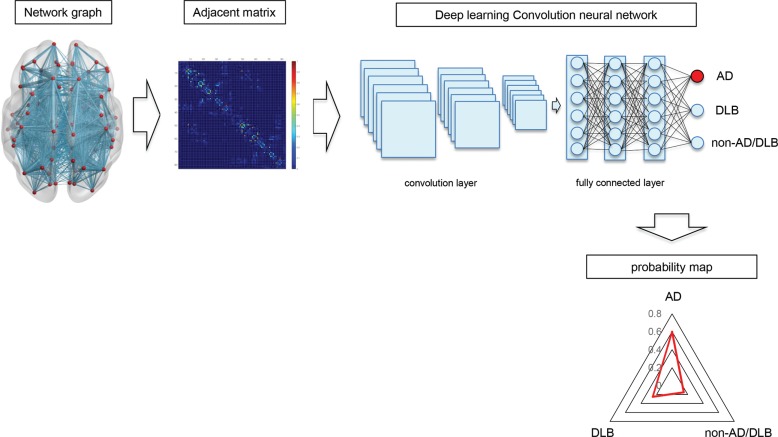
Purpose: Alzheimer's disease (AD) and dementia with Lewy bodies (DLB) are representative disorders of dementia of the elderly and the neuroimaging has contributed to early diagnosis by estimation of alterations of brain volume, blood flow and metabolism. A brain network analysis by MR imaging (MR connectome) is a recently developed technique and can estimate the dysfunction of the brain network in AD and DLB. A graph theory which is a major technique of network analysis is useful for a group study to extract the feature of disorders, but is not necessarily suitable for the disorder differentiation at the individual level. In this investigation, we propose a deep learning technique as an alternative method of the graph analysis for recognition and classification of AD and DLB at the individual subject level.
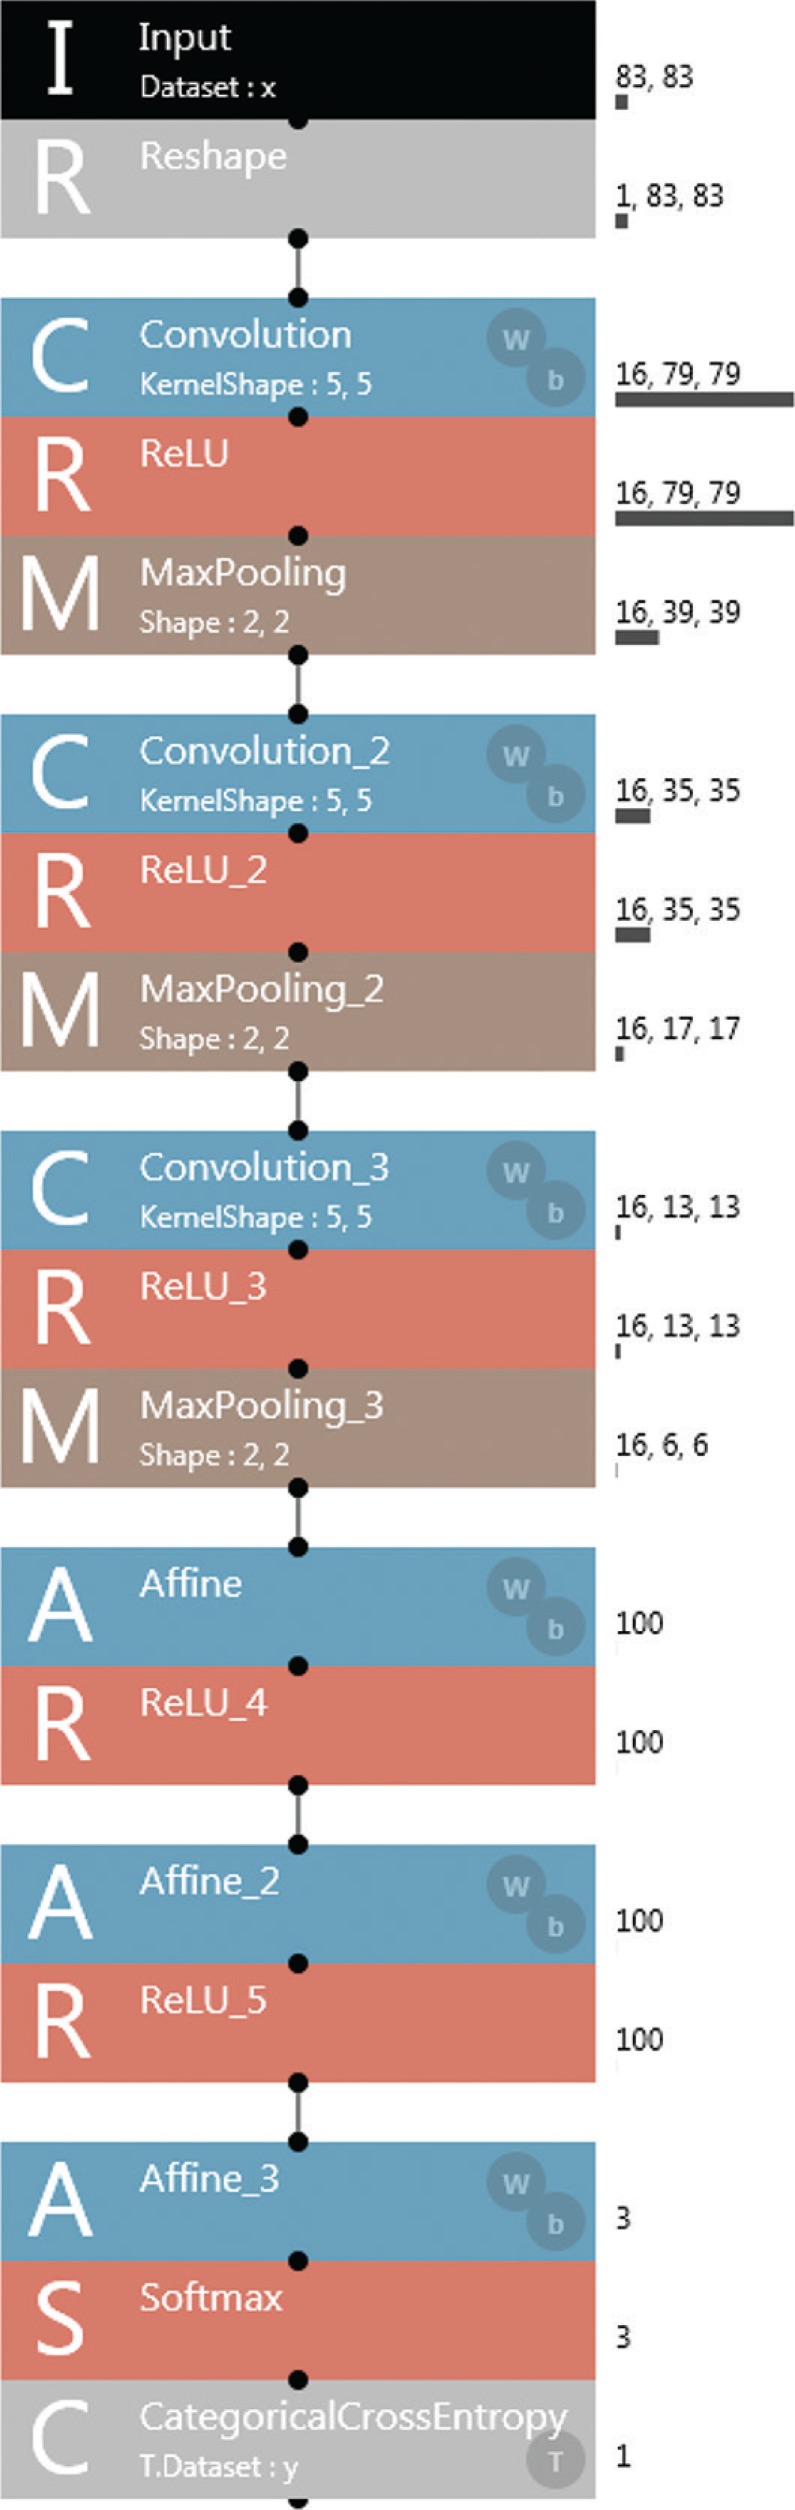
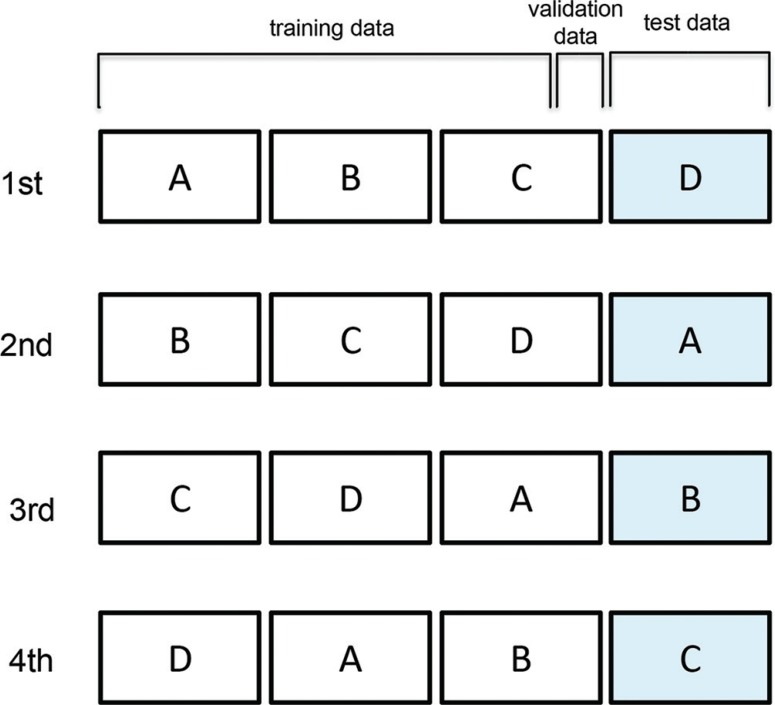
Materials and methods: Forty-eight brain structural connectivity data of 18 AD, 8 DLB and 22 healthy controls were applied to the machine learning consisting of a six-layer convolution neural network (CNN) model. Estimation of the deep learning model to classify AD, DLB and non-AD/DLB was performed using the 4-fold cross-validation method.
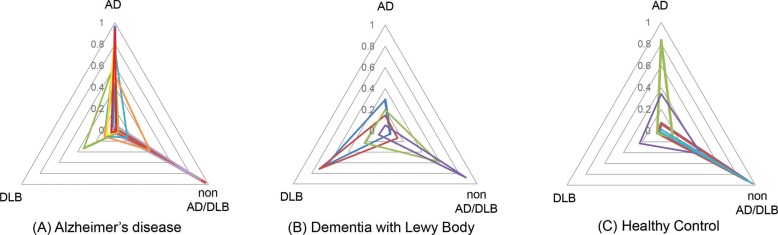
Results: The accuracy, average precision and recall of our CNN model were 0.73, 0.78 and 0.73, and the specificity precision and recall were 0.68 and 0.79 in AD, 0.94 and 0.65 in DLB and 0.73 and 0.75 in non-AD/DLB. The triangular probability map of the MR connectome revealed the probability of AD, DLB and non-AD/DLB in each subject.
Conclusion: Our preliminary investigation revealed the adaptation of deep learning to the MR connectome and proposed its utility in the differentiation of dementia disorders at the individual subject level.
Keywords: Alzheimer’s disease; deep learning; dementia with Lewy bodies; structural brain connectivity.
Conflict of interest statement
The authors declare no conflicts of interest associated with this manuscript.
Figures
Similar articles
-
Differentiating Dementia with Lewy Bodies and Alzheimer's Disease by Deep Learning to Structural MRI.J Neuroimaging. 2021 May;31(3):579-587. doi: 10.1111/jon.12835. Epub 2021 Jan 21. J Neuroimaging. 2021. PMID: 33476487
-
Subcortical volume changes in dementia with Lewy bodies and Alzheimer's disease. A comparison with healthy aging.Int Psychogeriatr. 2016 Apr;28(4):529-36. doi: 10.1017/S1041610215001805. Epub 2015 Nov 17. Int Psychogeriatr. 2016. PMID: 26572170
-
Multimodal EEG-MRI in the differential diagnosis of Alzheimer's disease and dementia with Lewy bodies.J Psychiatr Res. 2016 Jul;78:48-55. doi: 10.1016/j.jpsychires.2016.03.010. Epub 2016 Mar 25. J Psychiatr Res. 2016. PMID: 27060340 Free PMC article.
-
Imaging in Dementia With Lewy Bodies: An Overview.J Geriatr Psychiatry Neurol. 2016 Sep;29(5):254-60. doi: 10.1177/0891988716654984. J Geriatr Psychiatry Neurol. 2016. PMID: 27502300 Review.
-
PD and DLB: Brain imaging in Parkinson's disease and dementia with Lewy bodies.Prog Mol Biol Transl Sci. 2019;165:167-185. doi: 10.1016/bs.pmbts.2019.07.009. Epub 2019 Aug 7. Prog Mol Biol Transl Sci. 2019. PMID: 31481162 Review.
Cited by
-
Artificial intelligence for brain diseases: A systematic review.APL Bioeng. 2020 Oct 13;4(4):041503. doi: 10.1063/5.0011697. eCollection 2020 Dec. APL Bioeng. 2020. PMID: 33094213 Free PMC article. Review.
-
Multimodal deep learning for Alzheimer's disease dementia assessment.Nat Commun. 2022 Jun 20;13(1):3404. doi: 10.1038/s41467-022-31037-5. Nat Commun. 2022. PMID: 35725739 Free PMC article.
-
Deep Feature Selection and Causal Analysis of Alzheimer's Disease.Front Neurosci. 2019 Nov 15;13:1198. doi: 10.3389/fnins.2019.01198. eCollection 2019. Front Neurosci. 2019. PMID: 31802999 Free PMC article.
-
A Robust and Accurate Deep-learning-based Method for the Segmentation of Subcortical Brain: Cross-dataset Evaluation of Generalization Performance.Magn Reson Med Sci. 2021 Jun 1;20(2):166-174. doi: 10.2463/mrms.mp.2019-0199. Epub 2020 May 11. Magn Reson Med Sci. 2021. PMID: 32389928 Free PMC article.
References
-
- McKeith IG, Dickson DW, Lowe J, et al. Diagnosis and management of dementia with Lewy bodies: third report of the DLB consortium. Neurology 2005; 65:1863–1872. - PubMed
-
- Alzheimer’s Association 2017 Alzheimer’s disease facts and figures. J. Alzheimers Dis 2017; 13:325–373.
-
- Scheltens P, Fox N, Barkhof F, De Carli C. Structural magnetic resonance imaging in the practical assessment of dementia: beyond exclusion. Lancet Neurol 2002; 1:13–21. - PubMed
-
- Karas GB, Burton EJ, Rombouts SA, et al. A comprehensive study of gray matter loss in patients with Alzheimer’s disease using optimized voxel-based morphometry. Neuroimage 2003; 18:895–907. - PubMed
-
- Shonk TK, Moats RA, Gifford P, et al. Probable Alzheimer disease: diagnosis with proton MR spectroscopy. Radiology 1995; 195:65–72. - PubMed