. 2018 Nov 30;9(1):5103.
doi: 10.1038/s41467-018-07461-x.

Adipocyte OGT governs diet-induced hyperphagia and obesity

Affiliations

Adipocyte OGT governs diet-induced hyperphagia and obesity

Min-Dian Li et al. Nat Commun. .

Abstract

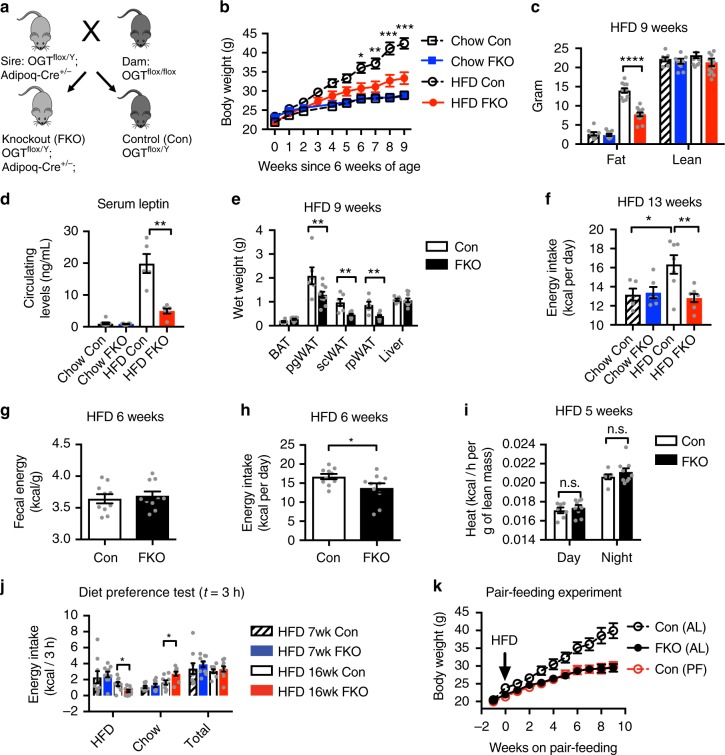
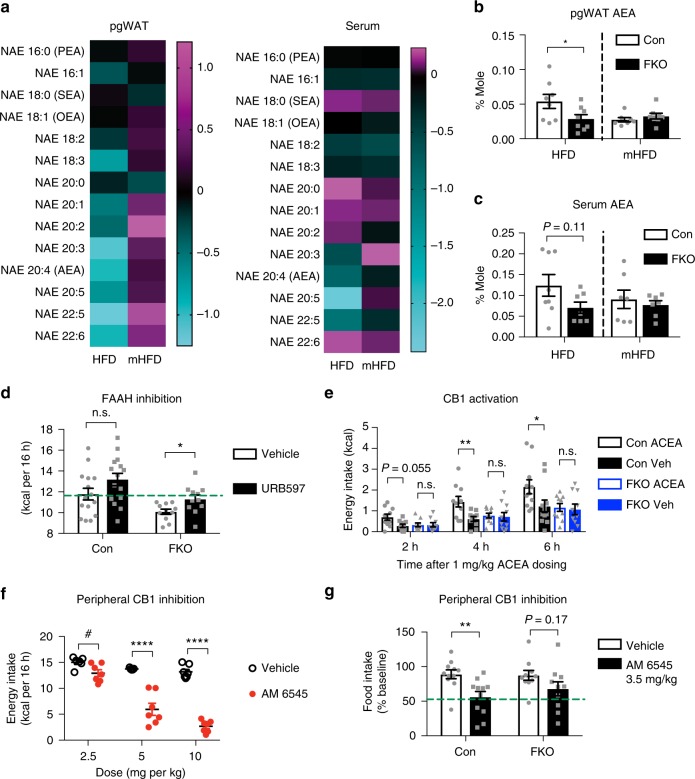
Palatable foods (fat and sweet) induce hyperphagia, and facilitate the development of obesity. Whether and how overnutrition increases appetite through the adipose-to-brain axis is unclear. O-linked beta-D-N-acetylglucosamine (O-GlcNAc) transferase (OGT) couples nutrient cues to O-GlcNAcylation of intracellular proteins at serine/threonine residues. Chronic dysregulation of O-GlcNAc signaling contributes to metabolic diseases. Here we show that adipocyte OGT is essential for high fat diet-induced hyperphagia, but is dispensable for baseline food intake. Adipocyte OGT stimulates hyperphagia by transcriptional activation of de novo lipid desaturation and accumulation of N-arachidonyl ethanolamine (AEA), an endogenous appetite-inducing cannabinoid (CB). Pharmacological manipulation of peripheral CB1 signaling regulates hyperphagia in an adipocyte OGT-dependent manner. These findings define adipocyte OGT as a fat sensor that regulates peripheral lipid signals, and uncover an unexpected adipose-to-brain axis to induce hyperphagia and obesity.


Conflict of interest statement

The authors declare no competing interests.

Figures

Fig. 1
Fig. 1
Adipocyte OGT drives diet-induced hyperphagia and obesity. a Genetic cross scheme. b Growth curves and c body composition of adipocyte-specific OGT knockout mice (FKO) and littermate control mice (Con) on chow (n = 8 (Con, dashed line with empty square/stripped bar) or 11 (FKO, blue line/bar)) or HFD (n = 11 (Con, dashed line with empty circle/empty bar) or 13 (FKO, red line/bar)). d Circulating levels of leptin and e wet tissue weights in male Con (n = 6) and FKO (n = 6) mice fed HFD for 9 weeks, or age-matched Con (n = 8) and FKO (n = 8) mice fed chow. BAT, interscapular brown adipose tissue. White adipose tissues include depots from perigonadal (pg), subcutaneous (sc), and retroperitoneal (rp) regions. f Energy intake of male mice on HFD (n = 7 per genotype) or Chow (n = 5 (Con) or n = 6 (FKO)) for 13 weeks. g Fecal energy content. h Daily energy intake. Male Con (n = 10) and FKO (n = 10) mice fed HFD for 6 weeks. i Energy expenditure of 5-week HFD-fed male Con (n = 7) and FKO (n = 9) mice. j Energy intake in a two-choice diet preference test. Male Con (n = 9) and FKO (n = 10) mice have been fed HFD for 7 or 16 weeks. k Growth curves of HFD-fed mice. Con (AL, ad libitum, n = 11), Con (PF, pair-fed to littermate FKO, n = 7), FKO (AL, n = 7). Data were presented as mean ± s.e.m. *P < 0.05, **P< 0.01, ***P< 0.001, ****P< 0.0001, post hoc Sidak’s tests (b (HFD Con vs. HFD FKO), i, k (Con PF vs. FKO AL)), Tukey’s tests (c, d, f), or two-tailed Student’s t-test (e, g, h, j)
Fig. 2
Fig. 2
Adipocyte OGT drives diet-induced insulin resistance through obesity. a Basal insulin levels, glucose levels, HOMA-IR values in male Con (n = 5) and FKO (n = 5) mice fed HFD for 11 weeks. b Serum levels of free fatty acids (FFA). Mean ± s.e.m.: 466.4 ± 6.4 μM (Con, n = 7) vs. 437.8 ± 7.5 μM (FKO, n = 7). c Blood glucose response to intraperitoneal insulin tolerance test in male Con (n = 5) and FKO (n = 5) mice fed HFD for 12 weeks. d, e Blood glucose (d) or blood insulin (e) response to intraperitoneal glucose tolerance test (GTT) in male Con (n = 5) and FKO (n = 5) mice fed HFD for 11 weeks. f Levels of triacylglycerol (TAG) and diacylglycerol (DAG) in livers of Con (n = 7) and FKO (n = 7) mice fed HFD for 22 weeks. g, h Blood glucose response to GTT (g), and basal insulin levels (h) in pair-fed (PF) Con (n = 7) and ad libitum (AL) FKO (n = 7) mice fed HFD for 9 weeks. Data were presented as mean ± s.e.m. *P < 0.05, **P< 0.01, two-tailed Student’s t-test (a, b, f, h), or post hoc Sidak’s tests (ce, g)
Fig. 3
Fig. 3
Transcriptomic and lipidomic analysis of adipose tissue from OGT FKO mice. a Pathway enrichment analysis of perigonadal white adipose tissue (pgWAT) from male Con (n = 5) and FKO (n = 3) mice fed HFD for 3 days. One hundred and thirty-four genes downregulated by OGT depletion were analyzed in the DAVID 7.8 platform. b Graph showing top 10 downregulated genes in adipose tissue. FC, fold-change of signals in FKO divided by signals in Con. c Heatmap of TAG lipid species in adipose tissue lipidome. Data were presented as log2 ratios of FKO/Con (Chow for 14–15 weeks, Con n = 11, FKO n = 6; age-matched HFD for 9 weeks, Con n = 7, FKO n = 8). d, e Content of major fatty acids in DAG and TAG in adipose tissue from chow-fed mice (n = 11 Con; n = 6 FKO), and lipid desaturation indexes (16:1/16:0, 18:1/18:0). f, g Heatmap (f) and Bar graphs (g) of the long-chain acyl-carnitine (CAR) profile of adipose tissue from mice described in panel (d, e). Data were presented as mean ± s.e.m. *P < 0.05, **P< 0.01, ***P < 0.001, ****P < 0.0001 two-tailed Student’s t-test (d, e), or post hoc Sidak’s multiple comparison test (f, g)
Fig. 4
Fig. 4
Adipocyte OGT drives diet-induced hyperphagia through transactivation of lipid desaturation in adipose tissue. a Gene expression analysis of de novo lipid desaturation and synthesis in adipose tissue (Chow for 15 weeks, Con n = 8, FKO n = 8; age-matched HFD for 9 weeks, Con n = 5, FKO n = 6). b Protein levels of SCD and OGT in adipose tissue. c Western blotting analysis in adipose tissue from 9-week-HFD-fed FKO and Con mice (Con n = 5, FKO n = 6, two representative biological replicates were shown). d Growth curves and e energy intake of (m)HFD-fed Con and FKO mice (n = 8–10 per group). mHFD denotes a mono-unsaturated fat-fortified high-fat diet that changes the saturated fat-rich soybean oil fraction into the mono-unsaturated fat-rich canola oil as illustrated in the diagram (d). f Contents of palmitate (C16:0) and palmitoleate (C16:1) DAG in adipose lipidome, and circulating levels of leptin (g), or of FGF21 (h) in mice fed HFD or mHFD for 15 weeks. Data were presented as mean ± s.e.m. n.s. not significant, *P < 0.05, **P< 0.01, ****P < 0.0001, post hoc Sidak’s tests (a, eh), or #P< 0.01 HFD Con vs. HFD FKO, two-tailed Student’s t-test (a). A dashed line in (eh) indicates that data from HFD study and mHFD study are presented in a side-by-side manner, and inference may not be made between different diets
Fig. 5
Fig. 5
Adipose tissue endocannabinoid metabolism mediates the appetite-inducing effect of OGT. a Heatmap of N-acylethanolamine (NAE) profiles in adipose tissue (pgWAT) and serum from mice (n = 8 per group) fed HFD or mHFD for 14–15 weeks. Data has been processed to follow Gaussian distribution. Each box represents the log2 ratio of FKO/WT. b, c Levels of AEA in adipose tissue (b) and serum (c) from mice described above. d Energy intake of mice (n = 15 or 11) fed HFD for 10–13 weeks and dosed with FAAH inhibitor URB597 (0.5 mg/kg). n.s. not significant, *P< 0.05, multiple t-tests adjusted by the Holm–Sidak method. e Energy intake of mice (n = 11 or 10) fed HFD for 12–14 weeks and dosed with CB1 agonist ACEA (1 mg/kg). Mice were dosed at 8:30–9:00 a.m., and measured at indicated time points. n.s. not significant, *P < 0.05, **P< 0.01, repeat-measure post hoc Sidak’s tests. f Energy intake of mice (n = 7 per group) fed HFD for 13 weeks dosed with peripheral CB1 receptor blocker AM 6545 as indicated. Data were presented as mean ± s.e.m. n.s. not significant, *P < 0.05, **P< 0.01, ****P< 0.0001, post hoc Sidak’s tests, or #P< 0.05, two-tailed Student’s t-test. g Food intake (% pre-injection baseline) of mice (n = 11 or 10) fed HFD for 10–11 weeks and dosed with CB1 antagonist AM 6545 (3.5 mg/kg). **P< 0.01, repeat-measure post hoc Sidak’s tests. A dashed line in (b, c) indicates that data from HFD study and mHFD study are presented in a side-by-side manner, and inference may not be made between different diets
Fig. 6
Fig. 6
A working model for appetite regulation in obesity. The fat-sensing adipose tissue-to-brain axis induces hyperphagia when palatable foods are available. This appetite-inducing axis in adipose tissue is activated by the fat-sensing module OGT, which trans-activates expression of the lipid desaturation module SCD. SCD facilitates the accumulation of the appetite-inducing module AEA, which activates peripheral CB1 signaling to induce hyperphagia

References

    1. Ochner CN, Barrios DM, Lee CD, Pi-Sunyer FX. Biological mechanisms that promote weight regain following weight loss in obese humans. Physiol. Behav. 2013;120:106–113. doi: 10.1016/j.physbeh.2013.07.009. - DOI - PMC - PubMed
    1. Leibel RL, et al. Biologic responses to weight loss and weight regain: report from an American Diabetes Association Research Symposium. Diabetes. 2015;64:2299–2309. doi: 10.2337/db15-0004. - DOI - PubMed
    1. Dietrich MO, Horvath TL. Limitations in anti-obesity drug development: the critical role of hunger-promoting neurons. Nat. Rev. Drug. Discov. 2012;11:675–691. doi: 10.1038/nrd3739. - DOI - PubMed
    1. Dietrich MO, et al. Agrp neurons mediate Sirt1’s action on the melanocortin system and energy balance: roles for Sirt1 in neuronal firing and synaptic plasticity. J. Neurosci.: Off. J. Soc. Neurosci. 2010;30:11815–11825. doi: 10.1523/JNEUROSCI.2234-10.2010. - DOI - PMC - PubMed
    1. Cota D, et al. Hypothalamic mTOR signaling regulates food intake. Science. 2006;312:927–930. doi: 10.1126/science.1124147. - DOI - PubMed

Publication types