. 2018 Nov 30;9(1):5111.
doi: 10.1038/s41467-018-07676-y.

Subcellular connectomic analyses of energy networks in striated muscle

Affiliations

Subcellular connectomic analyses of energy networks in striated muscle

Christopher K E Bleck et al. Nat Commun. .

Abstract

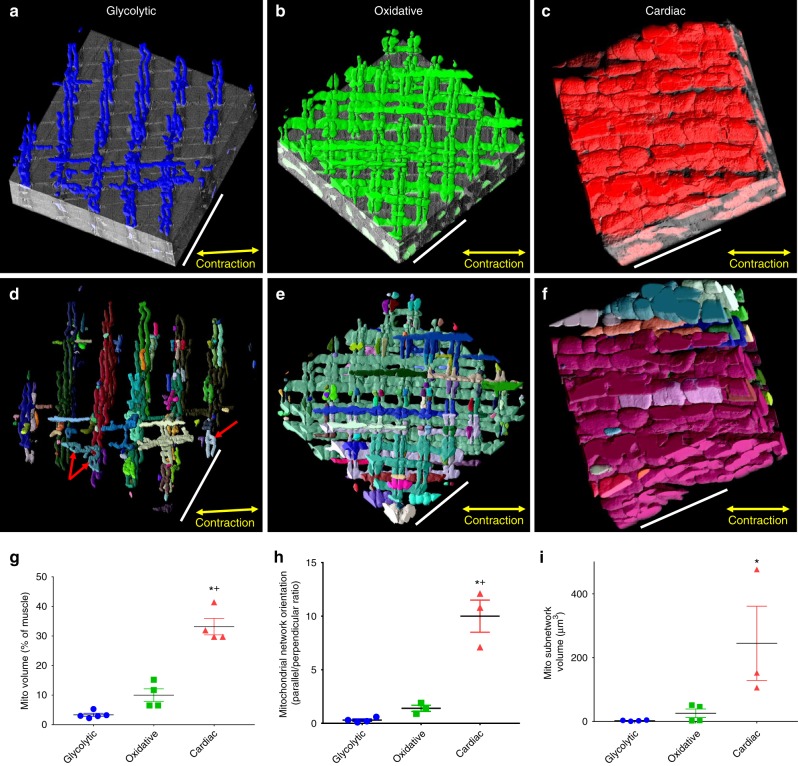
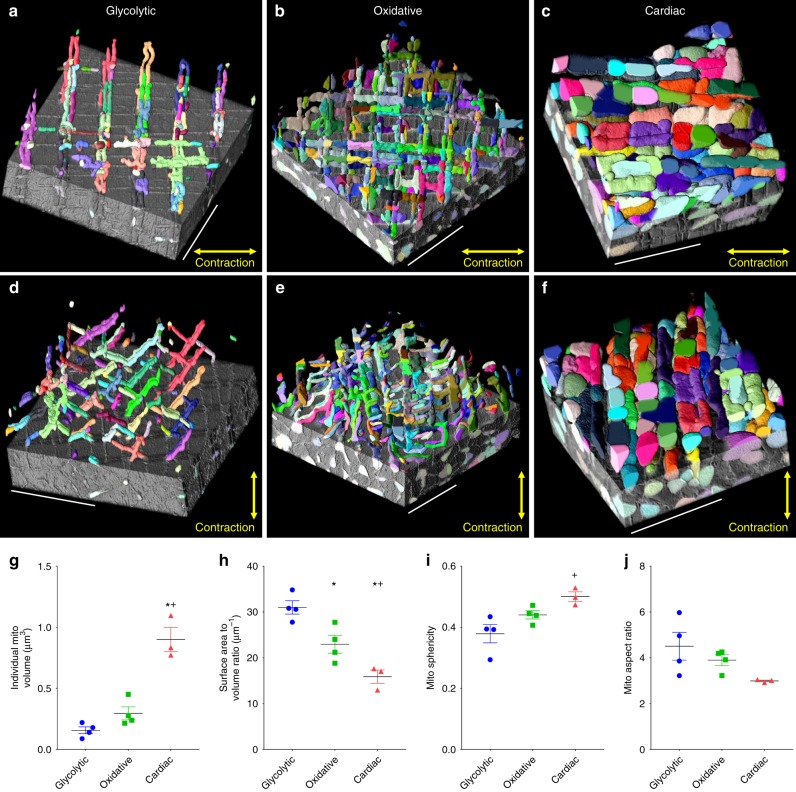
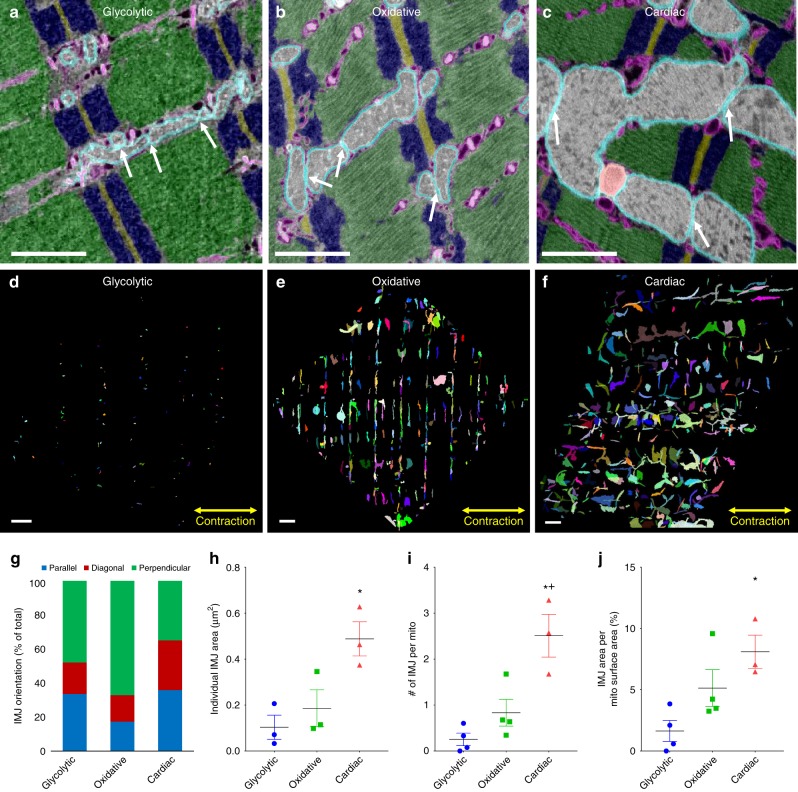
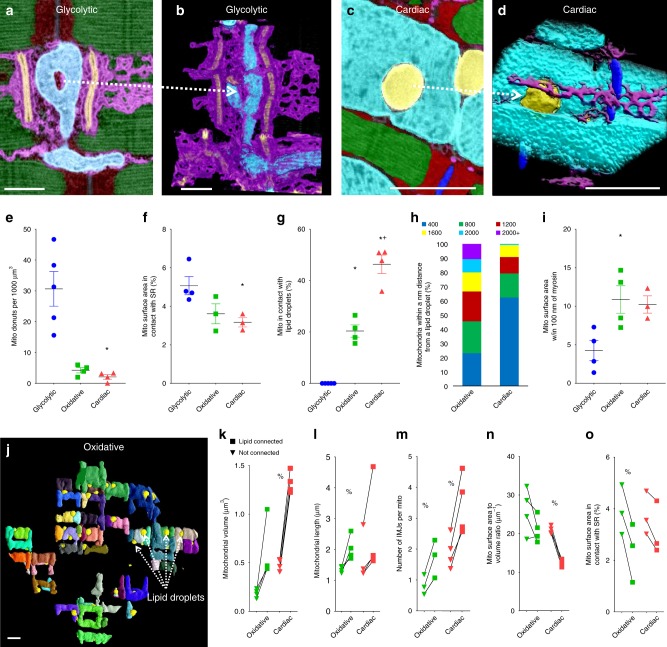
Mapping biological circuit connectivity has revolutionized our understanding of structure-function relationships. Although connectomic analyses have primarily focused on neural systems, electrical connectivity within muscle mitochondrial networks was recently demonstrated to provide a rapid mechanism for cellular energy distribution. However, tools to evaluate organelle connectivity with high spatial fidelity within single cells are currently lacking. Here, we developed a framework to quantitatively assess mitochondrial network connectivity and interactions with cellular sites of energy storage, utilization, and calcium cycling in cardiac, oxidative, and glycolytic muscle. We demonstrate that mitochondrial network configuration, individual mitochondrial size and shape, and the junctions connecting mitochondria within each network are consistent with the differing contraction demands of each muscle type. Moreover, mitochondria-lipid droplet interaction analyses suggest that individual mitochondria within networks may play specialized roles regarding energy distribution and calcium cycling within the cell and reveal the power of connectomic analyses of organelle interactions within single cells.


Conflict of interest statement

The authors declare no competing interests.

Figures

Fig. 1
Fig. 1
Mitochondrial network connectivity depends on muscle fiber type. a 3D rendering of perpendicularly oriented glycolytic muscle mitochondrial network partially overlaid on raw serial block face scanning electron microscopy (SBF-SEM) data. b Grid-like oxidative muscle mitochondrial network partially overlaid on raw focused ion beam scanning electron microscopy (FIB-SEM) data. c Parallel cardiac muscle mitochondrial network partially overlaid on raw FIB-SEM data. d 3D rendering of connected subnetworks within the glycolytic muscle mitochondrial network. Each color represents a connected mitochondrial subnetwork. e Connected subnetworks within the oxidative muscle mitochondrial network. f Connected subnetworks within the cardiac muscle mitochondrial network. g Mitochondrial volume as a percent of total muscle volume. glycolytic, n = 5; oxidative, n = 4; cardiac, n = 4 datasets. h Quantification of mitochondrial network orientation. Dotted line represents parallel equal to perpendicular. glycolytic, n = 4; oxidative, n = 3; cardiac, n = 3. i Mitochondrial subnetwork volumes. glycolytic, n = 674 subnetworks, 4 datasets; oxidative, n = 1558 subnetworks, 4 datasets; cardiac, n = 522 subnetworks, 3 datasets. Points are means for each dataset. Bars represent muscle type overall mean ± SE. *Significantly different from glycolytic, +significantly different from oxidative. Significance determined as p < 0.05 from one way ANOVA with Tukey’s HSD (variances not different) or Dunn’s multiple comparisons (variances different) post hoc tests. Scale bars – 5 µm
Fig. 2
Fig. 2
Individual network components are tuned to meet cellular goals. a 3D rendering of individual glycolytic muscle mitochondria partially overlaid on raw data. Each color represents an individual mitochondrion. b Individual oxidative muscle mitochondria. c Individual cardiac muscle mitochondria. df 90° rotation of ac. g Individual mitochondrial volumes. h Mitochondrial surface area to volume ratios. i Mitochondrial sphericities. j Mitochondrial aspect ratios. glycolytic, n = 1336 mitochondria, 4 datasets; oxidative, n = 2623 mitochondria, 4 datasets; cardiac, n = 1890 mitochondria, 3 datasets. Points are means for each dataset. Bars represent muscle type overall mean ± SE. *Significantly different from glycolytic, +significantly different from oxidative. Significance determined as p < 0.05 from one way ANOVA with Tukey’s HSD (variances not different) or Dunn’s multiple comparisons (variances different) post hoc tests. Scale bars – 5 µm
Fig. 3
Fig. 3
Intermitochondrial junction morphology varies by muscle type. a Overlay of raw and segmented single image from glycolytic muscle SBF-SEM volume highlighting intermitochondrial junctions (IMJs, white arrows). Outer mitochondrial membrane – cyan, mitochondrial interior – gray, sarcoplasmic reticulum and t-tubules – magenta, z-disks – brown, I-bands – blue, A-bands – green. b Segmented and raw single image from oxidative muscle FIB-SEM volume highlighting IMJs. c Segmented and raw single image from cardiac muscle FIB-SEM volume highlighting IMJs. df Maximum projections of all glycolytic (d), oxidative (e), and cardiac (f) muscle IMJs. g Quantification of IMJ orientation. h Individual IMJ sizes. glycolytic, n = 170 IMJs, 3 datasets; oxidative, n = 952 IMJs, 3 datasets; cardiac, n = 2403 IMJs, 3 datasets. i Number of IMJs per mitochondria. glycolytic, n = 1336 mitochondria, 4 datasets; oxidative, n = 2623 mitochondria, 4 datasets; cardiac, n = 1890 mitochondria, 3 datasets. h IMJ Area per mitochondrial surface area. glycolytic, n = 1336 mitochondria, 4 datasets; oxidative, n = 2623 mitochondria, 4 datasets; cardiac, n = 1890 mitochondria, 3 datasets. Points are means for each dataset. Bars represent muscle type overall mean ± SE. *Significantly different from glycolytic, +significantly different from oxidative. Significance determined as p < 0.05 from one way ANOVA with Tukey’s HSD (variances not different) or Dunn’s multiple comparisons (variances different) post hoc tests. Scale bars – 1 µm
Fig. 4
Fig. 4
Individual mitochondria play specialized roles within the network. a Overlay of segmented and raw single image from glycolytic muscle FIB-SEM volume showing a mitochondrion (cyan) with a donut hole partially filled with sarcoplasmic reticulum (magenta). T-tubules – orange, z-disks – blue, I-band – red, A-band – green. b 3D rendering of the data in a showing only mitochondria, sarcoplasmic reticulum and t-tubules. c Overlay of segmented and raw single image from cardiac muscle FIB-SEM volume showing a mitochondrion with a donut hole completely filled with a lipid droplet (yellow). d 3D rendering of the data in c showing only mitochondria, sarcoplasmic reticulum, and lipid droplets. e Mitochondrial donuts per 1000 µm3 muscle volume. glycolytic, n = 144 donuts, 5 datasets; oxidative, n = 26 donuts, 4 datasets; cardiac, n = 26 donuts, 4 datasets. f Mitochondrial surface area in contact with sarcoplasmic reticulum. glycolytic, n = 637 mitochondria, 4 datasets; oxidative, n = 1488 mitochondria, 3 datasets; cardiac, n = 1019 mitochondria, 3 datasets. g Percentage of mitochondria in contact with lipid droplets. glycolytic, n = 720 mitochondria, 5 datasets; oxidative, n = 2410 mitochondria, 4 datasets; cardiac, n = 1462 mitochondria, 4 datasets. h Mitochondria within given distance from a lipid droplet. i Percentage of mitochondrial surface area within 100 nm of myosin. n = 637 mitochondria, 4 datasets; oxidative, n = 2410 mitochondria, 4 datasets; cardiac, n = 1019 mitochondria, 3 datasets. j 3D rendering of lipid-connected mitochondria in oxidative muscle. Mitochondria – various colors, lipid droplets – yellow. kn Mitochondrial volumes (k), surface area-to-volume ratios (l), lengths (m), and surface area in contact with sarcoplasmic reticulum (n) for lipid droplet-connected and non-connected mitochondria. oxidative, n = 2410 mitochondria, 4 datasets; cardiac, n = 1462 mitochondria, 4 datasets. Points are means for each dataset. Squares- lipid droplet connected, triangles – non-lipid droplet connected. Lines between points indicate paired values from within single dataset. Bars represent muscle type overall mean ± SE. *Significantly different from glycolytic, +significantly different from oxidative, %significantly different from lipid-connected. Significance determined as p < 0.05 from one way ANOVA with Tukey’s HSD (variances not different) or Dunn’s multiple comparisons (variances different) post hoc tests for fiber type differences, and for a paired t-test (normal distribution) or Wilcoxon signed rank test (not normal distribution) for lipid connected analyses. Scale bars – 1 µm

References

    1. Denk W, Horstmann H. Serial block-face scanning electron microscopy to reconstruct three-dimensional tissue nanostructure. PLoS Biol. 2004;2:e329. doi: 10.1371/journal.pbio.0020329. - DOI - PMC - PubMed
    1. Heymann JA, et al. Site-specific 3D imaging of cells and tissues with a dual beam microscope. J. Struct. Biol. 2006;155:63–73. doi: 10.1016/j.jsb.2006.03.006. - DOI - PMC - PubMed
    1. Schroter M, Paulsen O, Bullmore ET. Micro-connectomics: probing the organization of neuronal networks at the cellular scale. Nat. Rev. Neurosci. 2017;18:131–146. doi: 10.1038/nrn.2016.182. - DOI - PubMed
    1. Raffaello A, Mammucari C, Gherardi G, Rizzuto R. Calcium at the center of cell signaling: interplay between endoplasmic reticulum, mitochondria, and lysosomes. Trends Biochem. Sci. 2016;41:1035–1049. doi: 10.1016/j.tibs.2016.09.001. - DOI - PMC - PubMed
    1. Lewis SC, Uchiyama LF, Nunnari J. ER-mitochondria contacts couple mtDNA synthesis with mitochondrial division in human cells. Science. 2016;353:aaf5549. doi: 10.1126/science.aaf5549. - DOI - PMC - PubMed

Publication types