. 2018 Dec;15(12):1053-1058.
doi: 10.1038/s41592-018-0229-2. Epub 2018 Nov 30.

Deep generative modeling for single-cell transcriptomics

Affiliations

Deep generative modeling for single-cell transcriptomics

Romain Lopez et al. Nat Methods. 2018 Dec.

Abstract

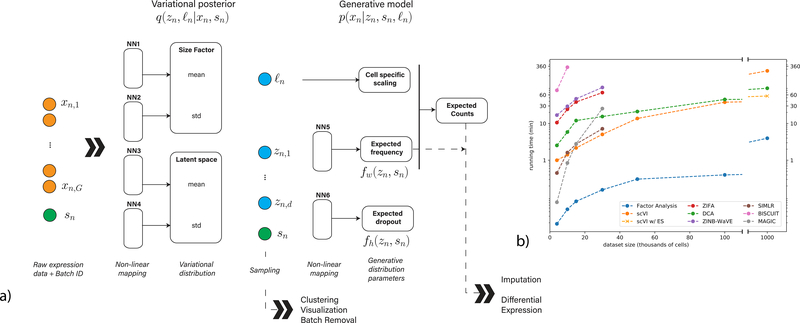
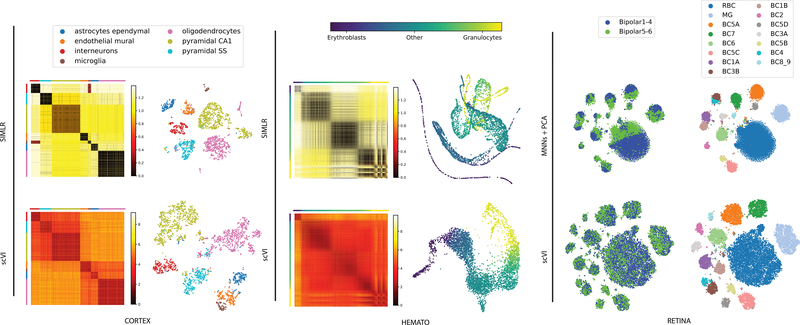
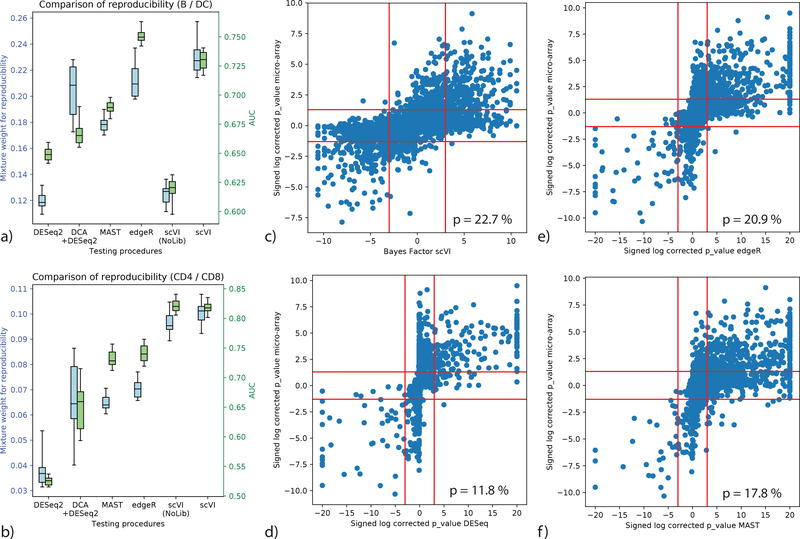
Single-cell transcriptome measurements can reveal unexplored biological diversity, but they suffer from technical noise and bias that must be modeled to account for the resulting uncertainty in downstream analyses. Here we introduce single-cell variational inference (scVI), a ready-to-use scalable framework for the probabilistic representation and analysis of gene expression in single cells ( https://github.com/YosefLab/scVI ). scVI uses stochastic optimization and deep neural networks to aggregate information across similar cells and genes and to approximate the distributions that underlie observed expression values, while accounting for batch effects and limited sensitivity. We used scVI for a range of fundamental analysis tasks including batch correction, visualization, clustering, and differential expression, and achieved high accuracy for each task.


Conflict of interest statement

Competing interests

The authors declare no competing interests.

Figures

Figure 1:
Figure 1:
Overview of scVI. Given a gene-expression matrix with batch annotations as input, scVI learns a non-linear embedding of the cells that can be used for multiple analysis tasks. (a) The computational trees (neural networks) used to compute the embedding as well as the distribution of gene expression. (b) Comparison of running times (y-axis) on the BRAIN-LARGE data with a limited set of 720 genes, and with increasing input sizes (x-axis; cells in each input set are sampled randomly from the complete dataset). All the algorithms were tested on a machine with one eight-core Intel i7–6820HQ CPU addressing 32 GB RAM, and one NVIDIA Tesla K80 (GK210GL) GPU addressing 24 GB RAM. scVI is compared against existing methods for dimensionality reduction in the scRNA-seq literature. As a control, we also add basic matrix factorization with factor analysis (FA). For the one-million-cell dataset only, we report the result of scVI with and without early stopping (ES).
Figure 2:
Figure 2:
Biological signal retained by the latent space of scVI. scVI is applied to three datasets (from right to left: CORTEX n = 3,005 cells, HEMATO n = 4,016 cells and RETINA n = 27,499 cells). For CORTEX and HEMATO, we compare scVI with SIMLR and show a distance matrix in the latent space, as well as a two-dimensional embedding of the cells. Distance matrices: the scales are in relative units from low to high similarity (over the range of values in the entire matrix). Cells in the matrices are grouped by their pre-annotated labels, provided by the original studies (for the CORTEX dataset, cell subsets were ordered using hierarchical clustering as in the original study). Embedding plots: each point represents a cell and the layout is determined either by tSNE for CORTEX or by a 5-nearest neighbors graph visualized using a Fruchterman-Reingold force-directed algorithm for HEMATO; see Supplementary Figure 10d for the original embedding for SIMLR. Color scheme in the embeddings is the same as in the distance matrices. For the RETINA dataset, we compare scVI with MNNs followed by PCA. Embedding plots were generated by applying tSNE on the respective latent space. On the left, the cells are colored by batch. On the right, cells are colored by the annotation of subpopulations, provided in the original study [31].
Figure 3:
Figure 3:
Benchmark of differential expression analysis using the PBMC dataset (n = 12,039 cells), based on consistency with published bulk data. (a, b) Evaluation of consistency with the irreproducible discovery rate (IDR) [41] framework (blue) and using AUROC (green) is shown for comparisons of B cells vs Dendritic cells (a) and CD4 vs CD8 T cells (b). Error bars are obtained by sub-sampling a hundred cell from each clusters n = 20 times to show robustness. Box plots indicate the median (center lines), interquantile range (hinges) and 5–95th percentiles (whiskers). (c,d,e,f): correlation of significance levels of differential expression of B cells vs Dendritic cells, comparing bulk data and single cell. Points are individual genes (n = 3,346). Bayes factors or BH-corrected p-values on scRNA-seq data are presented on the x-axis; microarray-based BH-corrected p-values are depicted on the y-axis. Horizontal bars denote significance threshold of 0.05 for corrected p-values. Vertical bars denote significance threshold for the Bayes factor of scVI (c) or 0.05 for corrected p-values for DESeq2 (d), edgeR (e), and MAST (f). We also report the median mixture weight for reproducibility p (higher is better).

Comment in

References

    1. Semrau S et al. Dynamics of lineage commitment revealed by single-cell transcriptomics of differentiating embryonic stem cells. Nature Communications 8, 1096 (2017). - PMC - PubMed
    1. Gaublomme JT, Yosef N, Lee Y, Gertner RS et al. Single-cell genomics unveils critical regulators of Th17 cell pathogenicity. Cell 163, 1400–1412 (2015). - PMC - PubMed
    1. Patel AP et al. Single-cell RNA-seq highlights intratumoral heterogeneity in primary glioblastoma. Science 344, 1396–1401 (2014). - PMC - PubMed
    1. Kharchenko PV, Silberstein L & Scadden DT Bayesian approach to single-cell differential expression analysis. Nature Methods 11, 740–742 (2014). - PMC - PubMed
    1. Vallejos CA, Risso D, Scialdone A, Dudoit S & Marioni JC Normalizing single-cell RNA sequencing data: challenges and opportunities. Nature Methods 565–571 (2017). - PMC - PubMed

Publication types