

TUSKEGEE AND THE HEALTH OF BLACK MEN
- PMID: 30505005
- PMCID: PMC6258045
- DOI: 10.1093/qje/qjx029
TUSKEGEE AND THE HEALTH OF BLACK MEN
Abstract
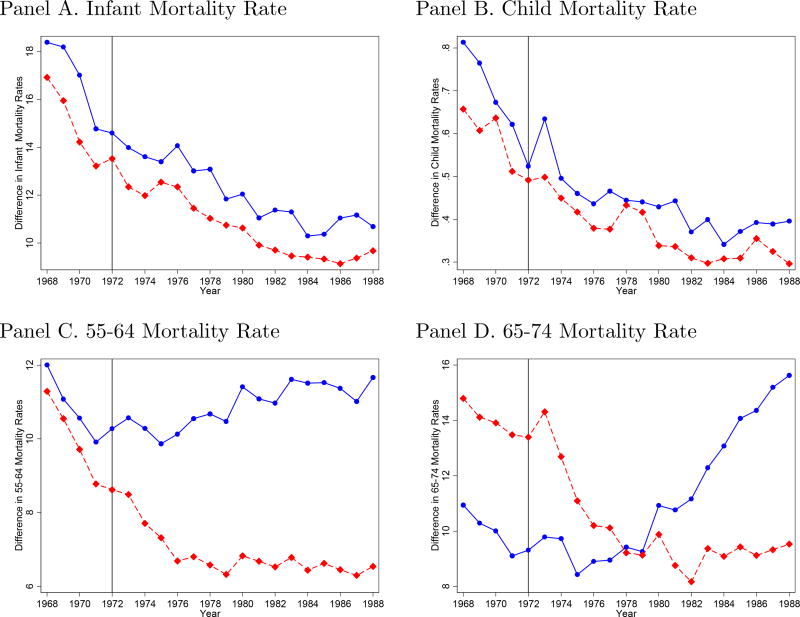
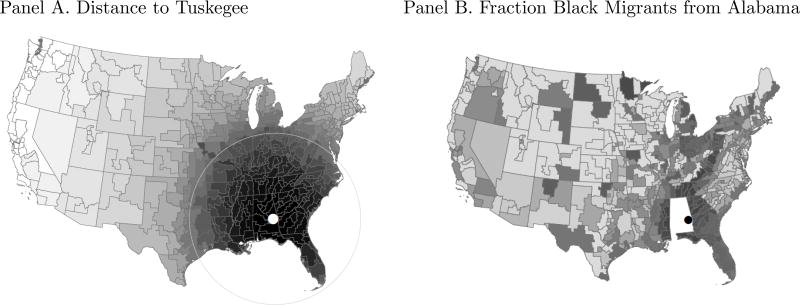
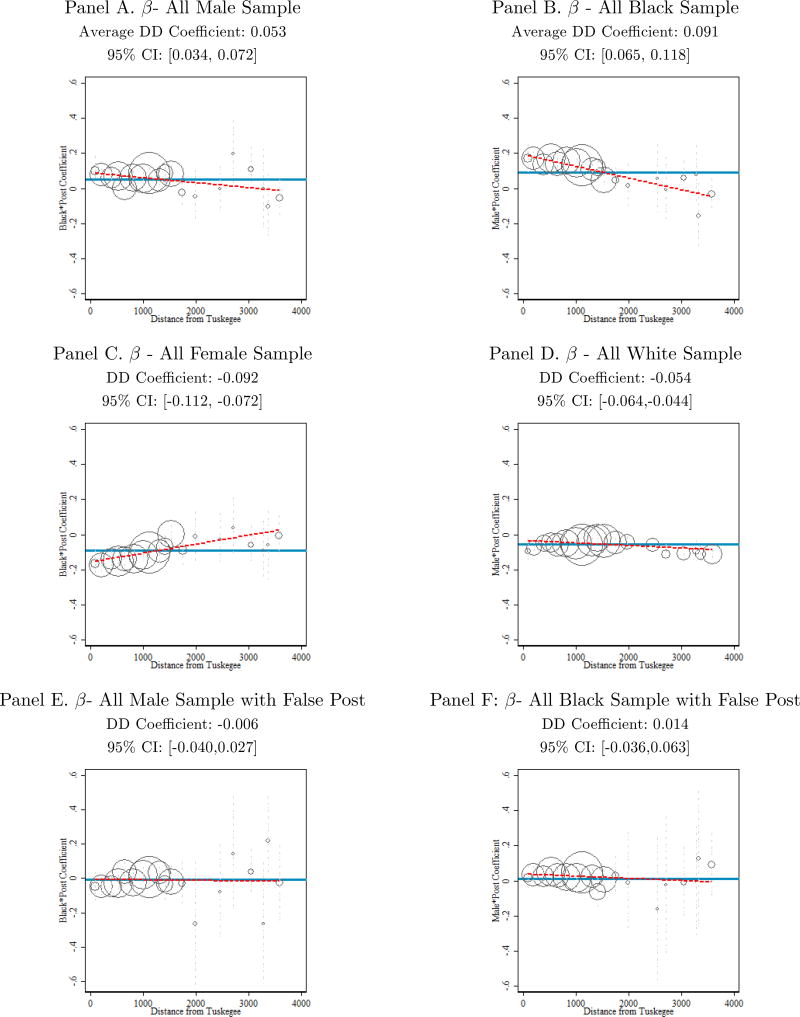
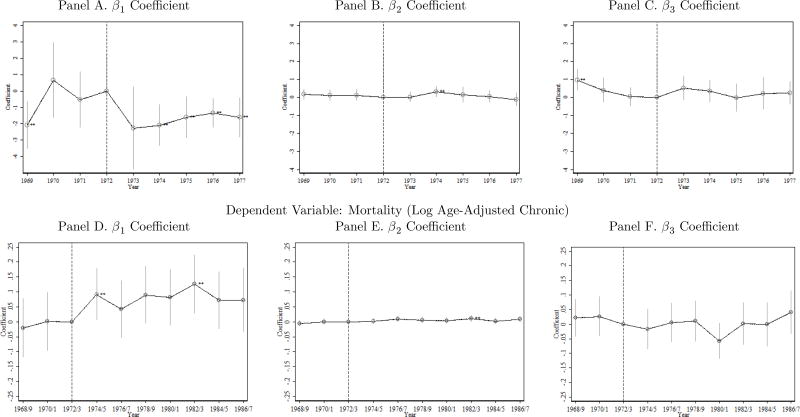
JEL Codes: I14, O15 For forty years, the Tuskegee Study of Untreated Syphilis in the Negro Male passively monitored hundreds of adult black males with syphilis despite the availability of effective treatment. The study's methods have become synonymous with exploitation and mistreatment by the medical profession. To identify the study's effects on the behavior and health of older black men, we use an interacted difference-in-difference-in-differences model, comparing older black men to other demographic groups, before and after the Tuskegee revelation, in varying proximity to the study's victims. We find that the disclosure of the study in 1972 is correlated with increases in medical mistrust and mortality and decreases in both outpatient and inpatient physician interactions for older black men. Our estimates imply life expectancy at age 45 for black men fell by up to 1.5 years in response to the disclosure, accounting for approximately 35% of the 1980 life expectancy gap between black and white men and 25% of the gap between black men and women.
Figures
Similar articles
-
Misinformation and misbeliefs in the Tuskegee Study of Untreated Syphilis fuel mistrust in the healthcare system.J Natl Med Assoc. 2005 Nov;97(11):1566-73. J Natl Med Assoc. 2005. PMID: 16334509 Free PMC article.
-
The legacy of Tuskegee and trust in medical care: is Tuskegee responsible for race differences in mistrust of medical care?J Natl Med Assoc. 2005 Jul;97(7):951-6. J Natl Med Assoc. 2005. PMID: 16080664 Free PMC article.
-
The Tuskegee Study of Untreated Syphilis: A Case Study in Peripheral Trauma with Implications for Health Professionals.J Gen Intern Med. 2020 Jan;35(1):322-325. doi: 10.1007/s11606-019-05309-8. Epub 2019 Oct 23. J Gen Intern Med. 2020. PMID: 31646456 Free PMC article.
-
Under the shadow of Tuskegee: African Americans and health care.Am J Public Health. 1997 Nov;87(11):1773-8. doi: 10.2105/ajph.87.11.1773. Am J Public Health. 1997. PMID: 9366634 Free PMC article. Review.
-
Unraveling the Tuskegee Study of Untreated Syphilis.Arch Intern Med. 2000 Mar 13;160(5):585-98. doi: 10.1001/archinte.160.5.585. Arch Intern Med. 2000. PMID: 10724044 Review. No abstract available.
Cited by
-
Sociodemographic and geographic disparities in excess fatal drug overdoses during the COVID-19 pandemic in California: A population-based study.Lancet Reg Health Am. 2022 Jul;11:100237. doi: 10.1016/j.lana.2022.100237. Epub 2022 Mar 19. Lancet Reg Health Am. 2022. PMID: 35342895 Free PMC article.
-
Ebola and the narrative of mistrust.BMJ Glob Health. 2019 Dec 19;4(6):e001932. doi: 10.1136/bmjgh-2019-001932. eCollection 2019. BMJ Glob Health. 2019. PMID: 31908869 Free PMC article. No abstract available.
-
New evidence on geographic disparities in United States hospital capacity.Health Serv Res. 2022 Oct;57(5):1006-1019. doi: 10.1111/1475-6773.14010. Epub 2022 Jun 7. Health Serv Res. 2022. PMID: 35593121 Free PMC article.
-
COVID-19 Vaccine Intentions and Mistrust in a National Sample of Black Americans.J Natl Med Assoc. 2022 Jan;113(6):599-611. doi: 10.1016/j.jnma.2021.05.011. Epub 2021 Jun 20. J Natl Med Assoc. 2022. PMID: 34158171 Free PMC article.
-
Examine Race/Ethnicity Disparities in Perception, Intention, and Screening of Dementia in a Community Setting: Scoping Review.Int J Environ Res Public Health. 2022 Jul 21;19(14):8865. doi: 10.3390/ijerph19148865. Int J Environ Res Public Health. 2022. PMID: 35886711 Free PMC article.
References
-
- ABC News/Washington Post. ABC News/The Washington Post: Los Angeles Race Riots [dataset] Cornell University, Ithaca, NY: Roper Center for Public Opinion Research; 1992. [Accessed August 2015].
-
- Adler Nancy, Boyce Thomas, Chesney Margaret A, Cohen Sheldon, Folkman Susan, Kahn Robert L, Syme S Leonard. Socioeconomic Inequalities in Health: No Easy Solution. Journal of the American Medical Association. 1993;269:124–163. - PubMed
-
- Aizer Anna, Stroud Laura. Education, Knowledge and the Evolution of Disparities in Health. NBER Working Paper No.15840. 2010
-
- Akerlof George, Yellen Janet, Katz Michael L. An Analysis of Out-of-Wedlock Childbearing in the United States. Quarterly Journal of Economics. 1996;111:377–317.
-
- Almond Douglas, Chay Kenneth Y, Greenstone Michael. Civil Rights, the War on Poverty and Black-White Convergence in Infant Mortality in the Rural South and Mississippi. MIT Working Paper Series No. 07-04. 2006
Grants and funding
LinkOut - more resources
Full Text Sources
Miscellaneous