

CREATING MEASURES OF THEORETICALLY RELEVANT NEIGHBORHOOD ATTRIBUTES AT MULTIPLE SPATIAL SCALES
- PMID: 30505041
- PMCID: PMC6261371
- DOI: 10.1177/0081175013516749
CREATING MEASURES OF THEORETICALLY RELEVANT NEIGHBORHOOD ATTRIBUTES AT MULTIPLE SPATIAL SCALES
Abstract
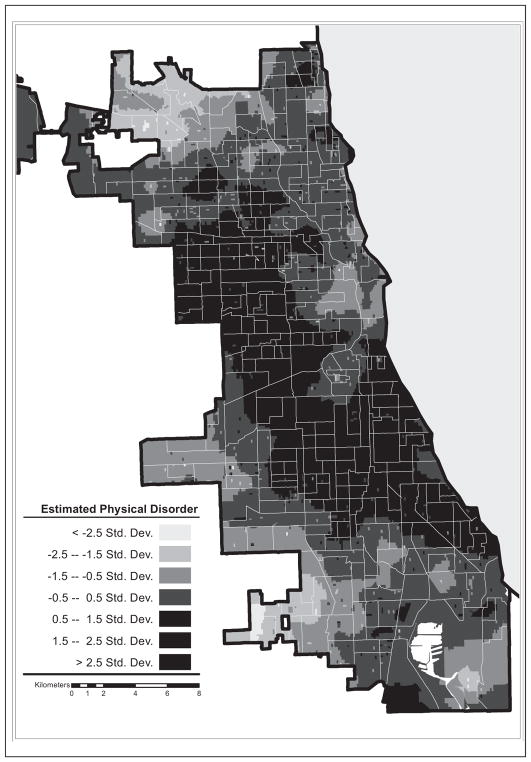
Accurately measuring attributes in neighborhood environments allows researchers to study the influence of neighborhoods on individual-level outcomes. Researchers working to improve the measurement of neighborhood attributes generally advocate doing so in one of two ways: improving the theoretical relevance of measures and correctly defining the appropriate spatial scale. The data required by the first, "ecometric" neighborhood assessments on a sample of neighborhoods, are generally incompatible with the methods of the second, which tend to rely on population data. In this article, the authors describe how ecometric measures of theoretically relevant attributes observed on a sample of city blocks can be combined with a geostatistical method known as kriging to develop city block-level estimates across a city that can be configured to multiple neighborhood definitions. Using a cross-validation study with data from a 2002 systematic social observation of physical disorder on 1,663 city blocks in Chicago, the authors show that this method creates valid results. They then demonstrate, using neighborhood measures aggregated to three different spatial scales, that residents' perceptions of both fear and neighborhood disorder vary substantially across different spatial scales.
Keywords: cross-validation; kriging; neighborhoods; physical disorder; spatial analysis; spatial scale.
Figures
References
-
- Bader Michael DM, Purciel Marnie, Yousefzadeh Paulette, Neckerman Kathryn M. Disparities in Neighborhood Food Environments: Implications of Measurement Strategies. Economic Geography. 2010;86(4):409–30. - PubMed
-
- Bailey Trevor C, Gatrell Anthony C. Interactive Spatial Data Analysis. New York: Longman Scientific & Technical; 1995.
-
- Basu Sabyasachi, Thibodeau Thomas G. Analysis of Spatial Autocorrelation in House Prices. Journal of Real Estate Finance and Economics. 1998;17(1):61–85.
-
- Bursik Robert, Grasmick Harold G. Neighborhoods and Crime: The Dimensions of Effective Community Control. New York: Lexington; 1993.
Grants and funding
LinkOut - more resources
Full Text Sources