Reduced Efficacy of d-Amphetamine and 3,4-Methylenedioxymethamphetamine in Inducing Hyperactivity in Mice Lacking the Postsynaptic Scaffolding Protein SHANK1
- PMID: 30505269
- PMCID: PMC6250831
- DOI: 10.3389/fnmol.2018.00419
Reduced Efficacy of d-Amphetamine and 3,4-Methylenedioxymethamphetamine in Inducing Hyperactivity in Mice Lacking the Postsynaptic Scaffolding Protein SHANK1
Abstract
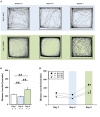
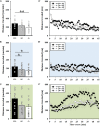
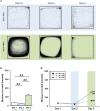
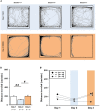
Genetic defects in the three SH3 and multiple ankyrin repeat domains (SHANK) genes (SHANK1, SHANK2, and SHANK3) are associated with multiple major neuropsychiatric disorders, including autism spectrum disorder (ASD), schizophrenia (SCZ), and bipolar disorder (BPD). Psychostimulant-induced hyperactivity is a commonly applied paradigm to assess behavioral phenotypes related to BPD and considered to be the gold standard for modeling mania-like elevated drive in mouse models. Therefore, the goal of our present study was to test whether Shank1 plays a role in the behavioral effects of psychostimulants and whether this is associated with genotype-dependent neurochemical alterations. To this aim, male and female null mutant Shank1-/- mice were treated with d-amphetamine (AMPH; 2.5 mg/kg) and 3,4-methylenedioxymethamphetamine (MDMA, commonly known as ecstasy; 20 mg/kg), and psychostimulant-induced hyperactivity was compared to heterozygous Shank1+/- and wildtype Shank1+/+ littermate controls. Results show that Shank1-/- mice display reduced psychostimulant-induced hyperactivity, although psychostimulants robustly stimulated locomotor activity in littermate controls. Shank1 deletion effects emerged throughout development, were particularly prominent in adulthood, and seen in response to both psychostimulants, i.e., AMPH and MDMA. Specifically, while AMPH-induced hyperactivity was reduced but still detectable in Shank1-/- mice, MDMA-induced hyperactivity was robustly blocked and completely absent in Shank1-/- mice. Reduced efficacy of psychostimulants to stimulate hyperactivity in Shank1-/- mice might be associated with alterations in the neurochemical architecture in prefrontal cortex, nucleus accumbens, and hypothalamus. Our observation that psychostimulant-induced hyperactivity is reduced rather than enhanced in Shank1-/- mice clearly speaks against a behavioral phenotype with relevance to BPD. Lack of BPD-like phenotype is consistent with currently available human data linking mutations in SHANK2 and SHANK3 but not SHANK1 to BPD.
Keywords: MDMA; dopamine; ecstasy; noradrenaline; norepinephrine; serotonin.
Figures



Similar articles
-
Repetitive behaviors in the Shank1 knockout mouse model for autism spectrum disorder: developmental aspects and effects of social context.J Neurosci Methods. 2014 Aug 30;234:92-100. doi: 10.1016/j.jneumeth.2014.05.003. Epub 2014 May 9. J Neurosci Methods. 2014. PMID: 24820912
-
Communication impairments in mice lacking Shank1: reduced levels of ultrasonic vocalizations and scent marking behavior.PLoS One. 2011;6(6):e20631. doi: 10.1371/journal.pone.0020631. Epub 2011 Jun 9. PLoS One. 2011. PMID: 21695253 Free PMC article.
-
Early communication deficits in the Shank1 knockout mouse model for autism spectrum disorder: Developmental aspects and effects of social context.Autism Res. 2016 Jun;9(6):696-709. doi: 10.1002/aur.1564. Epub 2015 Sep 30. Autism Res. 2016. PMID: 26419918
-
Behavioral phenotypes and neurobiological mechanisms in the Shank1 mouse model for autism spectrum disorder: A translational perspective.Behav Brain Res. 2018 Oct 15;352:46-61. doi: 10.1016/j.bbr.2017.09.038. Epub 2017 Sep 28. Behav Brain Res. 2018. PMID: 28963042 Review.
-
SHANK1 and autism spectrum disorders.Sci China Life Sci. 2015 Oct;58(10):985-90. doi: 10.1007/s11427-015-4892-6. Sci China Life Sci. 2015. PMID: 26335738 Review.
Cited by
-
The Central Noradrenergic System in Neurodevelopmental Disorders: Merging Experimental and Clinical Evidence.Int J Mol Sci. 2023 Mar 18;24(6):5805. doi: 10.3390/ijms24065805. Int J Mol Sci. 2023. PMID: 36982879 Free PMC article. Review.
-
Coordination among frequent genetic variants imparts substance use susceptibility and pathogenesis.Front Neurosci. 2024 Apr 10;18:1332419. doi: 10.3389/fnins.2024.1332419. eCollection 2024. Front Neurosci. 2024. PMID: 38660223 Free PMC article.
-
Association of SHANK Family with Neuropsychiatric Disorders: An Update on Genetic and Animal Model Discoveries.Cell Mol Neurobiol. 2022 Aug;42(6):1623-1643. doi: 10.1007/s10571-021-01054-x. Epub 2021 Feb 17. Cell Mol Neurobiol. 2022. PMID: 33595806 Free PMC article. Review.
-
Mood and behavior regulation: interaction of lithium and dopaminergic system.Naunyn Schmiedebergs Arch Pharmacol. 2023 Jul;396(7):1339-1359. doi: 10.1007/s00210-023-02437-1. Epub 2023 Feb 27. Naunyn Schmiedebergs Arch Pharmacol. 2023. PMID: 36843130 Review.
-
Simulated complexes formed from a set of postsynaptic proteins suggest a localised effect of a hypomorphic Shank mutation.BMC Neurosci. 2024 Jul 6;25(1):32. doi: 10.1186/s12868-024-00880-1. BMC Neurosci. 2024. PMID: 38971749 Free PMC article.
References
-
- Bengel D., Murphy D. L., Andrews A. M., Wichems C. H., Feltner D., Heils A., et al. (1998). Altered brain serotonin homeostasis and locomotor insensitivity to 3, 4-methylenedioxymethamphetamine (“Ecstasy”) in serotonin transporter-deficient mice. Mol. Pharmacol. 53 649–655. 10.1124/mol.53.4.649 - DOI - PubMed
LinkOut - more resources
Full Text Sources
Molecular Biology Databases

