. 2018 Nov 16:9:2736.
doi: 10.3389/fmicb.2018.02736. eCollection 2018.

Utilization of a Strongly Inducible DDI2 Promoter to Control Gene Expression in Saccharomyces cerevisiae

Affiliations

Utilization of a Strongly Inducible DDI2 Promoter to Control Gene Expression in Saccharomyces cerevisiae

Aiyang Lin et al. Front Microbiol. .

Abstract

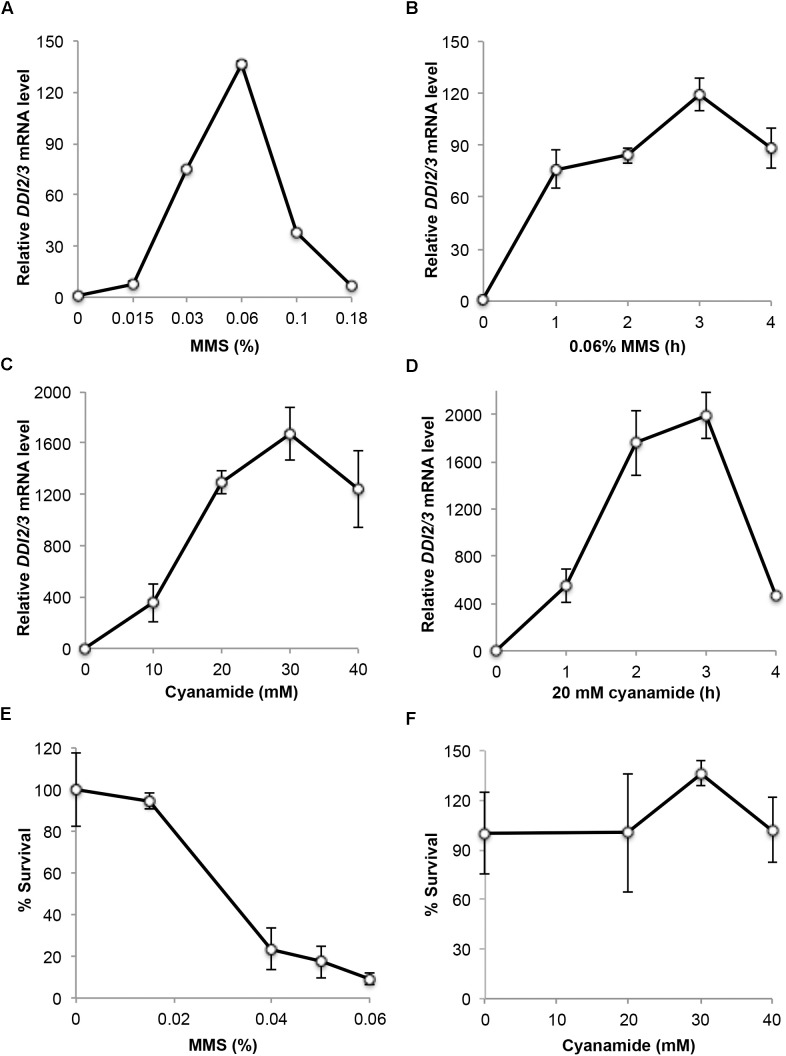
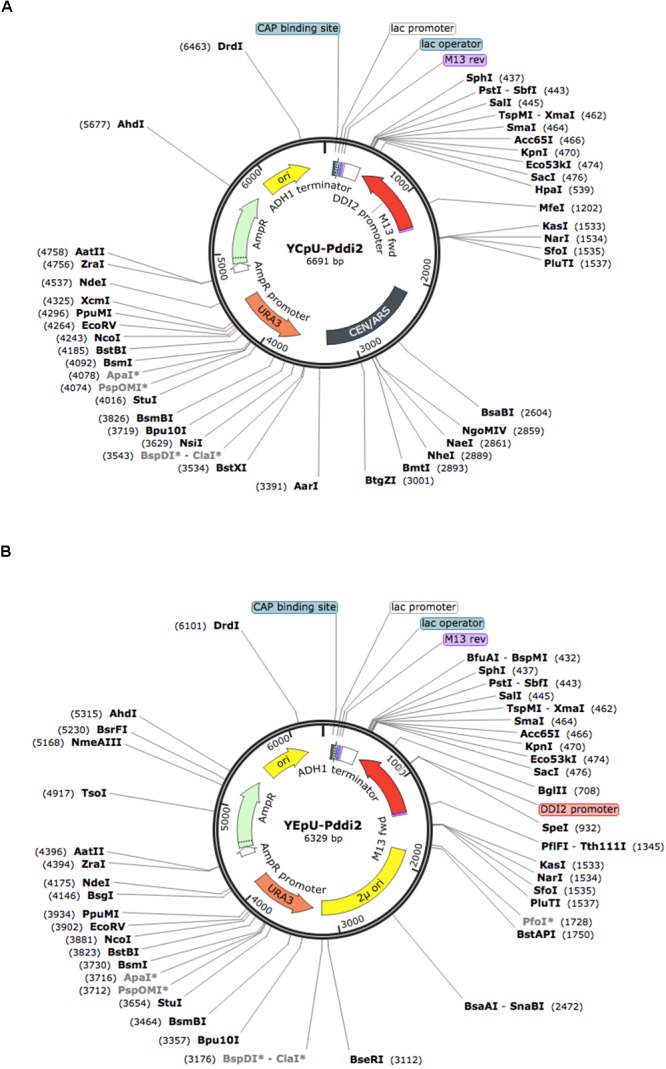
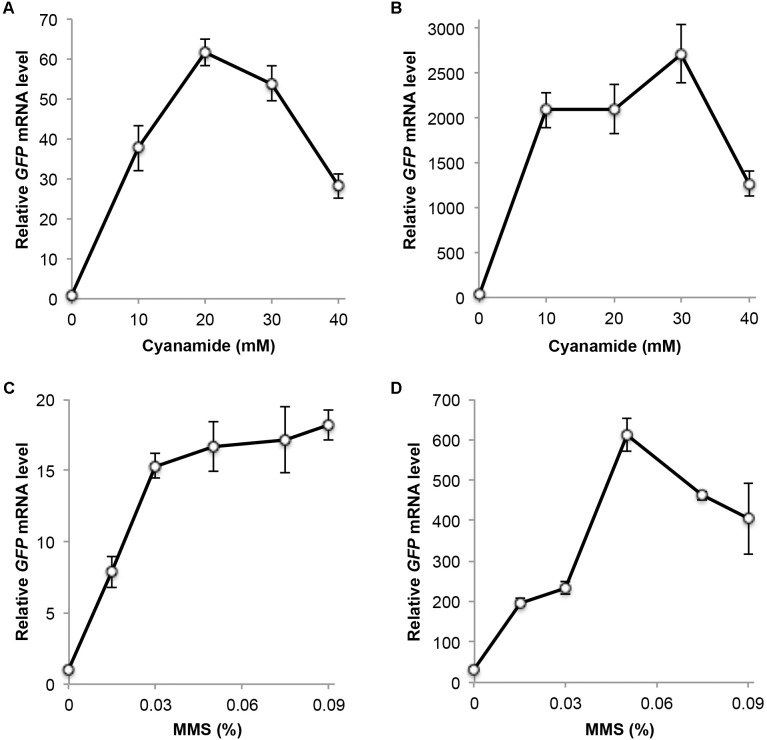
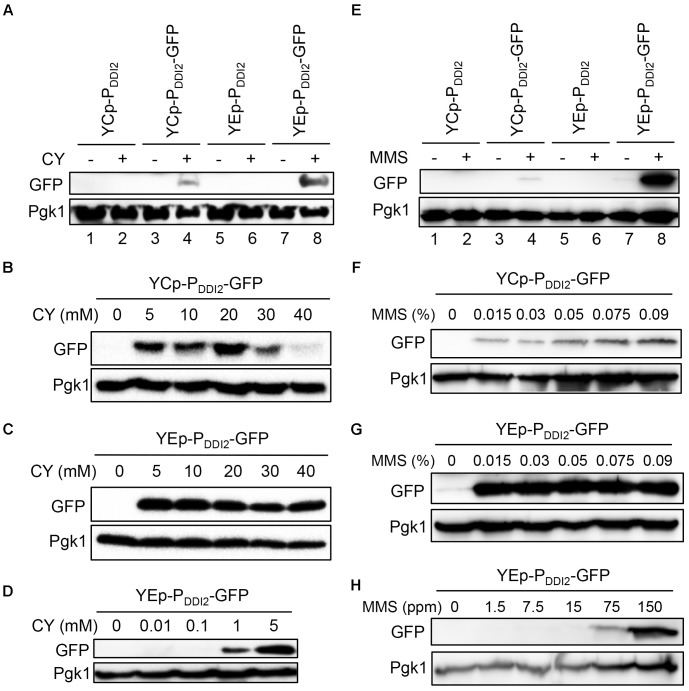
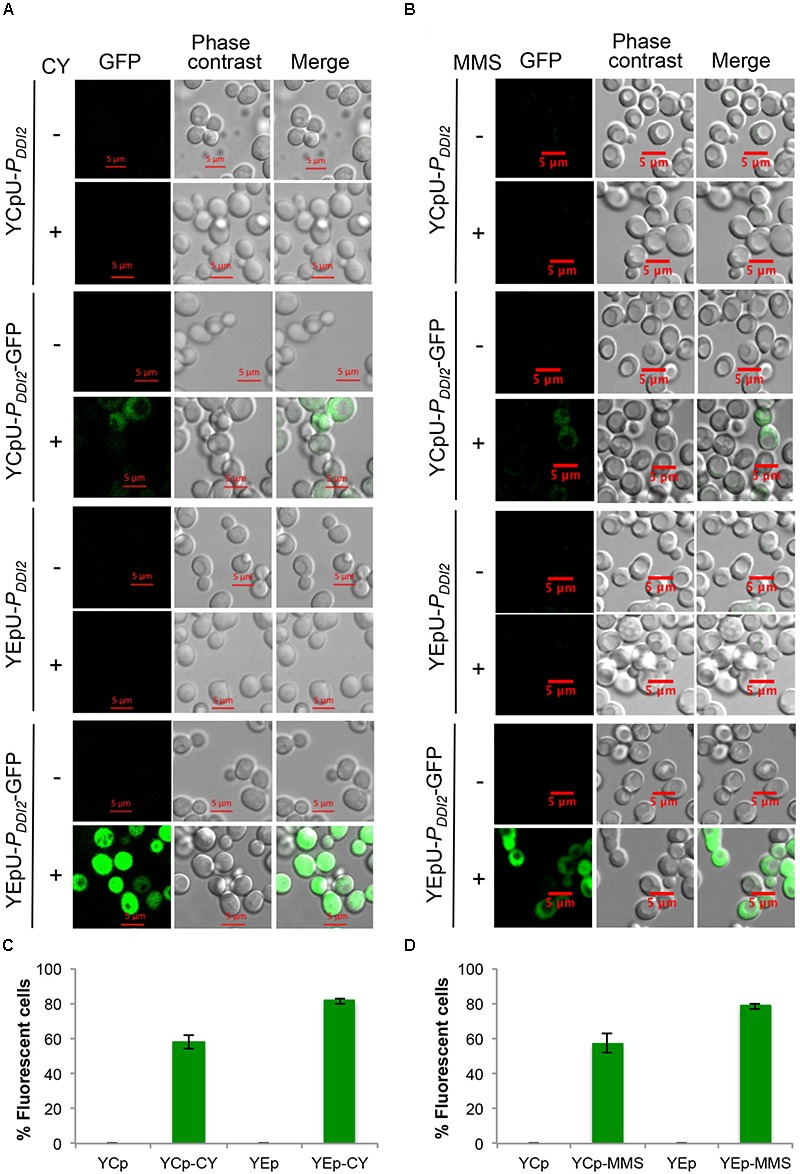
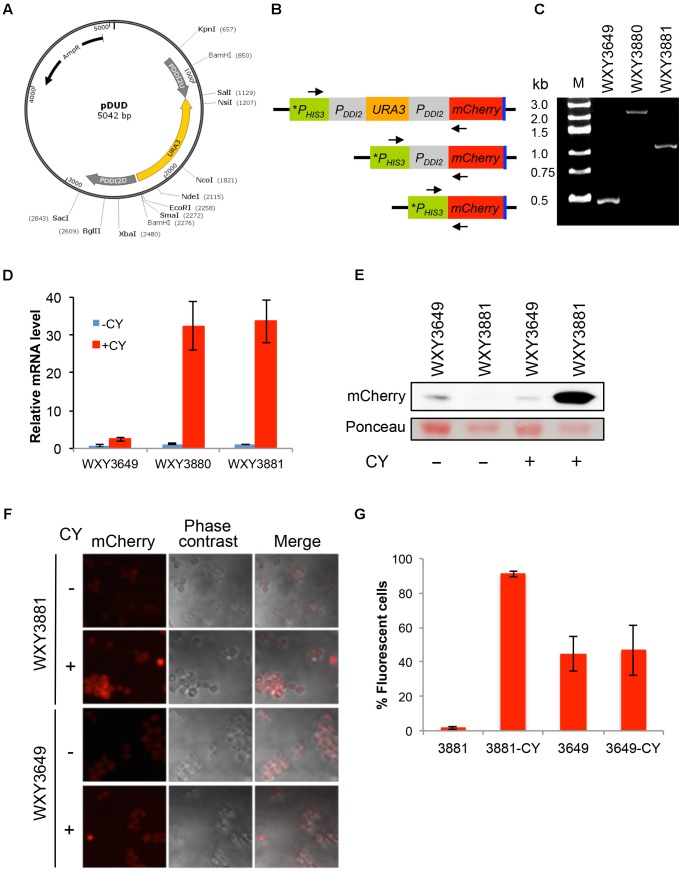
Regulating target gene expression is a common method in yeast research. In Saccharomyces cerevisiae, there are several widely used regulated expression systems, such as the GAL and Tet-off systems. However, all current expression systems possess some intrinsic deficiencies. We have previously reported that the DDI2 gene can be induced to very high levels upon cyanamide or methyl methanesulfonate treatment. Here we report the construction of gene expression systems based on the DDI2 promoter in both single- and multi-copy plasmids. Using GFP as a reporter gene, it was demonstrated that the target gene expression could be increased by up to 2,000-fold at the transcriptional level by utilizing the above systems. In addition, a DDI2-based construct was created for promoter shuffling in the budding yeast genome to control endogenous gene expression. Overall, this study offers a set of convenient and highly efficient experimental tools to control target gene expression in budding yeast.

Keywords: DDI2; Saccharomyces cerevisiae; cyanamide; promoter; transcriptional regulation.


Figures

FIGURE 1
FIGURE 1
Characterization of endogenous DDI2/3 gene expression and induction. (A–D) Endogenous DDI2/3 gene expression in BY4741 cells was measured by qRT-PCR with DDI2/3-specific primer pairs 5′-GTTGTTCCGCCTCCAAACAGTG-3′ and 5′-CTGCATAGTCCTGATTTCCACC-3′. The yeast UBC6 mRNA was used as an internal control (Teste et al., 2009). The relative DDI2/3 mRNA level with untreated cells in each experiment was set as 1. (A) Dose response to MMS treatment for 2 h. (B) Time course response to 0.06% MMS. (C) Dose response to CY treatment for 2 h. (D) Time course response to 20 mM CY. (E) Cell survival after MMS treatment at the given doses for 2 h. (F) Cell survival after CY treatment at the given doses for 2 h. All data are an average of at least three independent experiments with standard deviations shown as error bars.
FIGURE 2
FIGURE 2
Physical maps of plasmids YCpU-PDDI2 and YEpU-PDDI2. (A) A single-copy plasmid YCpU-PDDI2. (B) A high-copy plasmid YEpU-PDDI2. Functional regions are marked in the inner circle and restriction enzyme recognition sites are marked. The maps were drawn with SnapGene (GSL Biotech LLC).
FIGURE 3
FIGURE 3
Relative GFP transcript levels measured by qRT-PCR. (A) Cells harboring plasmid YCpU-PDDI2-GFP in response to CY treatment. (B) Cells harboring plasmid YEpU-PDDI2-GFP in response to CY treatment. (C) Cells harboring plasmid YCpU-PDDI2-GFP in response to MMS treatment. (D) Cells harboring plasmid YEpU-PDDI2-GFP in response to MMS treatment. qRT-PCR was performed as described in Section “Materials and Methods” with GFP-specific primer pairs 5′-TCCGTTCAACTAGCAGACCA-3′ and 5′-GCCATGTGTAATCCCAGCAG-3′. The yeast UBC6 mRNA was used as an internal control. The relative GFP mRNA level with untreated YCpU-PDDI2-GFP cells was set as 1. All data are an average of at least three independent experiments with standard deviations shown as error bars.
FIGURE 4
FIGURE 4
Western blot analysis of PDDI2-GFP gene products. (A) Cells harboring YCp- and YEp-based plasmids in response to 20 mM CY treatment. (B) Dose response of YCpU-PDDI2-GFP-transformed cells in response to CY. (C) Response of YEpU-PDDI2-GFP-transformed cells in response to high CY doses. (D) Response of YEpU-PDDI2-GFP-transformed cells in response to low CY doses. (E) Cells harboring YCp- and YEp-based plasmids in response to 0.015% MMS treatment. (F) Dose response of YCpU-PDDI2-GFP-transformed cells in response to MMS. (G) Response of YEpU-PDDI2-GFP-transformed cells in response to high MMS doses. (H) Response of YEpU-PDDI2-GFP-transformed cells in response to low MMS doses. The experimental protocol is described in Materials and Methods and all treatments were for 2 h. The anti-GFP monoclonal antibody B-2 was purchased from Santa Cruz (sc-9996) and the yeast anti-Pgk1 polyclonal antibody was a generous gift from Dr. W. Li (Institute of Zoology, Chinese Academy of Sciences, Beijing).
FIGURE 5
FIGURE 5
Fluorescent microscopic analysis of BY4741 transformants harboring PDDI2-GFP plasmids. (A) Representative images of cells with or without 20 mM CY treatment for 2 h. (B) Representative images of cells with or without 0.015% MMS treatment for 2 h. Plasmids are indicated on the left panel. (C,D) Quantitative analysis of percentage of fluorescent cells as shown in (A,B), respectively. Cells transformed with empty vectors without the GFP gene are all negative for fluorescence and the data are not shown in the graphs.
FIGURE 6
FIGURE 6
Construction and characterization of DDI2-based promoter shuffling. (A) The physical map of plasmid pDUD. The PDDI2U-URA3-PDDI2D cassette is shown in the inner circle. This cassette is used as a template to amplify a gene-specific cassette for yeast transformation. (B) Schematic diagram of pop-in and pop-out products at the PHIS3-mCherry locus in WXY3649. Arrows indicate forward and reverse primers 5′-TAGGAGTCACTGCCAGGTAT-3′ and 5′-TGCTTCACGTAGGCCTTGGAG-3′, respectively, used to perform genomic PCR to confirm the pop-in and pop-out products. (C) Agarose gel electrophoresis of genomic PCR products. Molecular size markers are indicated on the left. Predicted PCR product sizes are: WXY3649, 0.5 kb; WXY3880, 2.5 kb; WXY3881, 1.2 kb. (D) qRT-PCR analysis of mCherry expression in the pop-in (WXY3880) and pop-out (WXY3881) strains in response to 10 mM CY for 2 h. mCherry-specific primers are 5′-CAGACCGCCAAGCTGAAGGTGA-3′ and 5′-TCCCAGCCCATGGTCTTCTTCT-3′. The yeast ACT1 mRNA was used as an internal control. The relative mCherry mRNA level with untreated WXY3649 cells was set as 1. The data are an average of three independent experiments with standard deviations shown as error bars. (E) Western blot analysis of mCherry-Myc levels in the pop-out strain in response to 10 mM CY treatment for 2 h using an anti-c-Myc monoclonal antibody 9E10 (Sigma, M4439). Ponceau stain was used prior to the western blot to serve as a loading control. (F) Representative images of cells with or without 5 mM CY treatment for 2 h. (G) Quantitative analysis of percentage of fluorescent cells as shown in (F).

References

    1. Baron U., Bujard H. (2000). Tet repressor-based system for regulated gene expression in eukaryotic cells: principles and advances. Methods Enzymol. 327 401–421. 10.1016/S0076-6879(00)27292-3 - DOI - PubMed
    1. Berens C., Hillen W. (2003). Gene regulation by tetracyclines - constraints of resistance regulation in bacteria shape TetR for application in eukaryotes. Eur. J. Biochem. 270 3109–3121. 10.1046/j.1432-1033.2003.03694.x - DOI - PubMed
    1. Bertram R., Hillen W. (2008). The application of Tet repressor in prokaryotic gene regulation and expression. Microb. Biotechnol. 1 2–16. 10.1111/j.1751-7915.2007.00001.x - DOI - PMC - PubMed
    1. Botstein D., Fink G. R. (2011). Yeast: an experimental organism for 21st century biology. Genetics 189 695–704. 10.1534/genetics.111.130765 - DOI - PMC - PubMed
    1. Choi P. J., Cai L., Frieda K., Xie X. S. (2008). A stochastic single-molecule event triggers phenotype switching of a bacterial cell. Science 322 442–446. 10.1126/science.1161427 - DOI - PMC - PubMed

LinkOut - more resources