. 2018 Nov 16:9:2654.
doi: 10.3389/fimmu.2018.02654. eCollection 2018.

Functional Heterogeneity of CD4+ Tumor-Infiltrating Lymphocytes With a Resident Memory Phenotype in NSCLC

Affiliations

Functional Heterogeneity of CD4+ Tumor-Infiltrating Lymphocytes With a Resident Memory Phenotype in NSCLC

Anna E Oja et al. Front Immunol. .

Abstract

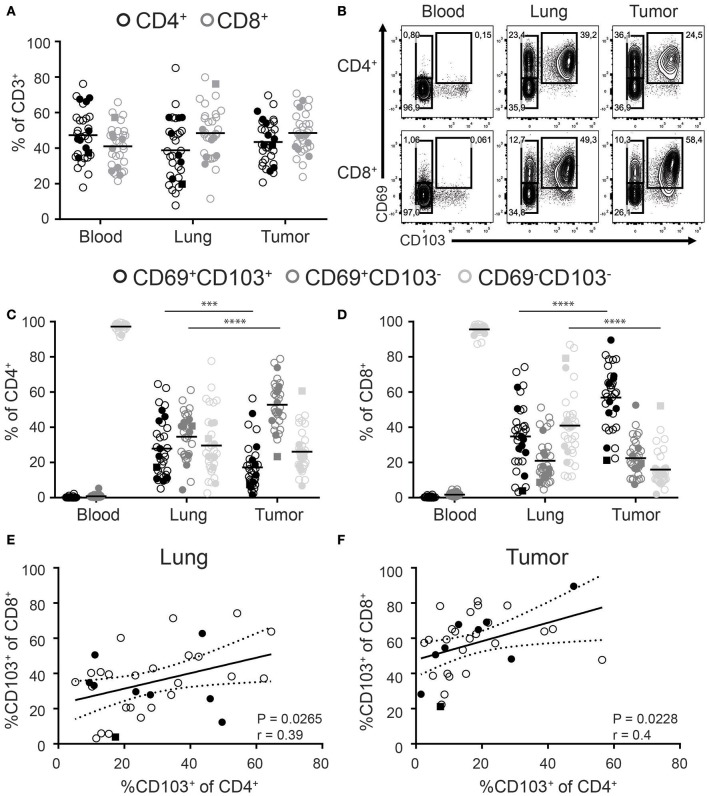
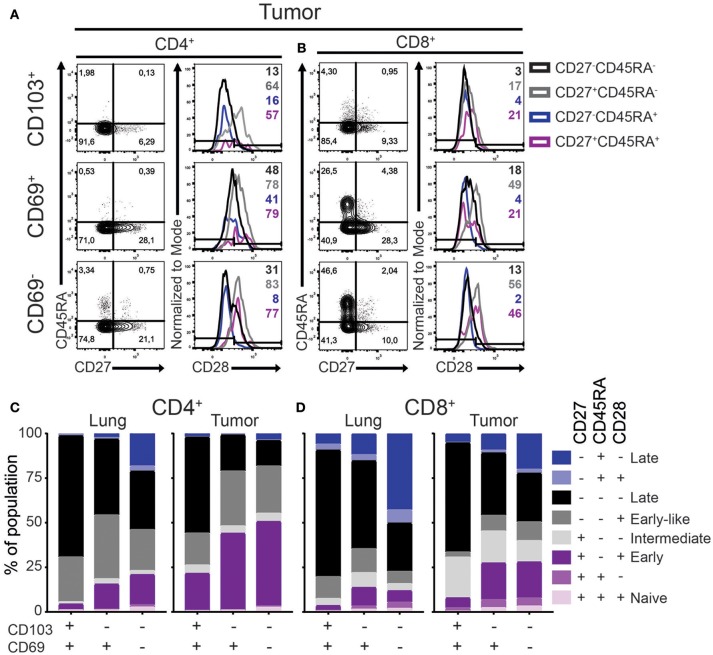
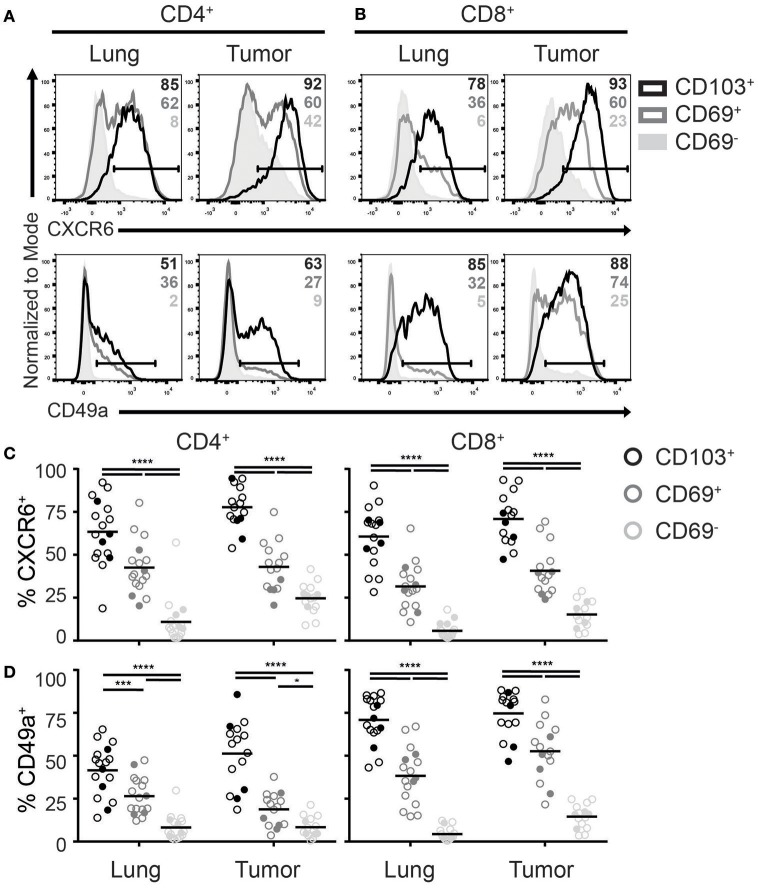
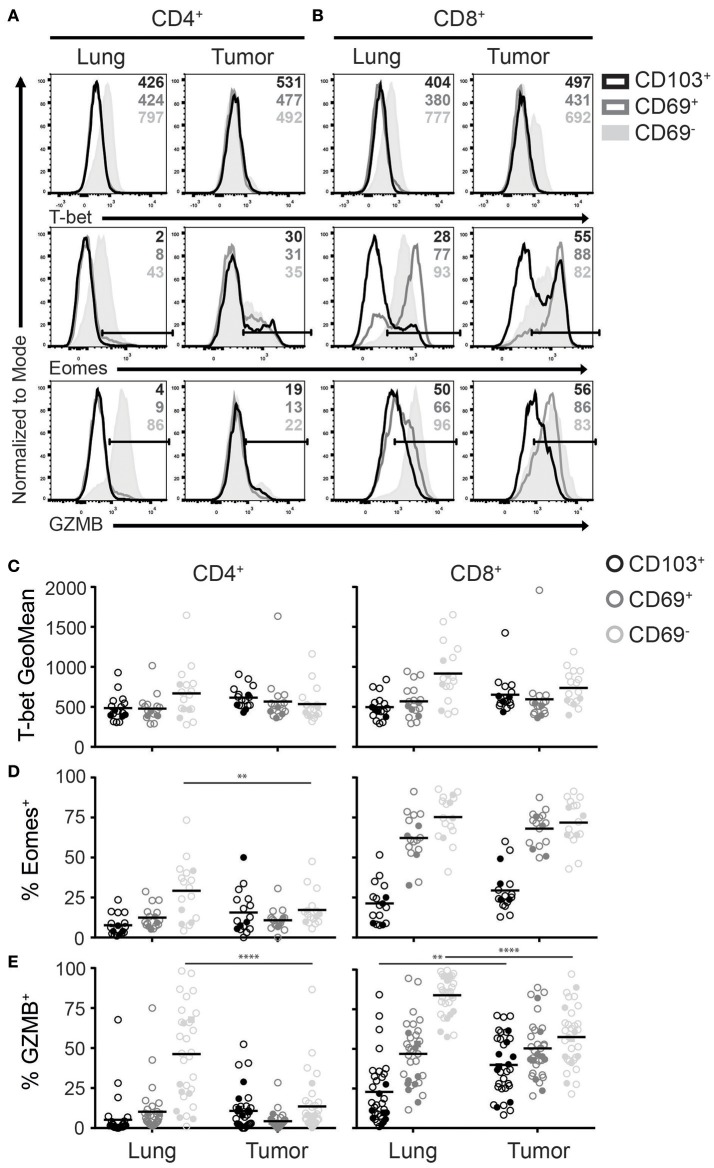
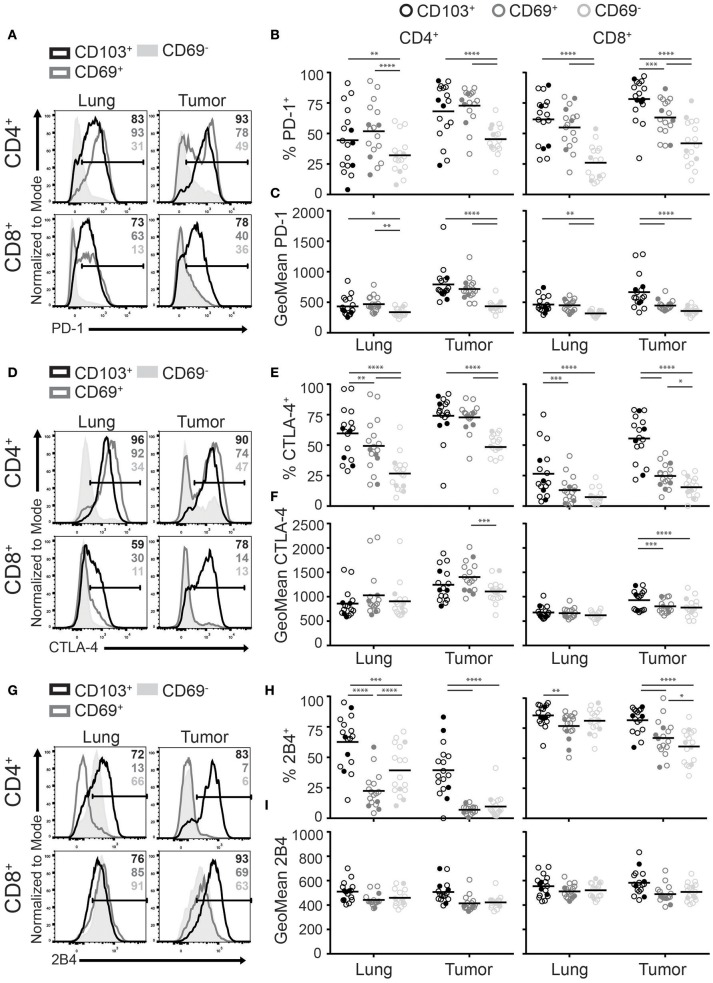
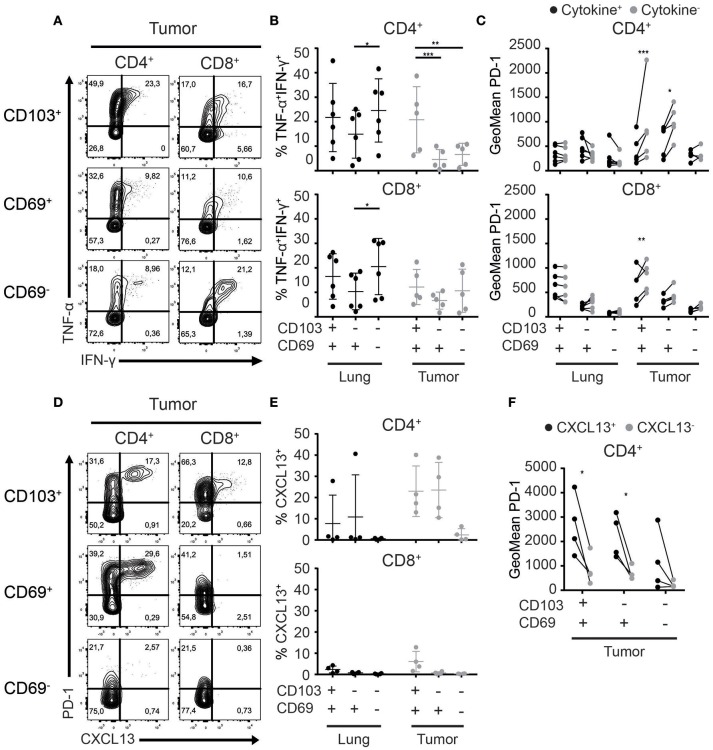
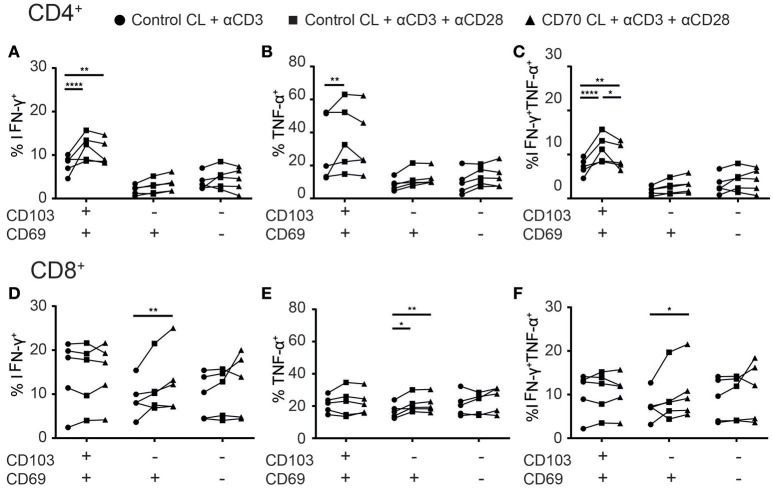
Resident memory T cells (TRM) inhabit peripheral tissues and are critical for protection against localized infections. Recently, it has become evident that CD103+ TRM are not only important in combating secondary infections, but also for the elimination of tumor cells. In several solid cancers, intratumoral CD103+CD8+ tumor infiltrating lymphocytes (TILs), with TRM properties, are a positive prognostic marker. To better understand the role of TRM in tumors, we performed a detailed characterization of CD8+ and CD4+ TIL phenotype and functional properties in non-small cell lung cancer (NSCLC). Frequencies of CD8+ and CD4+ T cell infiltrates in tumors were comparable, but we observed a sharp contrast in TRM ratios compared to surrounding lung tissue. The majority of both CD4+ and CD8+ TILs expressed CD69 and a subset also expressed CD103, both hallmarks of TRM. While CD103+CD8+ T cells were enriched in tumors, CD103+CD4+ T cell frequencies were decreased compared to surrounding lung tissue. Furthermore, CD103+CD4+ and CD103+CD8+ TILs showed multiple characteristics of TRM, such as elevated expression of CXCR6 and CD49a, and decreased expression of T-bet and Eomes. In line with the immunomodulatory role of the tumor microenvironment, CD8+ and CD4+ TILs expressed high levels of inhibitory receptors 2B4, CTLA-4, and PD-1, with the highest levels found on CD103+ TILs. Strikingly, CD103+CD4+ TILs were the most potent producers of TNF-α and IFN-γ, while other TIL subsets lacked such cytokine production. Whereas, CD103+CD4+PD-1low TILs produced the most effector cytokines, CD103+CD4+PD-1++ and CD69+CD4+PD-1++ TILs produced CXCL13. Furthermore, a large proportion of TILs expressed co-stimulatory receptors CD27 and CD28, unlike lung TRM, suggesting a less differentiated phenotype. Agonistic triggering of these receptors improved cytokine production of CD103+CD4+ and CD69+CD8+ TILs. Our findings thus provide a rationale to target CD103+CD4+ TILs and add co-stimulation to current therapies to improve the efficacy of immunotherapies and cancer vaccines.

Keywords: NSCLC; TILs; TRM; co-stimulation; cytokines; differentiation; exhaustion.


Figures

Figure 1
Figure 1
Distribution of CD103 and CD69 expression on CD4+ and CD8+ T cells of paired blood, lung, and tumor samples. (A) Frequencies of CD4+ (black circles) and CD8+ (gray circles) cells of total CD3+ T cells of paired blood, lung, and tumor tissue was analyzed by flow cytometry. (B–D) The expression of CD69 and CD103 was analyzed on paired blood, lung and, tumor CD4+ and CD8+ T cells. (B) Contour plots show representative examples of CD69 and CD103 expression on blood (left panels), lung (middle panels), and tumor (right panels) CD4+ (top panels) and CD8+ (bottom panels) T cells. (C,D) Frequencies of CD103+CD69+ (black circles), CD103CD69+ (dark gray circles), and CD103CD69(light gray circles) cells of total blood, lung, and tumor CD4+ (C) and CD8+ (D) T cells were quantified. (E,F) Correlation between CD103+CD8+ and CD103+CD4+ lung (E) and tumor (F) T cells was determined. (A–F) n = 33. Open circles, solid circles, solid square indicate adeno-, squamous, and large cell carcinoma, respectively. (A,C,D) Quantifications are shown as dot plots with the horizontal line indicating the mean and each point represents a unique sample. (E,F) Correlation shown as X-Y graph where each point represents a unique sample. (C,D) ***p < 0.001, ****p < 0.0001; 2-way analysis of variance (ANOVA) with Tukey's multiple comparisons test. (E,F) r, Pearson's rank coefficient; p < 0.05.
Figure 2
Figure 2
Differentiation status of lung TRM and TILs. (A–D) The expression of CD45RA, CD27, and CD28 on CD4+ and CD8+ lung TRM and TILs was determined. (A,B) The expression of CD27, CD45RA, and CD28 tumor CD103+ (top panels), CD69+ (middle panels), and CD69 (bottom panels) CD4+ (A) and CD8+ (B) T cells shown by representative contour plots (CD45RA on y-axis, CD27 on x-axis) and histograms overlays (maximum set to 100%) show the expression of CD28 on the different subsets (black CD27CD45RA, gray CD27+CD45RA, blue CD27CD45RA+, purple CD27+CD45RA+). (C,D) The frequencies of CD27+CD45RA+CD28+ (light purple), CD27+CD45RA+CD28 (medium purple), CD27+CD45RACD28+ (dark purple), CD27+CD45RACD28 (light gray), CD27CD45RACD28+ (medium gray), CD27CD45RACD28 (black), CD27CD45RA+CD28+ (light blue), CD27CD45RA+CD28 (dark blue) of CD103+, CD69+, and CD69 lung CD4+ (C; left bar graph), tumor CD4+ (C; right bar graph), lung CD8+ (D; left bar graph), and tumor CD8+ (D; right bar graph). (C,D) The quantifications are shown as bar graphs with the mean. n = 15.
Figure 3
Figure 3
Expression of TRM homing molecules by TILs. (A-D) The expression of chemokine receptor CXCR6 and integrin CD49a were analyzed on CD4+ and CD8+ TRM and TILs. The expression of CXCR6 (top panels) and CD49a (bottom panels) on lung (left panels) and tumor (right panels) CD4+ (A) and CD8+ (B) T cell subsets is shown by representative histogram overlays (maximum set to 100%) (CD103+ black, CD69+ dark gray, CD69 solid light gray). The frequencies of CXCR6+ (C) and CD49a+ (D) CD103+ (black circles), CD69+ (dark gray circles), and CD69 (light gray circles) cells of lung and tumor CD4+ T cells (left graphs) and CD8+ T cells (right graphs). (C,D) The quantifications are shown as dot plots with the horizontal line indicating the mean and each point represents a unique sample. n = 15–17. Open circles and solid circles indicate adeno- and squamous carcinoma, respectively. *p < 0.05, ***p < 0.001, ****p < 0.0001; 2-way ANOVA with Tukey's multiple comparisons test.
Figure 4
Figure 4
Expression of T-bet, Eomes and GZMB on TRM and TILs. (A–D) The expression of T-bet, Eomes, and GZMB was analyzed on CD4+ and CD8+ TRM and TILs. The expression of T-bet (top panels), Eomes (middle panels), and GZMB (bottom panels) on lung (left panels) and tumor (right panels) CD4+ (A) and CD8+ (B) T cells is shown by representative histogram overlays (maximum set to 100%) (CD103+ black, CD69+ dark gray, CD69 solid light gray). The expression of T-bet (geometric mean fluorescence intensity; GeoMFI) (C) and frequencies of Eomes+ (D) and GZMB+ (E) CD103+ (black circles), CD69+ (dark gray circles), and CD69 (light gray circles) cells of lung and tumor CD4+ (left graphs) and CD8+ (right graphs) T cells. (C–E) The quantifications are shown as dot plots with the horizontal line indicating the mean and each point represents a unique sample. n = 17. Open circles and solid circles indicate adeno- and squamous carcinoma, respectively. **p < 0.01, ****p < 0.0001; 2-way ANOVA with Tukey's multiple comparisons test.
Figure 5
Figure 5
CD103+ TILs express the highest levels of inhibitory receptors. (A–I) The expression of inhibitory receptors PD-1, CTLA-4, and 2B4 was analyzed on CD4+ and CD8+ TRM and TILs. The expression of PD-1 (A), CTLA-4 (D), and 2B4 (G) on lung (left panel) and tumor (right panel) on CD4+ (top panel) and CD8+ (bottom panel) T cells is shown by representative histogram overlays (maximum set to 100%) (CD103+ black, CD69+ dark gray, CD69 solid light gray). The frequencies and geoMFI of PD-1+ (B,C), CTLA-4+ (E,F) and 2B4+ (H,I) were quantified for CD103+ (black circles), CD69+ (dark gray circles), and CD69 (light gray circles) cells of lung and tumor CD4+ (left graphs) and CD8+ (right graphs) T cells. (B,C,E,F,H,I) The quantifications are shown as dot plots with the horizontal line indicating the mean and each point represents a unique sample. n = 17. Open circles and solid circles indicate adeno- and squamous carcinoma, respectively. *p < 0.05, **p < 0.01, ***p < 0.001, ****p < 0.0001; 2-way ANOVA with Tukey's multiple comparisons test.
Figure 6
Figure 6
Cytokine and chemokine production of TRM and TILs. (A–C) Cytokine production by lung TRM and TILs was determined after overnight αCD3/αCD28 stimulation. (A) The production of TNF-α and IFN-γ by CD103+ (top panels), CD69+ (middle panels), and CD69 (bottom panels) tumor CD4+ (left panels) and CD8+ (right panels) TILs shown by representative contour plots (TNF-α on y-axis, IFN-γ on x-axis). (B) TNF-α+IFN-γ+ CD103+, CD69+, and CD69 cells of lung and tumor CD4+ (top graph) and CD8+ (bottom graph) T cells. (C) PD-1 expression (geometric mean fluorescence intensity; GeoMFI) was quantified on cytokine+ (TNF-α+ and/or IFN-γ+) (black circles) and cytokine (TNF-αIFN-γ) (gray circles) CD103+, CD69+, and CD69 lung and tumor CD4+ (top graph) and CD8+ (bottom graph) T cells. (D) The expression of CXCL13 was determined by flow cytometry in CD103+ (top panels), CD69+ (middle panels), and CD69 (bottom panels) tumor CD4+ (left panels) and CD8+ (right panels) TILs and is shown by representative contour plots (PD-1 on y-axis, CXCL13 on x-axis). (E) CXCL13+ of CD103+, CD69+, and CD69 cells was quantified in lung and tumor CD4+ (top graph) and CD8+ (bottom graph) T cells. (F) PD-1 expression (GeoMFI) was quantified on the CXCL13+ (black circles) and CXCL13 (gray circles) CD103+, CD69+, and CD69 CD4+ TILs. n = 4–6 paired lung-tumor samples; all adenocarcinoma. *p < 0.05, **p < 0.01, ***p < 0.001; 2-way ANOVA with Tukey's multiple comparisons test.
Figure 7
Figure 7
Co-stimulation enhances cytokine production of TILs. (A–F) The effect of co-stimulation on cytokine production of TILs was assessed with overnight stimulation. (A–C) The frequencies of IFN-γ+ (A), TNFα+ (B), or TNF-α+IFN-γ+ (C) CD103+, CD69+, and CD69 CD4+ TILs stimulated with αCD3 with control cell line (CL) (black circles), αCD3 and αCD28 with control CL (black squares), or αCD3 and αCD28 with CD70-expressing CL (black triangles) was quantified. (D–F) The frequencies of IFN-γ+ (D), TNFα+ (E), or TNF-α+IFN-γ+ (F) CD103+, CD69+, and CD69 CD8+ TILs stimulated with αCD3 with control CL (black circles), αCD3 and αCD28 with control CL (black squares), or αCD3 and αCD28 with CD70-expressing CL (black triangles) was quantified. n = 5. *p < 0.05, **p < 0.01, ****p < 0.0001; 2-way ANOVA with Tukey's multiple comparisons test.

Similar articles

Cited by

References

    1. Fridman WH, Pagès F, Sautès-Fridman C, Galon J. The immune contexture in human tumours: impact on clinical outcome. Nat Publ Gr. (2012) 12:298–306. 10.1038/nrc3245 - DOI - PubMed
    1. Becht E, Giraldo NA, Dieu-Nosjean MC, Sautès-Fridman C, Fridman WH. Cancer immune contexture and immunotherapy. Curr Opin Immunol. (2016) 39:7–13. 10.1016/j.coi.2015.11.009 - DOI - PubMed
    1. Sharma P, Allison JP. Immune checkpoint targeting in cancer therapy: toward combination strategies with curative potential. Cell (2015) 161:205–14. 10.1016/j.cell.2015.03.030 - DOI - PMC - PubMed
    1. Park CO, Kupper TS, Park CO, Kupper TS. The emerging role of resident memory T cells in protective immunity and inflammatory disease. Nat Med. (2015) 21:688–97. 10.1038/nm.3883 - DOI - PMC - PubMed
    1. Hombrink P, Helbig C, Backer RA, Piet B, Oja AE, Stark R, et al. . Programs for the persistence, vigilance and control of human CD8+ lung-resident memory T cells. Nat Immunol. (2016) 17:1467–78. 10.1038/ni.3589 - DOI - PubMed

Publication types

MeSH terms