

Optimal and near-optimal exponent-pairs for the Bertalanffy-Pütter growth model
- PMID: 30505634
- PMCID: PMC6254241
- DOI: 10.7717/peerj.5973
Optimal and near-optimal exponent-pairs for the Bertalanffy-Pütter growth model
Abstract
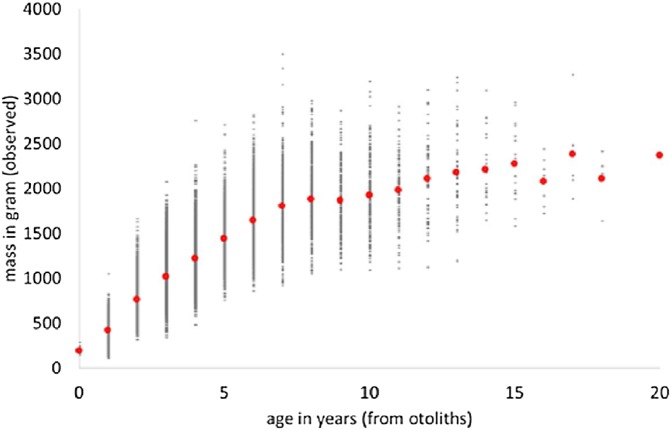
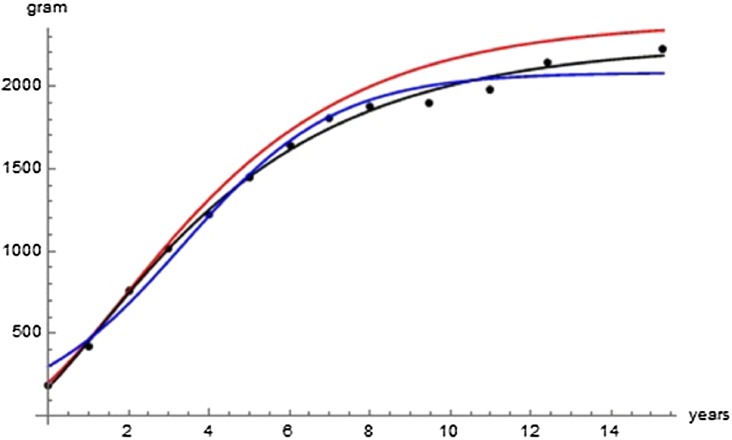
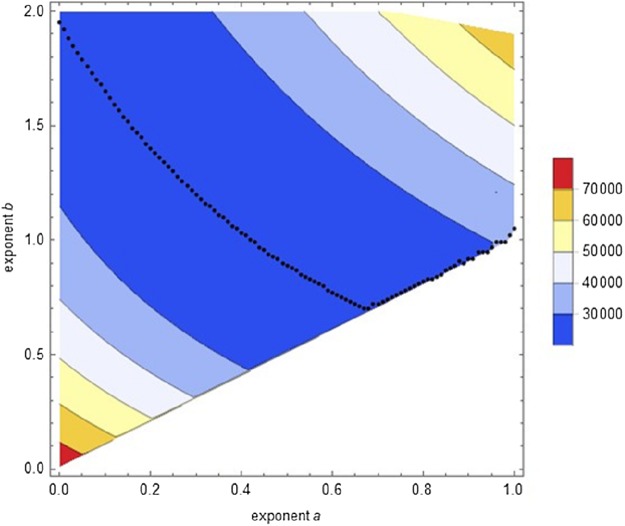
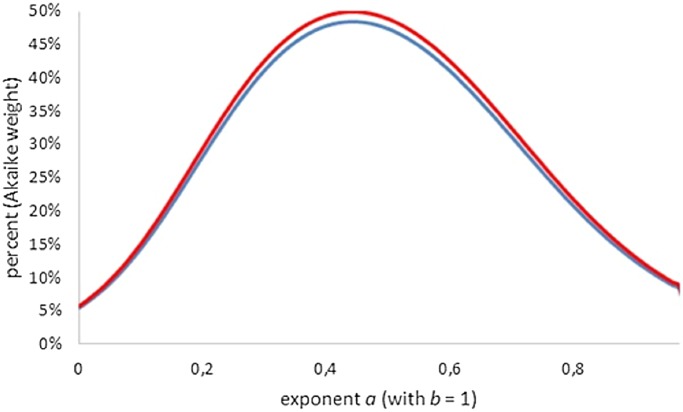
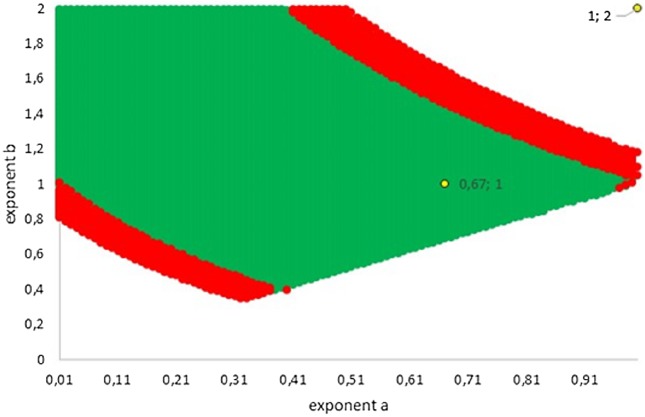
The Bertalanffy-Pütter growth model describes mass m at age t by means of the differential equation dm/dt = p * m a - q * mb . The special case using the von Bertalanffy exponent-pair a = 2/3 and b = 1 is most common (it corresponds to the von Bertalanffy growth function VBGF for length in fishery literature). Fitting VBGF to size-at-age data requires the optimization of three model parameters (the constants p, q, and an initial value for the differential equation). For the general Bertalanffy-Pütter model, two more model parameters are optimized (the pair a < b of non-negative exponents). While this reduces bias in growth estimates, it increases model complexity and more advanced optimization methods are needed, such as the Nelder-Mead amoeba method, interior point methods, or simulated annealing. Is the improved performance worth these efforts? For the case, where the exponent b = 1 remains fixed, it is known that for most fish data any exponent a < 1 could be used to model growth without affecting the fit to the data significantly (when the other parameters were optimized). We hypothesized that the optimization of both exponents would result in a significantly better fit of the optimal growth function to the data and we tested this conjecture for a data set (20,166 fish) about the mass-growth of Walleye (Sander vitreus), a fish from Lake Erie, USA. To this end, we assessed the fit on a grid of 14,281 exponent-pairs (a, b) and identified the best fitting model curve on the boundary a = b of the grid (a = b = 0.686); it corresponds to the generalized Gompertz equation dm/dt = p * ma - q * ln(m) * ma . Using the Akaike information criterion for model selection, the answer to the conjecture was no: The von Bertalanffy exponent-pair model (but not the logistic model) remained parsimonious. However, the bias reduction attained by the optimal exponent-pair may be worth the tradeoff with complexity in some situations where predictive power is solely preferred. Therefore, we recommend the use of the Bertalanffy-Pütter model (and of its limit case, the generalized Gompertz model) in natural resources management (such as in fishery stock assessments), as it relies on careful quantitative assessments to recommend policies for sustainable resource usage.
Keywords: Akaike information criterion; Bertalanffy–Pütter differential equation; Region of near-optimality.
Conflict of interest statement
The authors declare that they have no competing interests.
Figures
References
-
- Akaike H. A new look at the statistical model identification. IEEE Transactions on Automatic Control. 1974;19(6):716–723. doi: 10.1109/tac.1974.1100705. - DOI
-
- Apostolidis C, Stergiou KI. Estimation of growth parameters from published data for several Mediterranean fishes. Journal of Applied Ichthyology. 2014;30(1):189–194. doi: 10.1111/jai.12303. - DOI
-
- Von Bertalanffy L. Quantitative laws in metabolism and growth. Quarterly Reviews of Biology. 1957;32:217–231. - PubMed
-
- Burden RL, Faires JD. Numerical analysis. Boston: PWS Publishing Co; 1993.
-
- Burnham KP, Anderson DR. Model selection and multi-model inference: a practical information-theoretic approach. Berlin: Springer; 2002.
LinkOut - more resources
Full Text Sources
Miscellaneous
