

Qualitative and Quantitative DNA- and RNA-Based Analysis of the Bacterial Stomach Microbiota in Humans, Mice, and Gerbils
- PMID: 30505943
- PMCID: PMC6247015
- DOI: 10.1128/mSystems.00262-18
Qualitative and Quantitative DNA- and RNA-Based Analysis of the Bacterial Stomach Microbiota in Humans, Mice, and Gerbils
Abstract
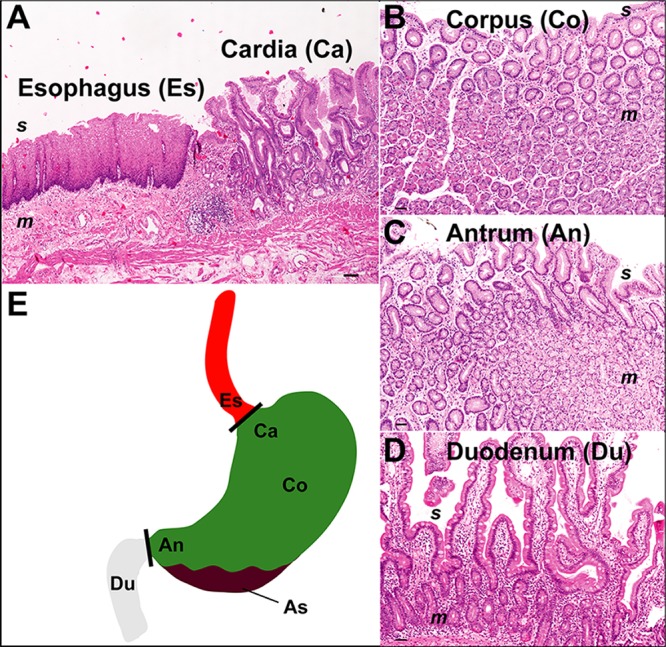
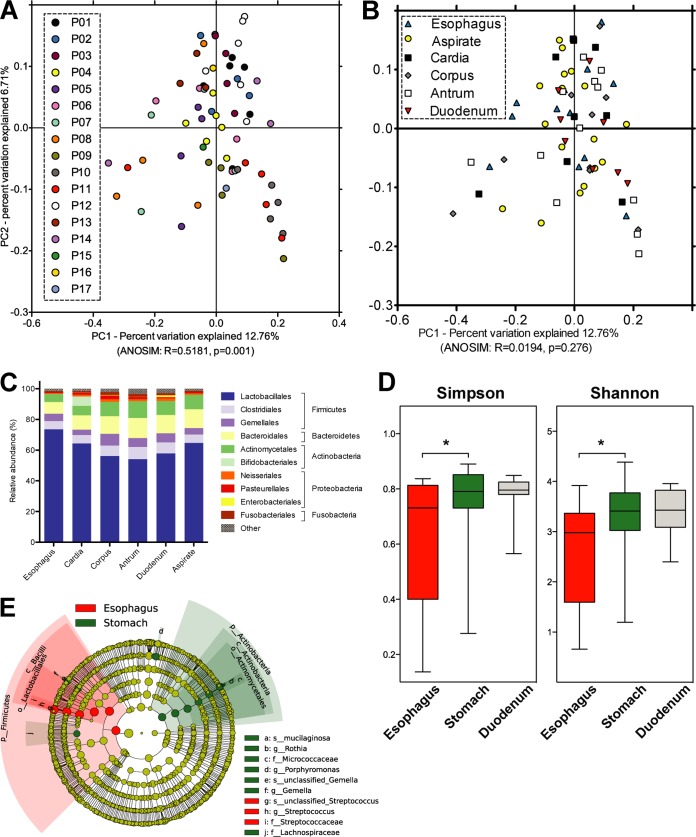
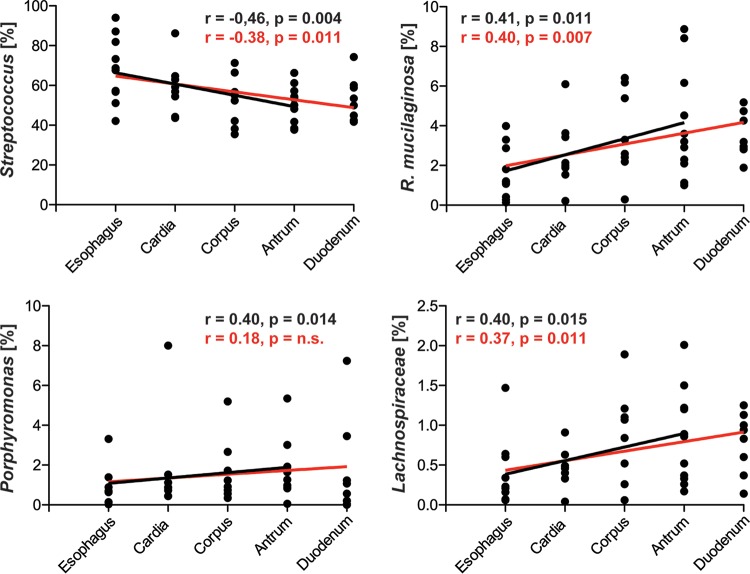
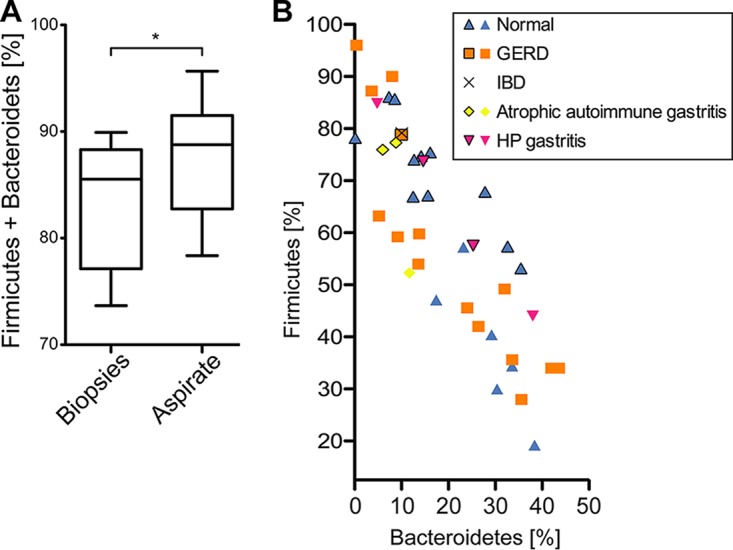
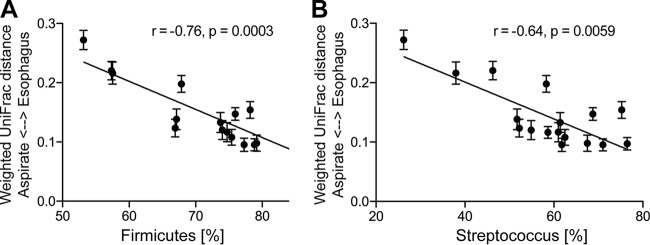
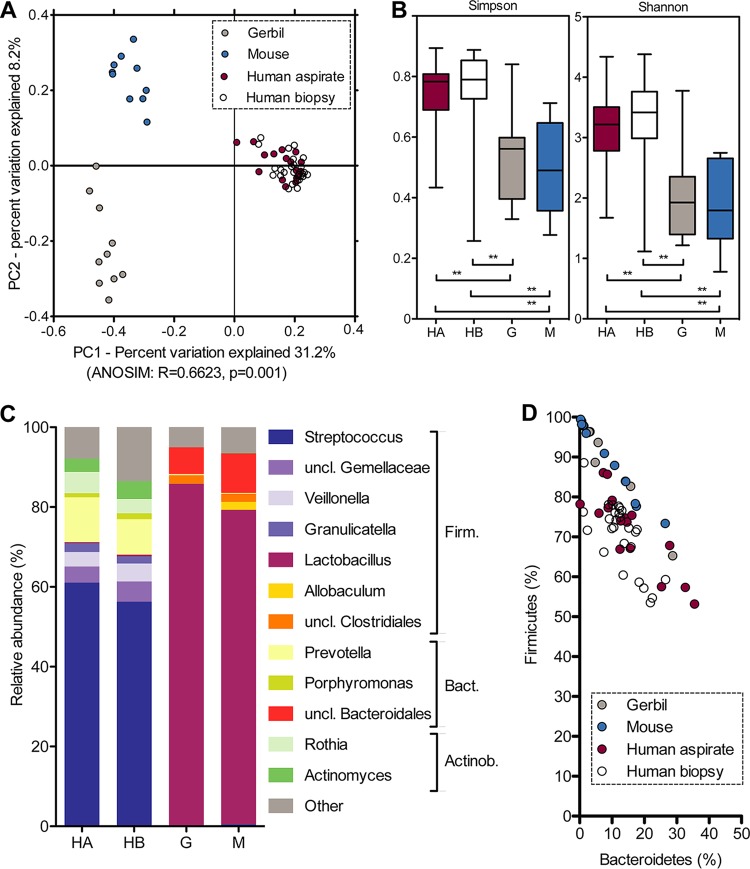
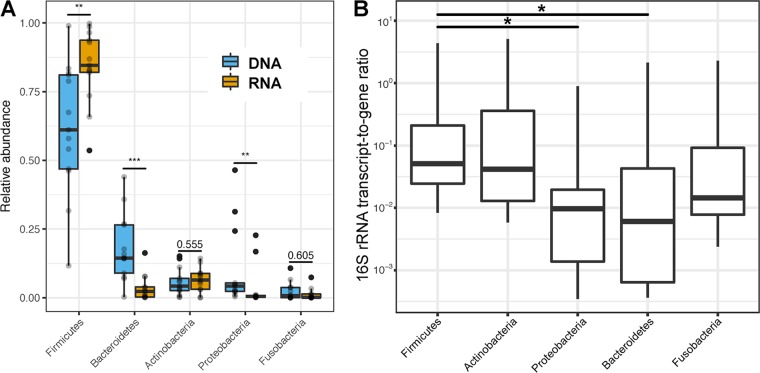
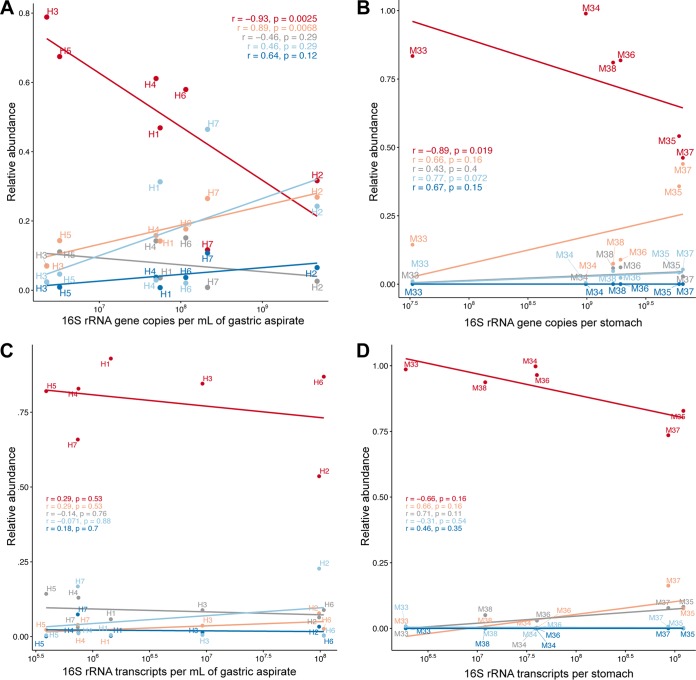
Clinical interventions in the stomach have been linked to fecal microbiota alterations, suggesting a function of the stomach in gastrointestinal (GI) homeostasis. We sought to determine the taxonomic bacterial biogeography of the upper GI tract, including different sites within the human stomach (cardia, corpus, and antrum), adjacent upstream (esophagus) and downstream (duodenum) locations, and luminal contents (aspirate), as well as whole-stomach samples from mice and gerbils. Qualitative and quantitative DNA- and RNA-based taxonomic microbiota analyses were combined to study the relationship of relative and absolute bacterial abundances and transcriptionally active bacterial microbiota components in the stomach of humans and mice. Stomach microbiota compositions resembled those of esophagus and duodenum. However, along the descending GI tract, the relative abundances of specific oropharyngeal commensals decreased (Streptococcus) or increased (Rothia mucilaginosa, Porphyromonas, and Lachnospiraceae). Furthermore, the compositional similarity (weighted UniFrac) between stomach aspirates and esophageal biopsy samples increased with gastric Streptococcus relative abundance. In both human aspirate and mouse stomach samples, Firmicutes were more abundant among transcriptionally active bacteria than Bacteroidetes. The relative abundance of Firmicutes in the stomach was negatively correlated and that of Bacteroidetes was positively correlated with absolute bacterial abundance, suggesting a disproportionate increase of Bacteroidetes over Firmicutes at higher bacterial densities. Human, mouse, and gerbil stomach samples showed similarities at higher taxonomic levels but differences at lower taxonomic levels. Our findings suggest selective enrichment and depletion of specific bacterial taxa in the stomach and Firmicutes being transcriptionally more active than Bacteroidetes that increase in relative abundance with total bacterial load. IMPORTANCE Clinical stomach interventions, such as acid inhibition or bypass surgery, have been linked to fecal microbiota alterations. We demonstrate that the stomach microbiota largely overlaps those of adjacent gastrointestinal locations and identify gradual decreases and increases in the relative abundances of specific bacteria within the stomach, suggesting selective enrichment and depletion. Moreover, similarities between stomach and esophagus samples are proportional to the concentrations of Streptococcus (Firmicutes) in the stomach. The relative abundance of Firmicutes in the stomach, compared to that of Bacteroidetes, is increased in RNA relative to DNA, indicating higher transcriptional activity. Moreover, increased absolute bacterial loads are associated with decreased relative abundance of Firmicutes and higher relative abundance of Bacteroidetes. Our findings characterize the stomach microbiota as influenced by Bacteroidetes influx against a background of transcriptionally more active Firmicutes. Human, mouse, and gerbil stomach microbiotas differ at lower taxonomic levels, which might affect the utility of these model organisms.
Keywords: 16S rRNA; absolute abundance; quantitative microbiota analysis; stomach microbiota; transcriptional activity.
Figures
Similar articles
-
Analysis of Transcriptionally Active Bacteria Throughout the Gastrointestinal Tract of Healthy Individuals.Gastroenterology. 2019 Oct;157(4):1081-1092.e3. doi: 10.1053/j.gastro.2019.05.068. Epub 2019 Jun 5. Gastroenterology. 2019. PMID: 31175864
-
Comparison of mucosal microbiota populations across the gastrointestinal tract of healthy dogs.Anim Microbiome. 2025 Jan 6;7(1):2. doi: 10.1186/s42523-024-00368-7. Anim Microbiome. 2025. PMID: 39762940 Free PMC article.
-
Immune status, antibiotic medication and pH are associated with changes in the stomach fluid microbiota.ISME J. 2013 Jul;7(7):1354-66. doi: 10.1038/ismej.2013.33. Epub 2013 Mar 7. ISME J. 2013. PMID: 23466701 Free PMC article.
-
Alterations in Gastric Mucosal Microbiota in Gastric Carcinogenesis: A Systematic Review and Meta-Analysis.Front Med (Lausanne). 2021 Dec 3;8:754959. doi: 10.3389/fmed.2021.754959. eCollection 2021. Front Med (Lausanne). 2021. PMID: 34926502 Free PMC article.
-
Association between oral microflora and gastrointestinal tumors (Review).Oncol Rep. 2021 Aug;46(2):160. doi: 10.3892/or.2021.8111. Epub 2021 Jun 16. Oncol Rep. 2021. PMID: 34132360 Review.
Cited by
-
Impaired Bile Acid Metabolism and Gut Dysbiosis in Mice Lacking Lysosomal Acid Lipase.Cells. 2021 Oct 1;10(10):2619. doi: 10.3390/cells10102619. Cells. 2021. PMID: 34685599 Free PMC article.
-
Predicting Personalized Diets Based on Microbial Characteristics between Patients with Superficial Gastritis and Atrophic Gastritis.Nutrients. 2023 Nov 9;15(22):4738. doi: 10.3390/nu15224738. Nutrients. 2023. PMID: 38004131 Free PMC article.
-
Contamination-controlled upper gastrointestinal microbiota profiling reveals salivary-duodenal community types linked to opportunistic pathogen carriage and inflammation.Gut Microbes. 2025 Dec;17(1):2539452. doi: 10.1080/19490976.2025.2539452. Epub 2025 Aug 1. Gut Microbes. 2025. PMID: 40746257 Free PMC article.
-
Distribution and Difference of Gastrointestinal Flora in Sheep with Different Body Mass Index.Animals (Basel). 2022 Mar 30;12(7):880. doi: 10.3390/ani12070880. Animals (Basel). 2022. PMID: 35405869 Free PMC article.
-
Re-framing the importance of Group B Streptococcus as a gut-resident pathobiont.Infect Immun. 2024 Sep 10;92(9):e0047823. doi: 10.1128/iai.00478-23. Epub 2024 Mar 4. Infect Immun. 2024. PMID: 38436256 Free PMC article. Review.
References
-
- Buffie CG, Bucci V, Stein RR, McKenney PT, Ling L, Gobourne A, No D, Liu H, Kinnebrew M, Viale A, Littmann E, van den Brink MR, Jenq RR, Taur Y, Sander C, Cross JR, Toussaint NC, Xavier JB, Pamer EG. 2015. Precision microbiome reconstitution restores bile acid mediated resistance to Clostridium difficile. Nature 517:205–208. doi:10.1038/nature13828. - DOI - PMC - PubMed
-
- Maier L, Vyas R, Cordova CD, Lindsay H, Schmidt TS, Brugiroux S, Periaswamy B, Bauer R, Sturm A, Schreiber F, von Mering C, Robinson MD, Stecher B, Hardt WD. 2013. Microbiota-derived hydrogen fuels Salmonella typhimurium invasion of the gut ecosystem. Cell Host Microbe 14:641–651. doi:10.1016/j.chom.2013.11.002. - DOI - PubMed
-
- Desai MS, Seekatz AM, Koropatkin NM, Kamada N, Hickey CA, Wolter M, Pudlo NA, Kitamoto S, Terrapon N, Muller A, Young VB, Henrissat B, Wilmes P, Stappenbeck TS, Nunez G, Martens EC. 2016. A dietary fiber-deprived gut microbiota degrades the colonic mucus barrier and enhances pathogen susceptibility. Cell 167:1339–1353.E21. doi:10.1016/j.cell.2016.10.043. - DOI - PMC - PubMed
LinkOut - more resources
Full Text Sources
