. 2018 Nov 20;3(6):e00219-18.
doi: 10.1128/mSystems.00219-18. eCollection 2018 Nov-Dec.

q2-longitudinal: Longitudinal and Paired-Sample Analyses of Microbiome Data

Affiliations

q2-longitudinal: Longitudinal and Paired-Sample Analyses of Microbiome Data

Nicholas A Bokulich et al. mSystems. .

Abstract

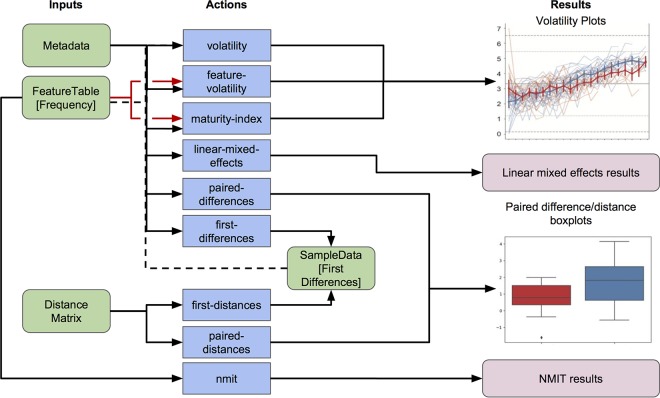
Studies of host-associated and environmental microbiomes often incorporate longitudinal sampling or paired samples in their experimental design. Longitudinal sampling provides valuable information about temporal trends and subject/population heterogeneity, offering advantages over cross-sectional and pre-post study designs. To support the needs of microbiome researchers performing longitudinal studies, we developed q2-longitudinal, a software plugin for the QIIME 2 microbiome analysis platform (https://qiime2.org). The q2-longitudinal plugin incorporates multiple methods for analysis of longitudinal and paired-sample data, including interactive plotting, linear mixed-effects models, paired differences and distances, microbial interdependence testing, first differencing, longitudinal feature selection, and volatility analyses. The q2-longitudinal package (https://github.com/qiime2/q2-longitudinal) is open-source software released under a 3-clause Berkeley Software Distribution (BSD) license and is freely available, including for commercial use. IMPORTANCE Longitudinal sampling provides valuable information about temporal trends and subject/population heterogeneity. We describe q2-longitudinal, a software plugin for longitudinal analysis of microbiome data sets in QIIME 2. The availability of longitudinal statistics and visualizations in the QIIME 2 framework will make the analysis of longitudinal data more accessible to microbiome researchers.

Keywords: bioinformatics; linear mixed effects; longitudinal analysis; microbiome.


Figures

FIG 1
FIG 1
Schematic overview of q2-longitudinal. Green boxes indicate QIIME 2 artifact files, labeled by the file type/format. Blue boxes indicate actions (the various functions available in q2-longitudinal), labeled by the function name. Lines indicate required inputs and outputs; dotted lines indicate optional inputs. All actions require sample metadata files, and feature tables (sample by observation matrices, e.g., of operational taxonomic units [OTUs], taxa, or sequence variant data) are optional inputs to a number of actions but required by the feature-volatility and “maturity-index” pipelines (red arrows for emphasis). Only some actions shown in this schematic are described in this work; see https://github.com/qiime2/q2-longitudinal or https://qiime2.org for more details on all actions available in q2-longitudinal. NMIT, Non-parametric Microbial Interdependence Test.
FIG 2
FIG 2
Longitudinal feature-volatility analysis of bacterial genera in the ECAM subjects. Relative abundances of Bifidobacterium (A) and Faecalibacterium (B) across time are shown both for individual subjects (narrow lines) and group averages (thick lines) categorized by predominant diet type (predominantly breastfed or formula fed during the first 3 months of life). Dashed lines indicate the developmental “windows” that were separately analyzed by LME as described in the text. C, feature metadata and other descriptive statistics for the top important features, ordered by decreasing importance. Bifidobacterium and Faecalibacterium are labeled “Bif” and “Fae,” respectively. This list was truncated and does not contain all 71 important genera identified in this analysis.
FIG 3
FIG 3
Volatility charts of longitudinal change in unweighted UniFrac distances between successive samples collected from the same subject (first distances) in the ECAM data set (A), distance from baseline for each subject (B), and Jaccard distance (proportion of features not shared) between children’s and their mothers’ stool microbiotas. Thick lines with error bars represent mean distance (± standard deviation) for vaginally and cesarean section-delivered subjects. Faded spaghetti lines represent the longitudinal trajectory for each individual subject. Horizontal lines represent the mean (solid midpoint) and 2 (dotted line) and 3 (dashed line) standard deviations from the mean computed across all samples. Sample sizes differ between subplots because some subjects are missing samples for a particular month, resulting in fewer subjects eligible for first differencing at that month and the subsequent time point. Note that x and y axis scales differ across the three plots to highlight difference in the scale that is most informative for each analysis.

References

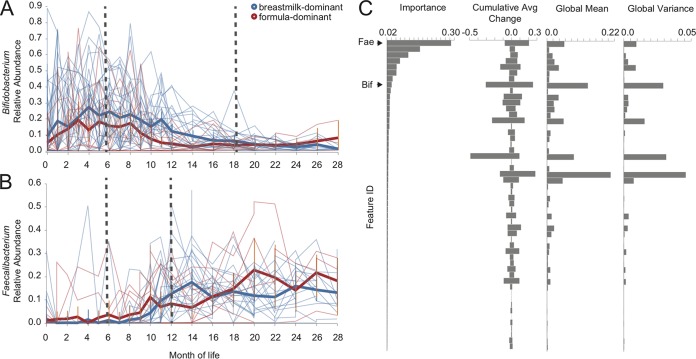
    1. Bokulich NA, Chung J, Battaglia T, Henderson N, Jay M, Li H, Lieber AD, Wu F, Perez-Perez GI, Chen Y, Schweizer W, Zheng X, Contreras M, Dominguez-Bello MG, Blaser MJ. 2016. Antibiotics, birth mode, and diet shape microbiome maturation during early life. Sci Transl Med 8:343ra82. doi:10.1126/scitranslmed.aad7121. - DOI - PMC - PubMed
    1. Gibbons SM, Kearney SM, Smillie CS, Alm EJ. 2017. Two dynamic regimes in the human gut microbiome. PLoS Comput Biol 13:e1005364. doi:10.1371/journal.pcbi.1005364. - DOI - PMC - PubMed
    1. Flores GE, Caporaso JG, Henley JB, Rideout JR, Domogala D, Chase J, Leff JW, Vázquez-Baeza Y, Gonzalez A, Knight R, Dunn RR, Fierer N. 2014. Temporal variability is a personalized feature of the human microbiome. Genome Biol 15:531. doi:10.1186/s13059-014-0531-y. - DOI - PMC - PubMed
    1. Gajer P, Brotman RM, Bai G, Sakamoto J, Schütte UME, Zhong X, Koenig SSK, Fu L, Ma ZS, Zhou X, Abdo Z, Forney LJ, Ravel J. 2012. Temporal dynamics of the human vaginal microbiota. Sci Transl Med 4:132ra52. doi:10.1126/scitranslmed.3003605. - DOI - PMC - PubMed
    1. Dethlefsen L, Relman DA. 2011. Incomplete recovery and individualized responses of the human distal gut microbiota to repeated antibiotic perturbation. Proc Natl Acad Sci U S A 108(Suppl 1):4554–4561. doi:10.1073/pnas.1000087107. - DOI - PMC - PubMed

LinkOut - more resources