. 2019 Mar;28(6):1506-1522.
doi: 10.1111/mec.14963. Epub 2019 Jan 17.

Population-specific dynamics and selection patterns of transposable element insertions in European natural populations

Affiliations

Population-specific dynamics and selection patterns of transposable element insertions in European natural populations

Emmanuelle Lerat et al. Mol Ecol. 2019 Mar.

Abstract

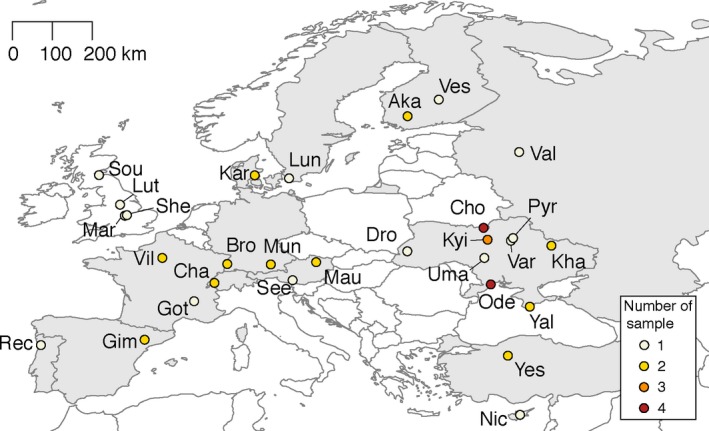
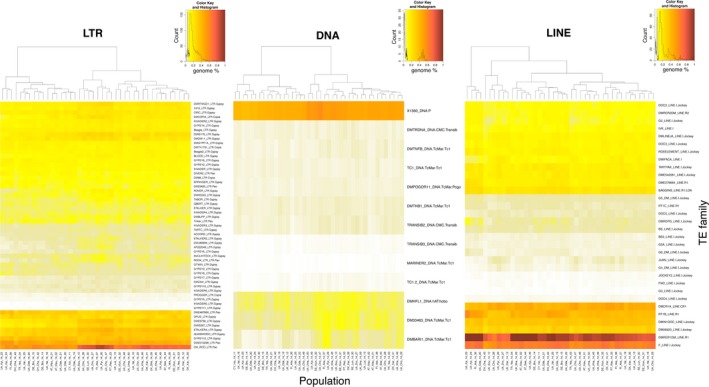
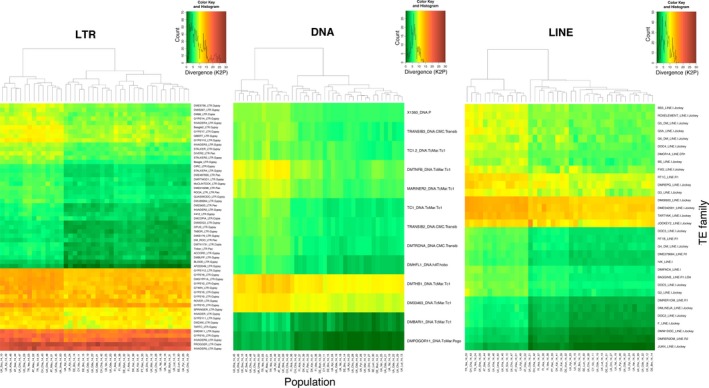
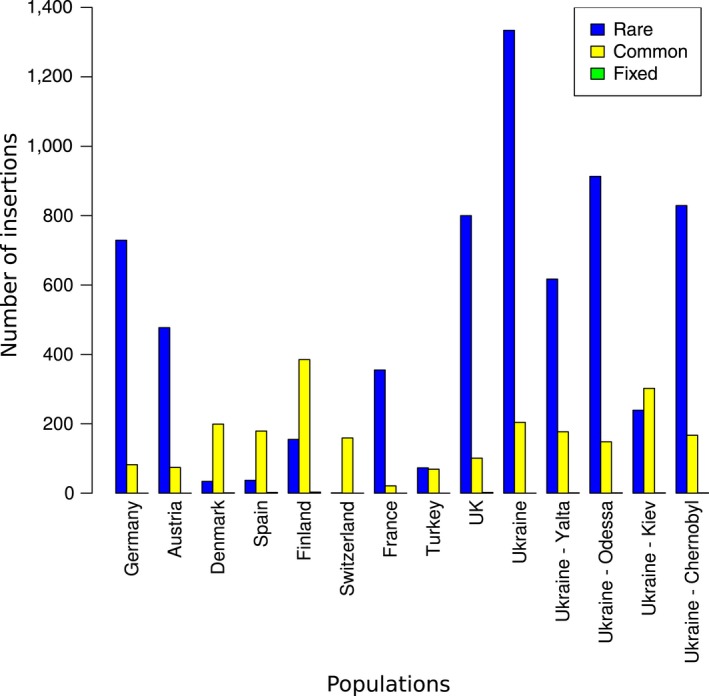
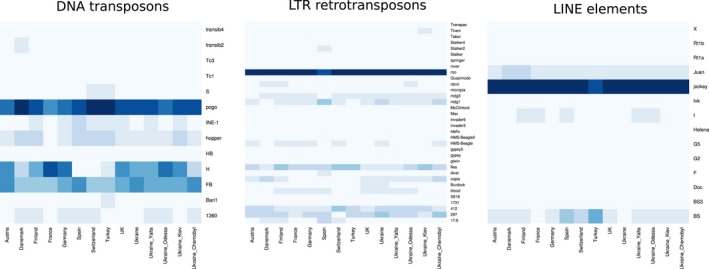
Transposable elements (TEs) are ubiquitous sequences in genomes of virtually all species. While TEs have been investigated for several decades, only recently we have the opportunity to study their genome-wide population dynamics. Most of the studies so far have been restricted either to the analysis of the insertions annotated in the reference genome or to the analysis of a limited number of populations. Taking advantage of the European Drosophila population genomics consortium (DrosEU) sequencing data set, we have identified and measured the dynamics of TEs in a large sample of European Drosophila melanogaster natural populations. We showed that the mobilome landscape is population-specific and highly diverse depending on the TE family. In contrast with previous studies based on SNP variants, no geographical structure was observed for TE abundance or TE divergence in European populations. We further identified de novo individual insertions using two available programs and, as expected, most of the insertions were present at low frequencies. Nevertheless, we identified a subset of TEs present at high frequencies and located in genomic regions with a high recombination rate. These TEs are candidates for being the target of positive selection, although neutral processes should be discarded before reaching any conclusion on the type of selection acting on them. Finally, parallel patterns of association between the frequency of TE insertions and several geographical and temporal variables were found between European and North American populations, suggesting that TEs can be potentially implicated in the adaptation of populations across continents.


Figures

Figure 1
Figure 1
Geographical localization of the populations analysed in this work (Kapun et al., 2018). Acronyms are detailed in Supporting Information Table S1. Colours indicate the number of samples at each geographical location [Colour figure can be viewed at http://wileyonlinelibrary.com]
Figure 2
Figure 2
Heatmap representing the genome percentage estimate of each TE family per sample. Abundance was estimated by mapping 0.5X of unassembled reads of each sample against the D. melanogaster TE library with RepeatMasker. The colour scale, from yellow to red, is proportional to the TE family abundance. Cladograms indicate the level of similarity between populations based on their relative TE abundance per family [Colour figure can be viewed at http://wileyonlinelibrary.com]
Figure 3
Figure 3
Heatmap representing the average Kimura substitution level (CpG adjusted, K2P) of each TE family per sample. Divergence was estimated by mapping 0.5X of unassembled reads of each sample against the Drosophila melanogaster TE library with RepeatMasker. The colour scale, from green to red, is proportional to the K2P distance. Cladograms indicate the level of similarity between populations based on the TE divergence per family [Colour figure can be viewed at http://wileyonlinelibrary.com]
Figure 4
Figure 4
Frequency distribution of de novo insertions identified by both popoolationte2 and tidal. For each population, the different insertions were categorized according to their population frequency in “rare,” “common” and “fixed” insertions [Colour figure can be viewed at http://wileyonlinelibrary.com]
Figure 5
Figure 5
The most represented TE families among the de novo insertions. The heatmaps represent the proportion of each TE family found among de novo insertions in each population, according to each TE class. The representation is normalized by population; thus, the TE families that are the most abundant in that particular population can be identified. The abundance of a particular TE family is higher as the blue colour intensifies [Colour figure can be viewed at http://wileyonlinelibrary.com]

References

    1. Adrion, J. R. , Song, M. J. , Schrider, D. R. , Hahn, M. W. , & Schaack, S. (2017). Genome‐Wide estimates of transposable element insertion and deletion rates in Drosophila melanogaster . Genome Biology and Evolution, 9(5), 1329–1340. 10.1093/gbe/evx050 - DOI - PMC - PubMed
    1. Alkan, C. , Coe, B. P. , & Eichler, E. E. (2011). Genome structural variation discovery and genotyping. Nature Reviews Genetics, 12(5), 363–376. 10.1038/nrg2958 - DOI - PMC - PubMed
    1. Ashburner, M. , Golic, K. , & Hawley, R. (2005). Drosophila: A laboratory handbook, 2nd ed (Cold Sprin). New‐York, NY: Cold Spring Harbor Laboratory Press.
    1. Bargues, N. , & Lerat, E. (2017). Evolutionary history of LTR‐retrotransposons among 20 Drosophila species. Mobile DNA, 8(1), 7 10.1186/s13100-017-0090-3 - DOI - PMC - PubMed
    1. Barrón, M. G. , Fiston‐Lavier, A.‐S. , Petrov, D. A. , & González, J. (2014). Population genomics of transposable elements in Drosophila . Annual Review of Genetics, 48(1), 561–581. 10.1146/annurev-genet-120213-092359 - DOI - PubMed

Publication types

Substances

LinkOut - more resources