. 2019 Apr;69(4):1719-1734.
doi: 10.1002/hep.30365. Epub 2019 Mar 5.

Peribiliary Glands Are Key in Regeneration of the Human Biliary Epithelium After Severe Bile Duct Injury

Affiliations

Peribiliary Glands Are Key in Regeneration of the Human Biliary Epithelium After Severe Bile Duct Injury

Iris E M de Jong et al. Hepatology. 2019 Apr.

Abstract

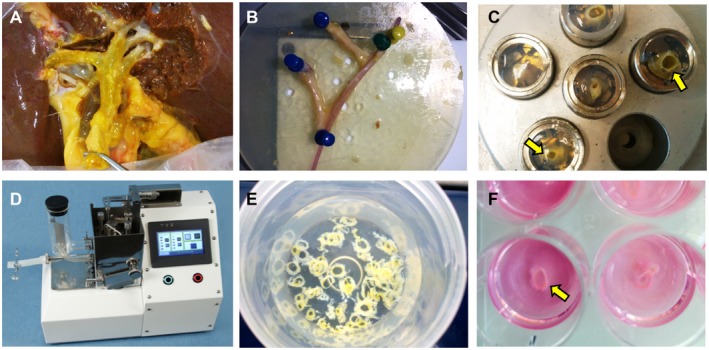
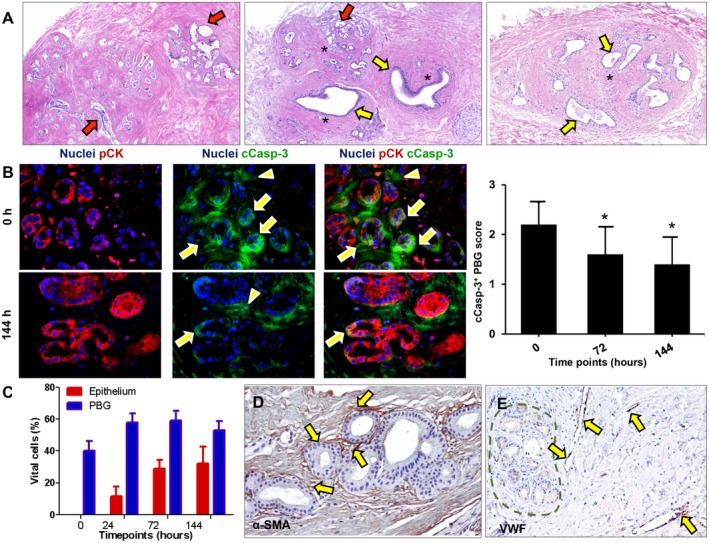
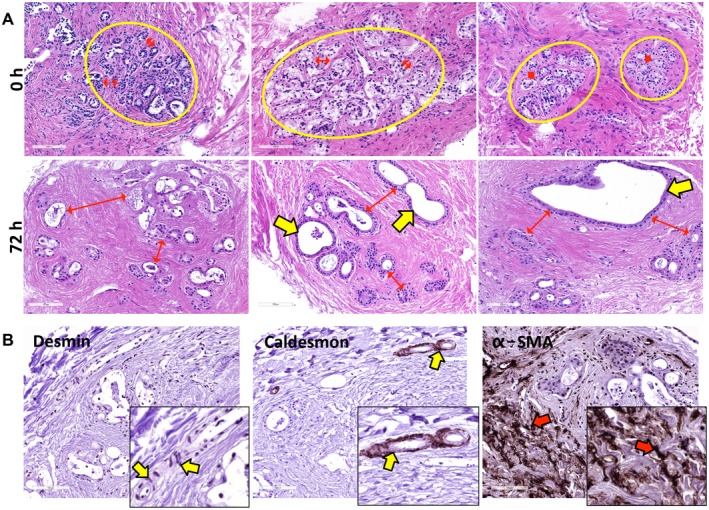
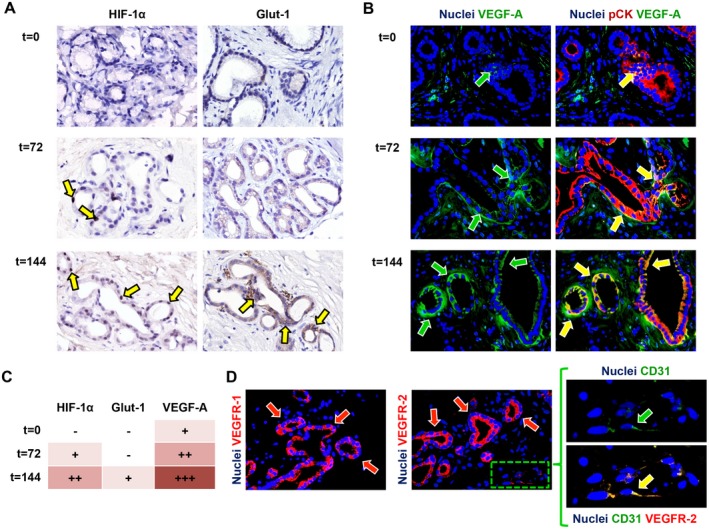
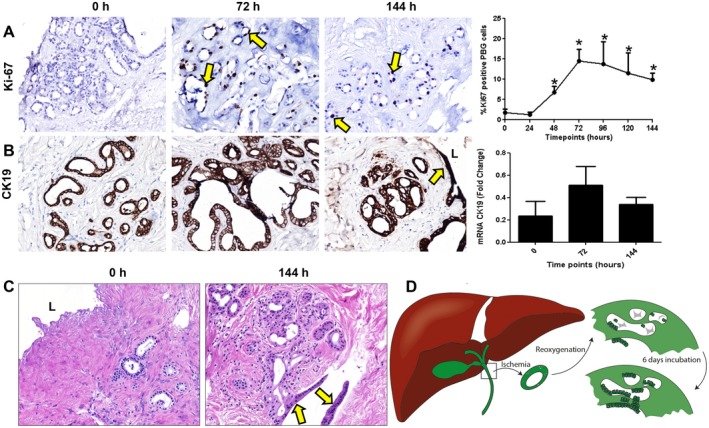
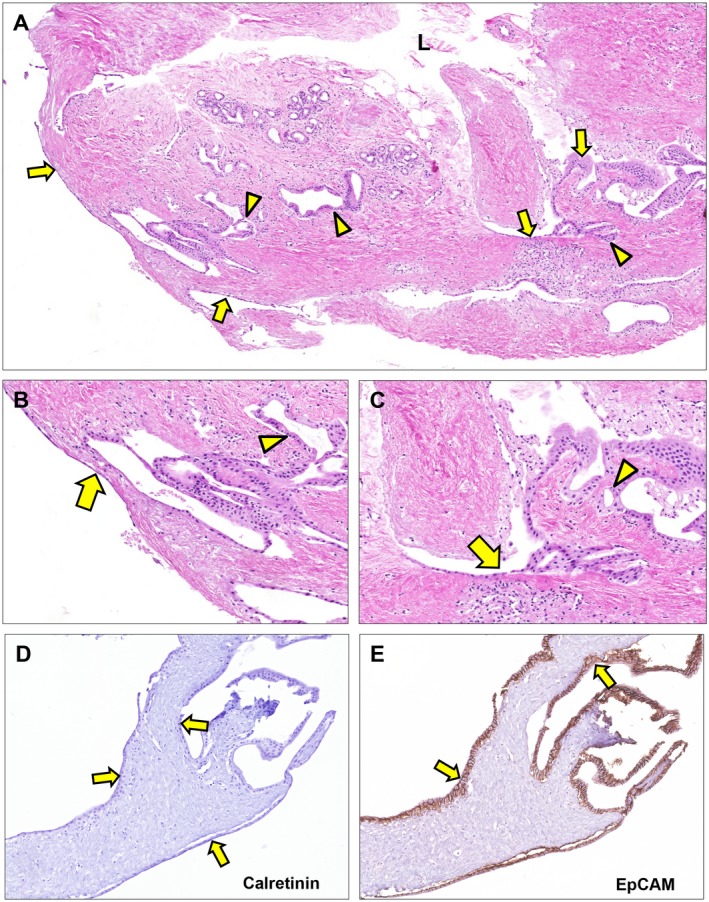
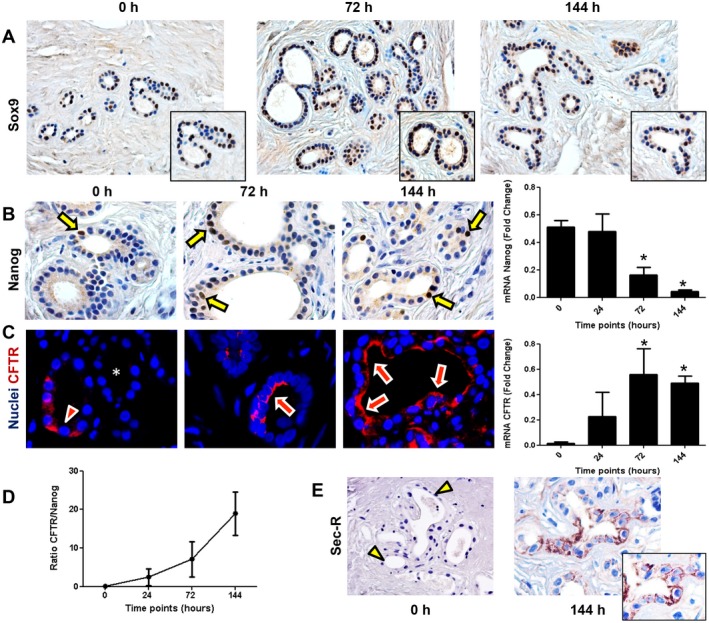
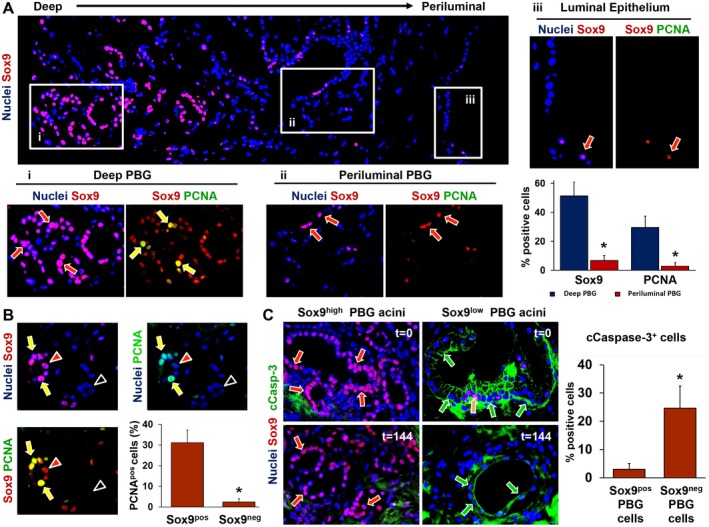
Peribiliary glands (PBG) are a source of stem/progenitor cells organized in a cellular network encircling large bile ducts. Severe cholangiopathy with loss of luminal biliary epithelium has been proposed to activate PBG, resulting in cell proliferation and differentiation to restore biliary epithelial integrity. However, formal evidence for this concept in human livers is lacking. We therefore developed an ex vivo model using precision-cut slices of extrahepatic human bile ducts obtained from discarded donor livers, providing an intact anatomical organization of cell structures, to study spatiotemporal differentiation and migration of PBG cells after severe biliary injury. Postischemic bile duct slices were incubated in oxygenated culture medium for up to a week. At baseline, severe tissue injury was evident with loss of luminal epithelial lining and mural stroma necrosis. In contrast, PBG remained relatively well preserved and different reactions of PBG were noted, including PBG dilatation, cell proliferation, and maturation. Proliferation of PBG cells increased after 24 hours of oxygenated incubation, reaching a peak after 72 hours. Proliferation of PBG cells was paralleled by a reduction in PBG apoptosis and differentiation from a primitive and pluripotent (homeobox protein Nanog+/ sex-determining region Y-box 9+) to a mature (cystic fibrosis transmembrane conductance regulator+/secretin receptor+) and activated phenotype (increased expression of hypoxia-inducible factor 1 alpha, glucose transporter 1, and vascular endothelial growth factor A). Migration of proliferating PBG cells in our ex vivo model was unorganized, but resulted in generation of epithelial monolayers at stromal surfaces. Conclusion: Human PBG contain biliary progenitor cells and are able to respond to bile duct epithelial loss with proliferation, differentiation, and maturation to restore epithelial integrity. The ex vivo spatiotemporal behavior of human PBG cells provides evidence for a pivotal role of PBG in biliary regeneration after severe injury.


Figures

Figure 1
Figure 1
Photographic details of the precision‐cut bile duct slicing procedure in chronological order. (A) A discarded liver positioned in the cold embedding unit for dissection of the large bile ducts. (B) An isolated bile duct segment including the hepatic bifurcation after dissection. A small probe is passed through the main bile duct lumen. (C) Bile duct segments embedded in cores filled with low‐melting agarose. Small segments of the bile duct are situated vertically in the agarose and indicated by arrows. (D) Krumdieck tissue slicer. (E) Bile duct slices collected in cold oxygenated Krebs‐Henseleit buffer solution. (F) 12‐well culture plate filled with Williams medium E, supplemented with glucose and antibiotics. Each well contains one precision‐cut bile duct slice (arrow).
Figure 2
Figure 2
Bile ducts that were subjected to severe ischemia and subsequent reoxygenation showed cell death and PBG dilatation. (A) Hematoxylin and eosin staining showing necrotic PBG leaving cell debris in the empty acini (red arrows). In addition, PBG dilatation occurred in specific glands (yellow arrows). In some sections, both cell death and dilatation were present in proximate PBG collections (central image). Some PBG collections were captured in a concentric formation of stromal cells (asterisks). (B) Immunofluorescence for pCK and cCasp‐3 indicated significantly less apoptosis in PBG cells after 72 hours and 144 hours of incubation compared with baseline (*P < 0.05). Cleaved caspase‐3 was expressed by the PBG cells (arrows) as well as around the PBG cells in the stroma (arrowheads). Nuclei are displayed in blue. (C) Quantification of the percentage of vital cells in PBG and epithelium showing that approximately 50% of the PBG cells appeared vital during all time points, with no significant differences over time. In contrast, no luminal epithelial cells were present at baseline, yet a growth of epithelium up to 32% apparent vital cells was evident up to 144 hours of incubation. (D) Immunohistochemistry for α‐SMA illustrates presence of myofibroblasts around PBG and provides evidence for an anatomical organization of stromal cells (arrows). (E) Immunohistochemistry for VWF in endothelial cells (arrows) indicating vessels throughout the stroma in proximity of PBG (dotted line). Dilated vessels with loss of endothelial cells can be observed. (A‐C) Original magnification ×10. (D,E) Original magnification ×20. Abbreviations: α‐SMA, alpha‐smooth muscle actin; cCasp‐3, cleaved caspase‐3; h, hours; pCK, pan cytokeratin; VWF, von Willebrand factor.
Figure 3
Figure 3
Stromal and PBG (re‐)organization during incubation. (A) At baseline, small PBG acini were organized in compact clusters (yellow circles) and were located close to each other (red arrows). After 72 hours of incubation, PBG acini showed greater distance between each other (red arrows) and evident dilatation (yellow arrows). (B) Desmin and caldesmon expression was restricted to smooth muscle cells around arteries (yellow arrows); conversely, no expression of these markers was observed in α‐SMA‐positive stromal cells (red arrows). These data confirm that the stromal reorganization around PBG clusters was characterized by α‐SMA‐positive myofibroblasts (red arrows). (B) Original magnification ×20. Abbreviations: α‐SMA, alpha‐smooth muscle actin; h, hours.
Figure 4
Figure 4
Activation of angiogenic factors during incubation. (A) Immunohistochemistry for the hypoxic response markers HIF‐1α and Glut‐1 showed up‐regulation during incubation (yellow arrows). (B) Correspondingly, VEGF‐A expression increased over time (green arrows) and was expressed by pCK‐positive PBG cells (yellow arrows). (C) Semiquantitative evaluation of angiogenic factor expression in PBG cells showed up‐regulation of HIF‐1α, Glut‐1, and VEGF‐A over time. (D) VEGF receptors VEGFR‐1 and VEGFR‐2 were expressed by PBG cells (red arrows) and CD31‐positive endothelial cells (green arrow) expressed VEGFR‐2 at their cell membrane. Area in the box is magnified on the right and separate channels are provided. (A‐C) Original magnification ×40. Abbreviations: CD31, cluster of differentiation 31; pCK, pan cytokeratin.
Figure 5
Figure 5
PBG proliferation and regeneration after ischemia‐induced epithelial cell loss. (A) Immunohistochemistry for Ki‐67 showed mitotic activity after 24 hours of incubation. PBG proliferation index increased significantly after 24 hours, peaked at 72 hours, and remained constant until 144 hours of incubation, compared with baseline (*P < 0.05). (B) Immunohistochemistry for biliary epithelial marker CK19 showed that PBG and biliary epithelium expressed CK19 during all time points. The pattern of the relative number of CK19 expressing cells resembled that of proliferation. (C) Hematoxylin and eosin staining displaying complete loss of epithelial layer at baseline and regeneration of an epithelial monolayer after 144 hours of incubation. This monolayer appeared at the surface of an open place within the stroma (yellow arrows). (D) Schematic overview and summary of the observed biliary damage and cellular reaction after ischemia and subsequent reoxygenation. After ischemia and reoxygenation, the biliary epithelium was generally detached and PBG were necrotic. Directly after reoxygenation, PBG showed cell debris in the acini with a few residual PBG cells. After 6 days of oxygenation, proliferation, refilled PBG, and regeneration of the epithelium were evident. (A) Original magnification ×10. (B,C) Original magnification ×20. Abbreviations: h, hours, L, lumen.
Figure 6
Figure 6
Epithelial regeneration after 72 hours of ex vivo culture. (A‐C) Hematoxylin and eosin staining. Epithelial lining appeared at the luminal surface as well as at the basolateral surface (arrows). These epithelial patches are in proximity of PBG (arrowheads) suggesting newly formed epithelium driven from PBG to restore the uncovered surface at several sides throughout the tissue slice. (D) Epithelial lining at basolateral and luminal side of the bile duct slice appeared negative for calretinin, which is specific for mesothelium (arrows). (E) All cells lining the basolateral and luminal side of the bile duct slice expressed EpCAM, confirming that the (re)generated monolayers consisted of epithelial cells (arrows). (A) Original magnification ×5. (B,C) Original magnification ×20. (D,E) Original magnification ×15. Abbreviation: L, lumen.
Figure 7
Figure 7
Cell maturation during 144 hours of oxygenated incubation of bile duct slices. (A) Immunohistochemistry for endoderm progenitor marker Sox9 showed expression in PBG cells at all time points. (B) Immunohistochemistry demonstrated the presence of Nanog‐positive cells at a nuclear level (arrows) within PBG. Only pluripotent and primitive cells expressed Nanog; this cell population decreased over time and was significant lower after 144 hours of incubation (*P < 0.05). (C) Immunofluorescence for CFTR, expressed by mature biliary cells, showed less evident apical expression at baseline (arrowhead) and in some PBG no expression (asterisk) compared with PBG cells after 72 hours and 144 hours of incubation (arrows). Nuclei are displayed in blue. Real‐time quantitative PCR confirmed that CFTR gene expression increased over time and was significant after 144 hours of incubation compared with baseline (*P < 0.05). (D) Ratio between CFTR and Nanog increased during incubation, indicating maturation of the viable cells in the bile duct slices. (E) Immunohistochemistry for Sec‐R. Secretin receptor expression of PBG cells appeared after 144 hours of incubation (arrow). At baseline, PBG were almost negative for secretin receptor (arrowheads). (A,E) Original magnification ×20. (B,C) Original magnification ×40. Abbreviations: h, hours; Sec‐R, secretin receptor.
Figure 8
Figure 8
Immunophenotype of deep and periluminal PBG. (A) Immunofluorescence for Sox9, which identifies endoderm‐derived progenitor cells, showed that PBG located in deeper position (i) with respect to the luminal epithelium were characterized by higher expression of Sox9 compared with PBG acini located in a periluminal position (ii) and in continuity with luminal epithelium (iii). Sox9+ cells (red arrows) coexpressed the proliferation marker PCNA, merely in the deeper‐located PBG (i: yellow arrows). Periluminal PBG showed less Sox9 expression and almost no PCNA expression (ii: red arrows). The luminal epithelium (iii) showed rare Sox9+ cells (red arrow) and negligible levels of PCNA. The corresponding graph shows that both Sox9 and PCNA expression were significantly higher in deeper PBG, compared with periluminal PBG. (B) Specifically, PBG acini with Sox9‐ cells expressed no PCNA (black arrowheads) and acini with abundant Sox9 expression stained positive for PCNA (yellow arrows). Red arrowheads point toward Sox9+ cells that were PCNA negative. Almost all PCNA+ cells were Sox9+ as displayed in the graph, confirming that the proliferating cell population consisted of mainly progenitor cells. (C) PBG harboring Sox9+ cells (red arrows) were less positive for the apoptosis marker cCasp‐3. PBG harboring mainly Sox9‐ cells and a few Sox9+ cells (yellow arrow) showed marked expression of cleaved caspase‐3 (green arrows). This was evident during all time points. Quantification of Sox9/cCasp‐3 coexpression revealed significantly higher expression of cCasp‐3 in Sox9‐ PBG cells, compared with Sox9+ PBG cells. (A) Original magnification ×10. Area in the boxes is magnified at ×20. (B,C) Original magnification ×20. Abbreviation: cCasp‐3, cleaved caspase‐3.

References

    1. Cardinale V, Wang Y, Carpino G, Cui CB, Gatto M, Rossi M, et al. Multipotent stem/progenitor cells in human biliary tree give rise to hepatocytes, cholangiocytes, and pancreatic islets. Hepatology 2011;54:2159‐2172. - PubMed
    1. Lanzoni G, Cardinale V, Carpino G. The hepatic, biliary, and pancreatic network of stem/progenitor cell niches in humans: A new reference frame for disease and regeneration. Hepatology 2016;64:277‐286. - PubMed
    1. de Jong IEM, van Leeuwen OB, Lisman T, Gouw ASH, Porte RJ. Repopulating the biliary tree from the peribiliary glands. Biochim Biophys Acta 2018;1864:1524‐1531. - PubMed
    1. Carpino G, Cardinale V, Renzi A, Hov JR, Berloco PB, Rossi M, et al. Activation of biliary tree stem cells within peribiliary glands in primary sclerosing cholangitis. J Hepatol 2015;63:1220‐1228. - PubMed
    1. Igarashi S, Sato Y, Ren XS, Harada K, Sasaki M, Nakanuma Y. Participation of peribiliary glands in biliary tract pathophysiologies. World J Hepatol 2013;5:425‐432. - PMC - PubMed

Publication types