. 2019 Jan 2;129(1):296-309.
doi: 10.1172/JCI123284. Epub 2018 Dec 3.

Bacterial sepsis triggers an antiviral response that causes translation shutdown

Affiliations

Bacterial sepsis triggers an antiviral response that causes translation shutdown

Takashi Hato et al. J Clin Invest. .

Abstract

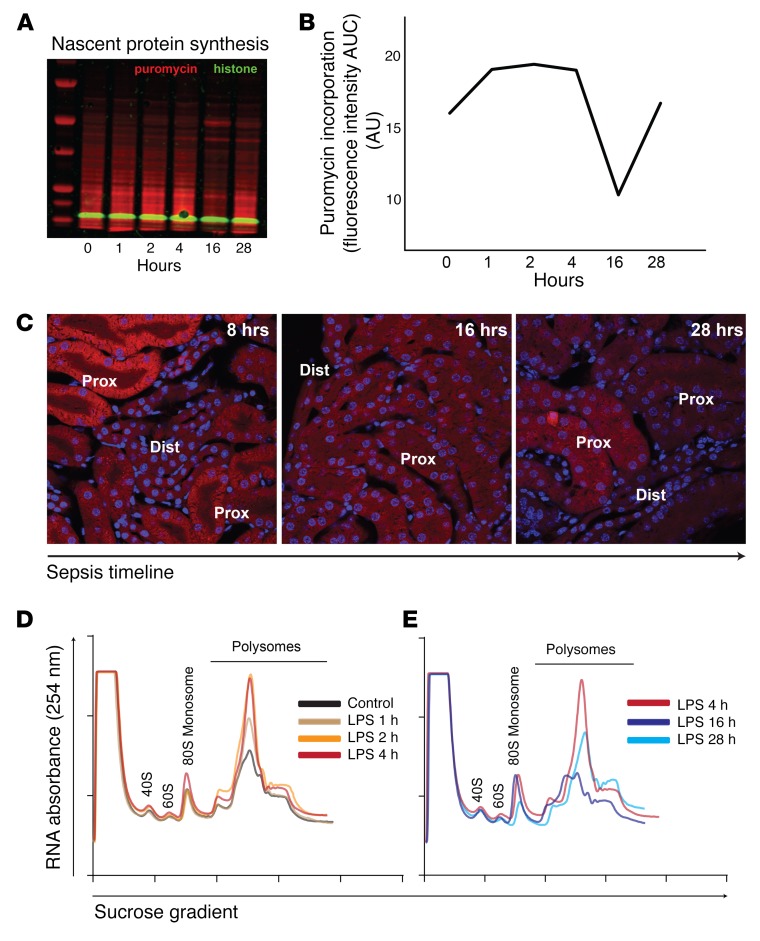
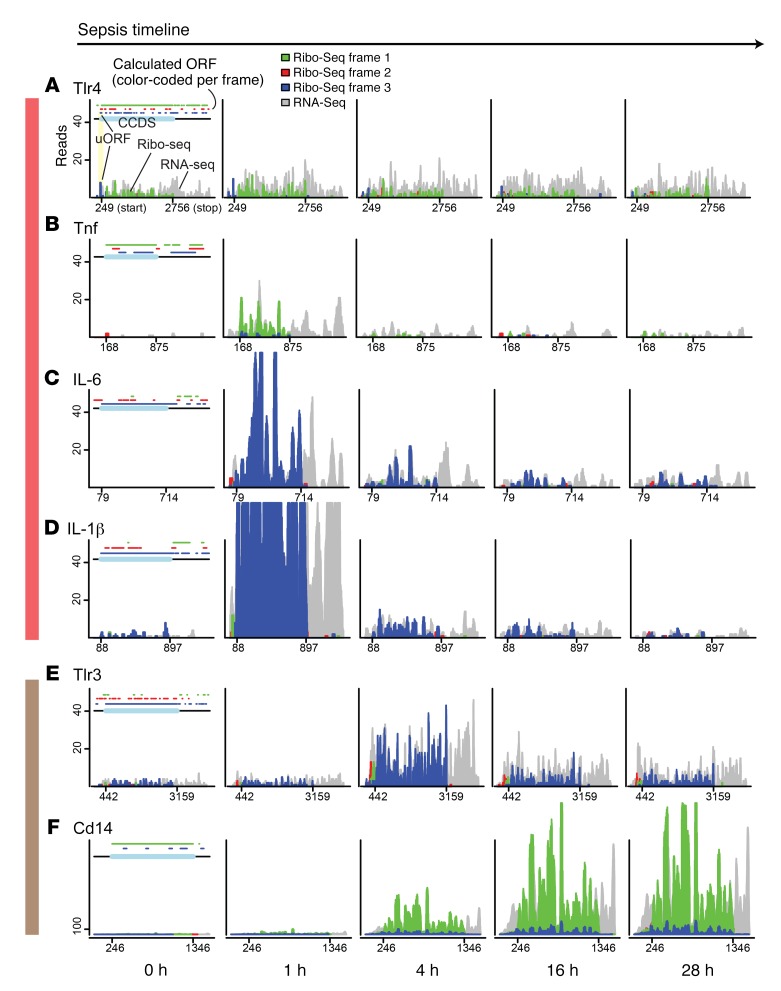
In response to viral pathogens, the host upregulates antiviral genes that suppress translation of viral mRNAs. However, induction of such antiviral responses may not be exclusive to viruses, as the pathways lie at the intersection of broad inflammatory networks that can also be induced by bacterial pathogens. Using a model of Gram-negative sepsis, we show that propagation of kidney damage initiated by a bacterial origin ultimately involves antiviral responses that result in host translation shutdown. We determined that activation of the eukaryotic translation initiation factor 2-α kinase 2/eukaryotic translation initiation factor 2α (Eif2ak2/Eif2α) axis is the key mediator of translation initiation block in late-phase sepsis. Reversal of this axis mitigated kidney injury. Furthermore, temporal profiling of the kidney translatome revealed that multiple genes involved in formation of the initiation complex were translationally altered during bacterial sepsis. Collectively, our findings imply that translation shutdown is indifferent to the specific initiating pathogen and is an important determinant of tissue injury in sepsis.

Keywords: Inflammation; Nephrology; Proteomics; Translation.


Conflict of interest statement

Conflict of interest: The authors have declared that no conflict of interest exists.

Figures

Figure 1
Figure 1. Sepsis causes a biphasic translation derangement.
(A and B) Time-course analysis of global protein synthesis in a murine model of sepsis (LPS, 5 mg/kg tail vein, i.v.), as determined by incorporation of puromycin to growing polypeptide chains in vivo. Kidneys were harvested 30 minutes after puromycin administration at various time points in the sepsis timeline. Representative Western blot and its quantification are shown. (C) Imaging of nascent protein synthesis in kidney tissues using O-propargyl-puromycin (OPP), an alkyne analog of puromycin, in vivo. Alexa Fluor 555–azide was conjugated to OPP by copper(I)-catalyzed azide-alkyne cycloaddition (Click chemistry). Prox, proximal tubules; dist, distal tubules/collecting ducts. Original magnification, ×60. (D and E) Polysomal profiling of kidney extracts from mice treated with LPS for indicated durations. Cycloheximide was injected at the time of sacrifice to prevent the release of ribosomes from the cognate mRNA. Ribosomal subunit 40S, 60S, mono-ribosome (80S), and polyribosomes were separated using sucrose density gradient. (D) Increased mono-ribosome and poly-ribosome signals indicating increased protein synthesis are observed in the early phases of sepsis (LPS, 1, 2, and 4 hours). (E) Increased mono-ribosome, but decreased poly-ribosome, fractions indicating initiation block and decreased protein synthesis are observed 16 hours after LPS administration. Representative UV absorbance traces from each time point are overlaid, and for comparison, an identical trace (LPS, 4 hours) is shown in both D and E. Polysome-to-monosome ratios: 3.0, 3.5, 4.7, 3.1, 1.9, and 3.7 at 0, 1, 2, 4, 16, and 28 hours, respectively.
Figure 2
Figure 2. Translation shutdown as determined by nascent proteomics.
(A) Overview of nascent proteomics protocol. (B) Approximately 6,000 proteins were identified using label-free quantitative mass spectrometry (Supplemental Tables 1 and 2). Principal component analysis biplot illustrating relationships between experimental groups (black) and individual nascent proteins (red) in the 2D space (PC1, PC2). n = 3 for each time point. Median protein values are used for data display.
Figure 3
Figure 3. Multiple metabolic pathways are affected by translation shutdown during late-phase sepsis.
(A and B) Nascent proteins detected are mapped to the KEGG TCA cycle and peroxisome pathways. Arrowheads point to Acod1/Irg1 and Nos2. (C and D) Representative HPLC chromatograms of kidney tissue nucleotides and quantitation of nucleotide ratios are shown. n = 3 per condition. P values determined by Student’s t test (2 sided, nonpaired). Error bars show SD.
Figure 4
Figure 4. Translatome time course reveals propagation of TLR4-mediated signaling.
(AF) Ribo-Seq analysis of select genes under indicated conditions. Details for data visualization strategy are described in Supplemental Figure 2. RNA-Seq reads (gray) and Ribo-Seq reads (red, blue, green) were mapped to the mouse transcriptome. The x axes denote mRNA positions (position 1 is the start of 5′ UTR and x-max position is the end of 3′ UTR). The y axes denote read coverage. Green, red, and blue colors in the histogram correspond to ribosome frames 1, 2, and 3, respectively. On the top of each control figure (0 hour), calculated ORF positions (defined by ATG start codon, TAG/TAA/TGA stop codons) and their associated frame colors as determined by modulo operation are shown. Annotated CCDS is highlighted in light blue on the top, and its start and stop positions are shown on the x axis. When multiple isoforms are present, a protein coding transcript with best curated isoform is shown (e.g., gold transcript in Ensembl). All read lengths are displayed (median, 29 nt). The color-coded vertical bars (red, brown) correspond to pathways highlighted in Figure 5J.
Figure 5
Figure 5. Propagation of TLR4-mediated signaling elicits antiviral response pathways.
(AI) Ribo-Seq analysis of select genes involved in viral response and Eif2ak2 (PKR) activation. Ribo-Seq reads (red, green, blue) are superimposed as a front layer over RNA-Seq reads (gray). (J) Schematic of TLR4-mediated signaling pathways is shown. The background colors correspond to the colors of vertical bars in Figure 4 (red, brown) and Figure 5 (beige, blue).
Figure 6
Figure 6. Translation shutdown mediated by the Eif2ak2/Eif2α axis contributes to sepsis-induced kidney injury.
(A) Mice were treated with 5 mg/kg LPS i.v. for indicated durations, and kidneys were analyzed by Western blot for Eif2ak2, Eif2α, and Ser51 p-Eif2α (arrow). (B) Select protein levels as determined by nascent proteomics are shown. (C and D) In vivo effects of ISRIB (5 mg/kg i.p.) on protein synthesis (puromycin incorporation in the kidney; ISRIB for 16 hours) and tissue expression of Eif2ak2, Eif2α, and p-Eif2α (kidneys harvested 16 hours after 5 mg/kg LPS i.v. with or without ISRIB i.p. for 16 hours). LPS increased Eif2ak2 and p-Eif2α. This increase was not affected by ISRIB. (E) Serum creatinine levels 24 hours after LPS with or without ISRIB treatment administered at indicated time points. *P < 0.05 vs. LPS without ISRIB treatment by Student’s t test (2 sided, nonpaired). Error bars show SD.
Figure 7
Figure 7. ISRIB reverses the effect of p-Eif2α on translation.
(A) Ribo-Seq analysis of kidney extracts from mice treated with LPS for 16 hours with or without ISRIB. Smear plot in which top 10 differentially translated genes are highlighted in red (edgeR exactTest with BH adjusted P values < 0.05, n = 3 per condition). The x axis denote mean log counts per million (logCPM), and the y axis denotes log fold change (logFC). ISRIB was administered 1 hour after LPS. (B and C) Comparative translatome count values mapped to the TCA cycle and peroxisome pathways. (D) S1 proximal tubules from kidneys of control or septic mice were laser microdissected. Original magnification, ×60. Glom, glomerulus. (E) S2/S3 proximal tubules from indicated conditions were manually microdissected. Original magnification, ×5. (F and G) Transcriptomics analysis was performed on S1 and S2/S3 segments (n = 4 for each condition). Select gene expression levels are shown. P values were determined by Student’s t test (2 sided, nonpaired). The boxplot middle line shows the median, the box edges show the 25th and 75th percentiles, and the whiskers show the ×1.5 interquartile range.
Figure 8
Figure 8. Multiple mechanisms contribute to translation shutdown in late-phase sepsis.
(AF) Ribo-Seq analysis of select genes involved in translation (in mice). (A) For clarity, the layer order for Eif4e was reversed, with RNA-Seq reads (gray) shown as front layer (right 2 panels). (G) Schematic of the 5′ cap initiation complex.
Figure 9
Figure 9. Eif2ak2 expression is increased in the kidneys of septic patients.
(AI) RNA-Seq was performed on archived human kidney biopsy samples with final pathologic diagnosis of ATN. These samples were divided into 2 groups based on clinical information: sepsis-related AKI and non–sepsis-related AKI (referred to as others; Supplemental Table 3). Sepsis* refers to 1 patient in the sepsis-related AKI group who had prolonged and repeated episodes of sepsis. Serum creatinine from these patients is shown in J. P values were determined by Student’s t test (2 sided, nonpaired). The boxplot middle line shows the median, the box edges show the 25th and 75th percentiles, and the whiskers show ×1.5 interquartile range. (K) Overview of human kidney biopsy analysis.

Comment in

References

    1. Angus DC, van der Poll T. Severe sepsis and septic shock. N Engl J Med. 2013;369(21):2063. - PubMed
    1. Uchino S, et al. Acute renal failure in critically ill patients: a multinational, multicenter study. JAMA. 2005;294(7):813–818. doi: 10.1001/jama.294.7.813. - DOI - PubMed
    1. Lai TS, et al. Risk of developing severe sepsis after acute kidney injury: a population-based cohort study. Crit Care. 2013;17(5):R231. doi: 10.1186/cc13054. - DOI - PMC - PubMed
    1. Takasu O, et al. Mechanisms of cardiac and renal dysfunction in patients dying of sepsis. Am J Respir Crit Care Med. 2013;187(5):509–517. doi: 10.1164/rccm.201211-1983OC. - DOI - PMC - PubMed
    1. Stearns-Kurosawa DJ, Osuchowski MF, Valentine C, Kurosawa S, Remick DG. The pathogenesis of sepsis. Annu Rev Pathol. 2011;6:19–48. doi: 10.1146/annurev-pathol-011110-130327. - DOI - PMC - PubMed

Publication types

Substances