. 2019 Jan 2;129(1):281-295.
doi: 10.1172/JCI122595. Epub 2018 Dec 3.

Lipin 2/3 phosphatidic acid phosphatases maintain phospholipid homeostasis to regulate chylomicron synthesis

Affiliations

Lipin 2/3 phosphatidic acid phosphatases maintain phospholipid homeostasis to regulate chylomicron synthesis

Peixiang Zhang et al. J Clin Invest. .

Abstract

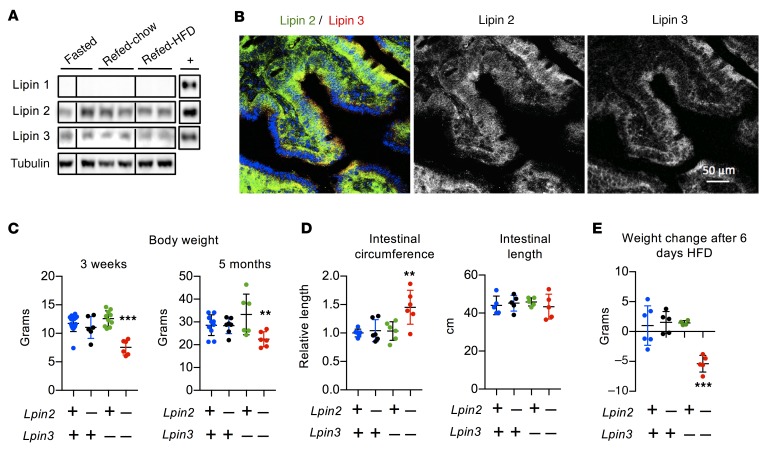
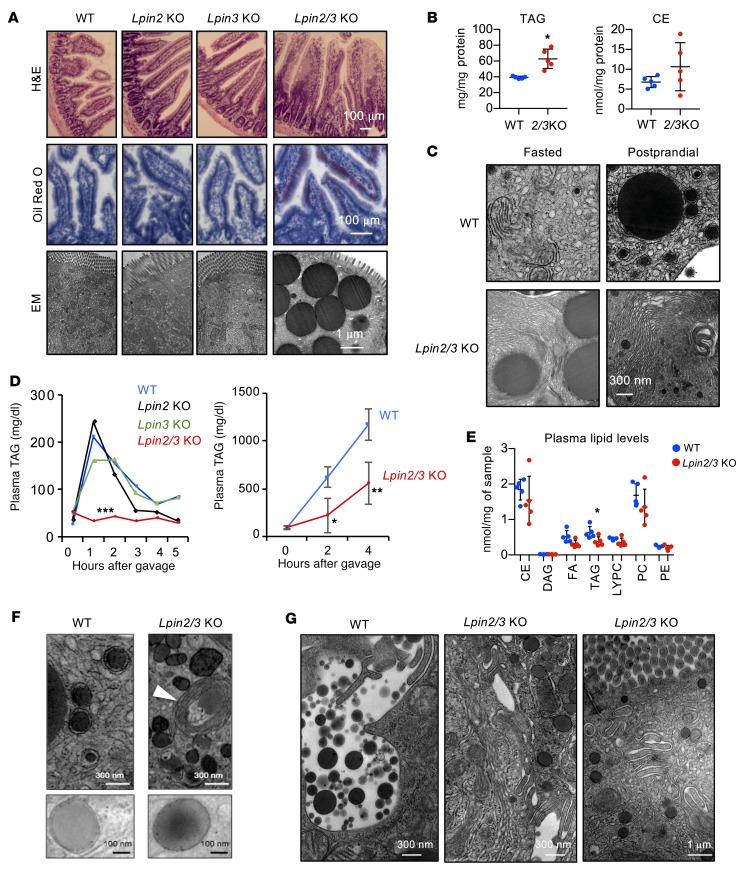
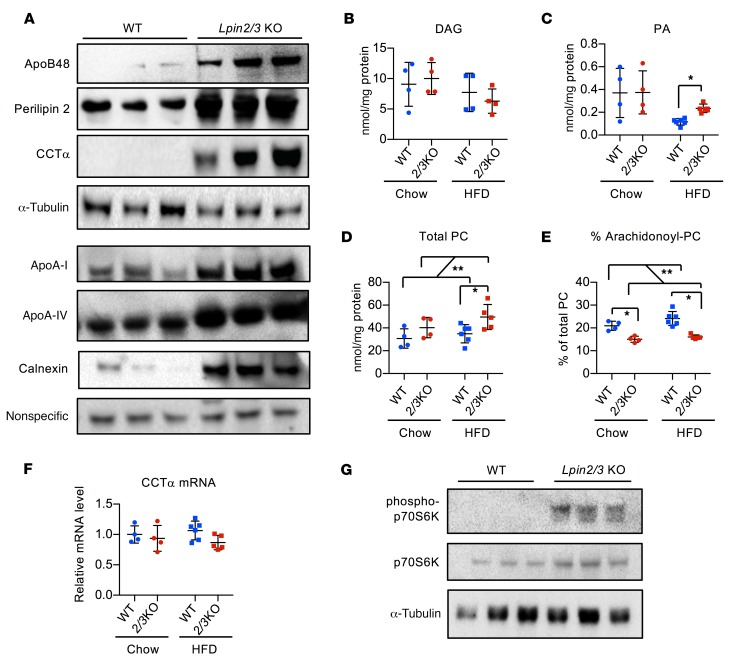
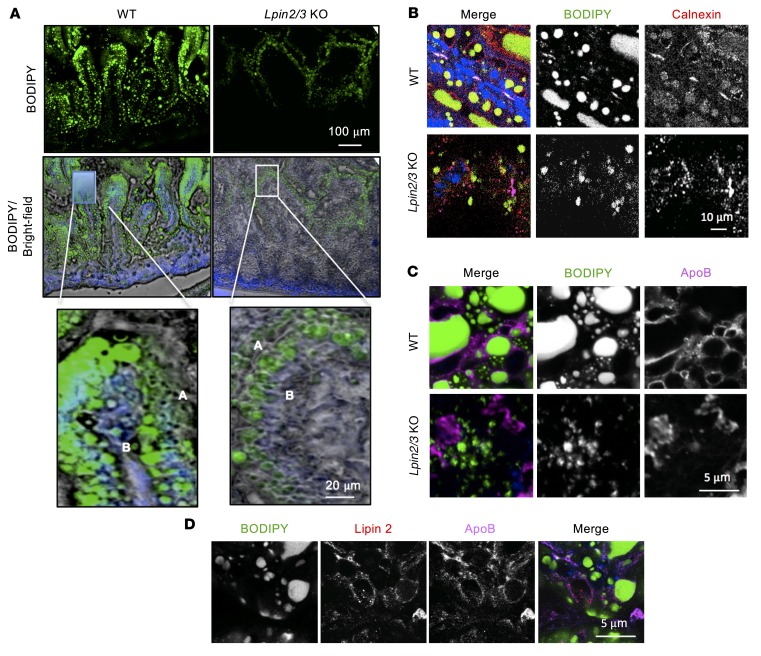
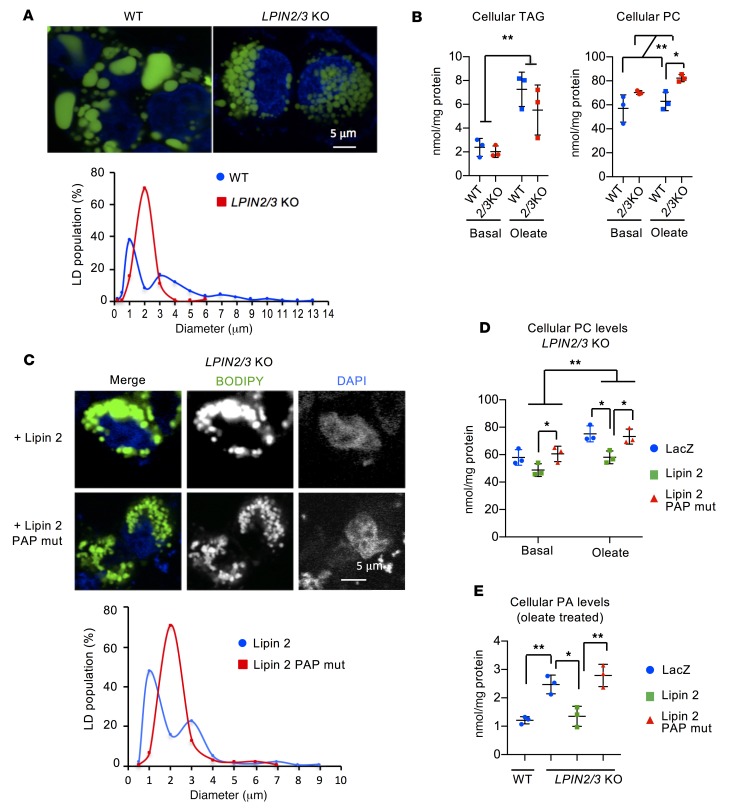
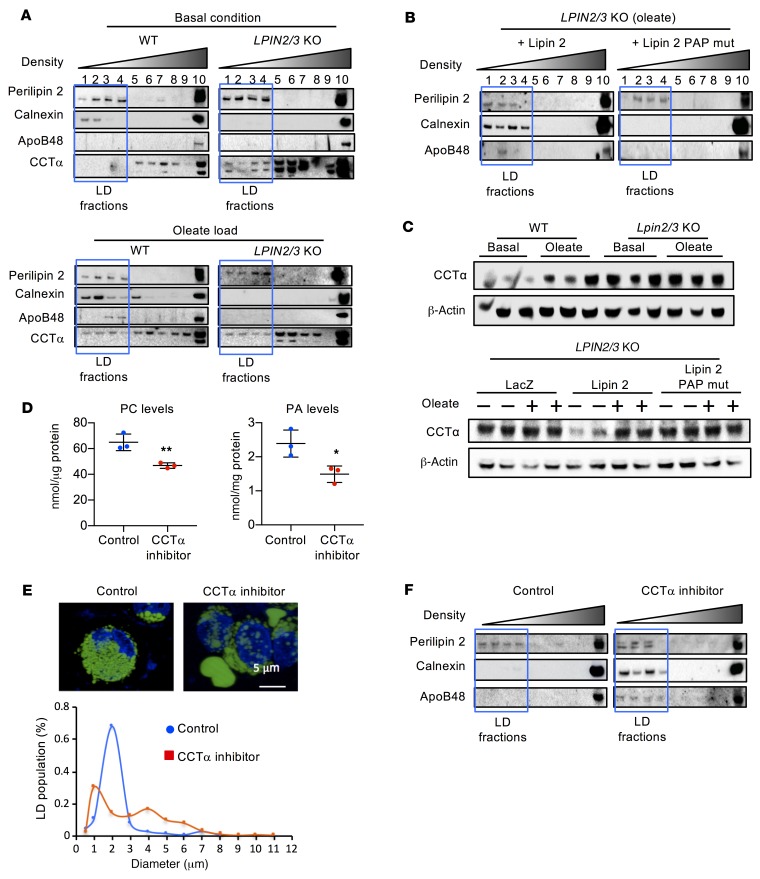
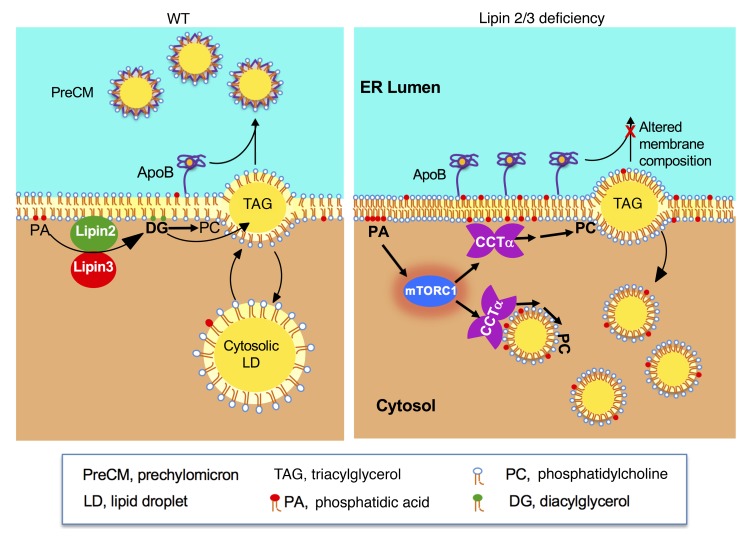
The lipin phosphatidic acid phosphatase (PAP) enzymes are required for triacylglycerol (TAG) synthesis from glycerol 3-phosphate in most mammalian tissues. The 3 lipin proteins (lipin 1, lipin 2, and lipin 3) each have PAP activity, but have distinct tissue distributions, with lipin 1 being the predominant PAP enzyme in many metabolic tissues. One exception is the small intestine, which is unique in expressing exclusively lipin 2 and lipin 3. TAG synthesis in small intestinal enterocytes utilizes 2-monoacylglycerol and does not require the PAP reaction, making the role of lipin proteins in enterocytes unclear. Enterocyte TAGs are stored transiently as cytosolic lipid droplets or incorporated into lipoproteins (chylomicrons) for secretion. We determined that lipin enzymes are critical for chylomicron biogenesis, through regulation of membrane phospholipid composition and association of apolipoprotein B48 with nascent chylomicron particles. Lipin 2/3 deficiency caused phosphatidic acid accumulation and mammalian target of rapamycin complex 1 (mTORC1) activation, which were associated with enhanced protein levels of a key phospholipid biosynthetic enzyme (CTP:phosphocholine cytidylyltransferase α) and altered membrane phospholipid composition. Impaired chylomicron synthesis in lipin 2/3 deficiency could be rescued by normalizing phospholipid synthesis levels. These data implicate lipin 2/3 as a control point for enterocyte phospholipid homeostasis and chylomicron biogenesis.

Keywords: Lipoproteins; Metabolism; Mouse models.


Conflict of interest statement

Conflict of interest: The authors have declared that no conflict of interest exists.

Figures

Figure 1
Figure 1. Lipin 2 and lipin 3 in mouse small intestine.
(A) Immunoblot analysis of lipins 1, 2, and 3 in proximal small intestine (duodenum). Mice were fasted for 16 hours or were fasted 16 hours and refed 4 hours with a chow or high-fat diet (HFD), as indicated. Recombinant protein controls are shown in the right column (+). Lanes were all on the same blot, but noncontiguous, as indicated by vertical lines. This experiment is representative of 3 studies of lipin protein levels in small intestine from fasted mice, and 1 experiment in mice that were refed chow or HFD. (B) Localization of endogenous lipin 2 (green) and lipin 3 (red) in mouse duodenum shown by confocal fluorescence microscopy. Duodenum was collected from mice fasted for 5 hours. (C and D) Lpin2/3-KO mice (Lpin2–/– Lpin3–/–) have reduced body weight (shown for 3 weeks and 5 months of age), increased intestinal circumference, and normal intestinal length compared with WT, Lpin2-KO, or Lpin3-KO mice. Data shown are average ± SD, n = 6–9/group. (E) Body-weight change in mice fed HFD for 6 days. Average ± SD, n = 4–6/genotype. **P < 0.01, ***P < 0.001 vs. other groups by ANOVA.
Figure 2
Figure 2. Impaired postprandial hyperlipidemia in Lpin2/3-KO mice.
(A) Upper: Hyperplastic intestinal villi in Lpin2/3-KO mice (H&E stain). Middle: Neutral lipid engorgement in intestinal epithelial cells in Lpin2/3-KO mice (oil red O stain). Lower: Electron micrographs show accumulation of cytosolic lipid droplets in enterocytes of fasted Lpin2/3-KO mice. Representative images from n = 2–3 mice/genotype. (B) TAG and cholesterol ester (CE) concentrations in proximal intestine of WT and Lpin2/3-KO (2/3KO) mice. Data shown are average ± SD, n = 5/group. *P < 0.05 vs. WT by t test. FA, fatty acid; PC, phosphatidylcholine; LYPC, lyso-PC; PE, phosphatidylethanolamine. (C) Electron micrographs showing amplification of ER membranes in Lpin2/3-KO intestine, present in both fasted and postprandial states, and never detected in WT intestine. (D) Left: Analysis of postprandial hyperlipidemia in mice receiving oil gavage at time 0; n = 4–6/genotype. Right: Postprandial hyperlipidemia in mice pretreated with tyloxapol by tail vein injection before oil gavage. Average ± SD, n = 3/group. *P < 0.05; **P < 0.01; ***P < 0.001 vs. other groups by ANOVA. (E) Plasma lipids were quantified by electrospray ionization–tandem mass spectrometry in mice after a 5-hour fast. Average ± SD, n = 5/genotype. *P < 0.05 vs. WT by t test. (F) Electron micrographs of proximal small intestine showing ER luminal lipid droplets or prechylomicron particles in WT mice and lipid droplets exclusively in the cytoplasm in Lpin2/3-KO mice. Note empty membrane stacks in Lpin2/3-KO mice (white arrowhead). Representative images from 3 mice/genotype. (G) Electron micrographs showing release of mature chylomicrons into the intercellular space in WT mice 2 hours after oil gavage. Junctions between Lpin2/3-KO cells remain intact with no evidence of chylomicron release. Representative electron micrographs from 3 mice/genotype.
Figure 3
Figure 3. Increased levels of phospholipids and chylomicron-associated proteins in Lpin2/3-KO intestine.
(A) Immunoblot analysis of intestinal protein levels for apolipoproteins apoB48, apoA-I, and apoA-IV, lipid droplet protein perilipin 2, phospholipid synthetic enzyme CCTα, and ER protein calnexin. Mice were fed a high-fat diet for 6 days. WT, wild-type. All panels are the same protein samples. The top 4 blots were run contemporaneously, with α-tubulin as a normalization control. The lower 4 blots were run contemporaneously with a nonspecific protein band as a normalizing control. Three biological replicates of each genotype are shown, and are representative of 5–8 samples of each genotype. (BD) Proximal intestinal lipidomics analysis by electrospray ionization–tandem mass spectrometry in mice maintained on chow diet or fed a high-fat diet (HFD) for 6 days. Average ± SD, n = 4–6. (E) Altered PC composition in Lpin2/3-KO intestine, with reduced proportion of arachidonyl-PC species compared with WT. Average ± SD, n = 4–6. (F) CCTα (Pcyt) mRNA levels in intestine from mice indicated. Average ± SD, n = 4–6. (G) Immunoblot analysis of the mTORC1 target, p70S6 kinase, in intestine. Total and phosphorylated p70S6 kinase (Thr 389) were detected by specific antibodies. Blots were run contemporaneously with the same protein samples. *P < 0.05; **P < 0.01 by ANOVA.
Figure 4
Figure 4. Aberrant lipid compartmentalization in response to an acute fat load in Lpin2/3-KO intestine.
(A) Distribution of fluorescence in proximal small intestine of mice 2 hours after oral gavage of oil containing BODIPY-labeled fatty acids. Upper: Fluorescence image of lipid droplet (LD) distribution. Middle: Overlay of fluorescence image and bright field with DAPI nuclear stain (blue). Lower: Enlarged image of single villus tip showing LD localization to both apical (A) and basolateral (B) regions of enterocytes in WT enterocytes (left) and primarily to the apical region in Lpin2/3-KO enterocytes (right). Representative of 2 experiments. (B) LDs marked by BODIPY (green) associate with the ER protein calnexin in the proximal small intestine of WT but not Lpin2/3-KO mice. The image was taken 2 hours after oil gavage with BODIPY-labeled fatty acids. Nuclei are stained blue with DAPI. (C) ApoB associates with LDs in WT but not in Lpin2/3-KO enterocytes. Image taken 2 hours after oil gavage with BODIPY-labeled fatty acids. (D) Partial colocalization of lipin 2 and apoB proteins on the surface of LDs in the proximal small intestine of WT mice. The image was taken 2 hours after oil gavage with BODIPY-labeled fatty acids.
Figure 5
Figure 5. PAP activity from lipins 2 and 3 is required for normal lipid droplet size distribution and PC levels in enterocytes.
(A) Lipins 2 and 3 are required for normal lipid droplet (LD) size and distribution. Upper: Fluorescence image of LDs in enterocyte-like HT-29 cells 24 hours after loading with 400 μM oleate containing BODIPY-labeled fatty acids. Nuclei are stained with DAPI (blue). Lower: Size distribution of LDs from experiment depicted in upper panel. Diameters of LDs from at least 30 cells of each genotype were measured. (B) Lipins 2 and 3 do not influence TAG levels but do influence PC levels in HT-29 intestinal cells after acute fatty acid loading. Cellular TAG and PC were quantified under basal culture conditions and after loading with oleate for 24 hours. Average ± SD, n = 3. *P < 0.05; **P < 0.01 by t test (left) or ANOVA (right). (C) Restoration of lipin 2 PAP activity to LPIN2/3-KO HT-29 cells normalizes LD size distribution. Upper: Fluorescence image of LDs in LPIN2/3-KO HT-29 cells transfected with WT lipin 2 expression vector or lipin 2 mutant lacking PAP and possessing coactivator activity. Lower: Size distribution of LDs from the experiment depicted in the upper panel. Not shown: red fluorescence derived from cotransfection with Sec61–cherry was used to identify cells successfully transfected with lipin 2, and only those cells were assessed for LD size. (D and E) Lipin 2 PAP activity restores PC and PA in LPIN2/3-KO HT-29 cells. LPIN2/3-KO cells were infected with adenovirus expressing LacZ, WT lipin 2, or PAP-mutant lipin 2. Cellular PC and PA were quantified in cells cultured in basal medium or with oleate for 24 hours. Average ± SD, n = 3. *P < 0.05; **P < 0.01 by ANOVA.
Figure 6
Figure 6. Lipin PAP activity is required for apoB48 association with lipid for chylomicron assembly.
(A) Analysis of apoB48 association with lipids by density gradient centrifugation followed by immunoblot to detect proteins across fractions. The lipid droplet–containing (LD-containing) fractions (outlined by blue box) were defined by the presence of perilipin 2. In WT cells, lipids were associated with the ER (calnexin), and apoB48 was present in LD fractions after oleate loading. In LPIN2/3-KO cells, neither apoB48 nor calnexin was present in LD fractions, even after oleate loading. Additionally, CCTα levels were elevated and appeared in the LD fractions even under basal conditions, which was not observed in WT cells. (B) Lipin PAP activity is required for apoB48 association with lipids in intestinal cells. LPIN2/3-KO cells were infected with adenovirus expressing WT lipin 2 or PAP-mutant lipin 2. Cells loaded with oleate were assessed for the presence of apoB48 in LD fractions. (C) Lipin PAP activity modulates CCTα protein levels. Elevated CCTα protein levels in LPIN2/3-KO cells under basal culture conditions are normalized by introduction of adenoviral vectors for WT, but not PAP-mutant, lipin 2. (D) CCTα inhibitor reduces PC and PA levels in WT HT-29 cells. Average ± SD, n = 3. *P < 0.05, **P < 0.01 by t test. (E) Fluorescence image (upper) and size distribution (lower) of LDs in LPIN2/3-KO HT-29 cells loaded with oleate without or with addition of CCTα inhibitor. n ≥ 30. Nuclei are stained with DAPI (blue). (F) CCTα inhibitor restores calnexin and apoB48 association with lipid-containing fractions from LPIN2/3-KO cells loaded with oleate. Blots shown throughout this figure are each representative of a single experiment, but the experiments in panels AC and F are each variations of a similar experiment, such that in composite, the patterns for WT and Lpin2/3-KO mice were each replicated in at least 3 independent trials. Blots in A, C, and F were run with the same samples contemporaneously.
Figure 7
Figure 7. Proposed role of lipins 2 and 3 in intestinal chylomicron (CM) production.
Left: In WT enterocytes, TAG synthesized in the ER membrane may bud into the cytosol for storage as lipid droplets (LDs) or into the ER lumen to associate with apoB48 through the action of microsomal TAG transfer protein. The resulting prechylomicron particles (PreCMs) ultimately bud from the ER. In steps not shown, these lipoproteins subsequently mature in the Golgi and are released from enterocytes as mature CMs. Right: In the absence of lipin 2/3 PAP activity, the lipin substrate phosphatidic acid (PA) accumulates at membrane sites in the ER (and possibly additional cell membranes). Elevated PA may activate mTORC1, which enhances CCTα levels by increasing protein stability or translation. Increased CCTα contributes to elevated PC levels and altered membrane phospholipid composition and impaired PreCM formation. TAG-rich lipid droplets accumulate in the cytoplasm rather than contribute to CM formation.

Comment in

Similar articles

Cited by

References

    1. D’Aquila T, Hung YH, Carreiro A, Buhman KK. Recent discoveries on absorption of dietary fat: Presence, synthesis, and metabolism of cytoplasmic lipid droplets within enterocytes. Biochim Biophys Acta. 2016;1861(8 Pt A):730–747. - PMC - PubMed
    1. Abumrad NA, Davidson NO. Role of the gut in lipid homeostasis. Physiol Rev. 2012;92(3):1061–1085. doi: 10.1152/physrev.00019.2011. - DOI - PMC - PubMed
    1. Sturley SL, Hussain MM. Lipid droplet formation on opposing sides of the endoplasmic reticulum. J Lipid Res. 2012;53(9):1800–1810. doi: 10.1194/jlr.R028290. - DOI - PMC - PubMed
    1. Mansbach CM, Siddiqi S. Control of chylomicron export from the intestine. Am J Physiol Gastrointest Liver Physiol. 2016;310(9):G659–G668. doi: 10.1152/ajpgi.00228.2015. - DOI - PubMed
    1. Pan X, Hussain MM. Gut triglyceride production. Biochim Biophys Acta. 2012;1821(5):727–735. - PMC - PubMed

Publication types

MeSH terms