. 2018 Dec 3;14(12):e1006393.
doi: 10.1371/journal.pcbi.1006393. eCollection 2018 Dec.

A comprehensive ensemble model for comparing the allosteric effect of ordered and disordered proteins

Affiliations

A comprehensive ensemble model for comparing the allosteric effect of ordered and disordered proteins

Luhao Zhang et al. PLoS Comput Biol. .

Abstract

Intrinsically disordered proteins/regions (IDPs/IDRs) are prevalent in allosteric regulation. It was previously thought that intrinsic disorder is favorable for maximizing the allosteric coupling. Here, we propose a comprehensive ensemble model to compare the roles of both order-order transition and disorder-order transition in allosteric effect. It is revealed that the MWC pathway (order-order transition) has a higher probability than the EAM pathway (disorder-order transition) in allostery, suggesting a complicated role of IDPs/IDRs in regulatory proteins. In addition, an analytic formula for the maximal allosteric coupling response is obtained, which shows that too stable or too unstable state is unfavorable to endow allostery, and is thus helpful for rational design of allosteric drugs.


Conflict of interest statement

The authors have declared that no competing interests exist.

Figures

Fig 1
Fig 1. Schematic diagram of MWC, KNF and EAM models.
(a) The MWC model for hemoglobin [3]. All four subunits are simultaneously in either an R (Relaxed) state (with a higher affinity for O2) or a T (Tense) state (with a lower affinity for O2). The cooperative effect happens when one O2 binds to the all-R state, shifts the chemical balance from all-T to all-R, then creates more favorable binding sites for subsequent O2. (b) The KNF model for hemoglobin [4]. It allows several intermediate states keeping balanced by several chemical equilibrium constants. (c) The EAM model for a two-domain protein [12]. Each domain can be in either an R (Relaxed) state or an I (Disordered) state, resulting in four possible combinations for protein states: RR, RI, IR and II. The corresponding probability Pi of four states is related to their free energy ΔGi (relative to the RR state) as Pi=eΔGi/RT/Q where Q is the sum of statistical weights as Q=ieΔGi/RT. The free energy ΔGi were listed in the graphics, where ΔGI and ΔGII are the free energy of unfolding the R state of each domain, and Δgint is the free energy of breaking the interface interactions of ordered complex (RR). One domain (blue) in the R state can bind the allosteric ligand (A) while the other domain (yellow) in the R state can bind the substrate (B). The I state of each domain has no affinity to ligand and substrate.
Fig 2
Fig 2. Schematic representation of the proposed comprehensive ensemble model, which compounds the assumptions of both the MWC and the EAM models.
Each domain (blue and yellow) can be in R (Relaxed), T (Tensed) and I (Disordered) state. R and T are incompatible as assumed in the MWC model, and thus there are now seven possible combinations for protein states. Similar to the EAM model, the disordered I state of a domain does not have any interface interaction with the adjacent domain, and it does not bind to any ligand or substrate due to the lack of ordered structures. The expressions for the free energy (ΔGi) of each state (relative to RR as the reference state as that in the EAM model) were listed in the absence of ligand and substrate. ΔGR1 and ΔGR2 are the free energy of unfolding the R state of each domain, and Δgint,R and Δgint,T are the free energy of breaking the interface interactions in RR and TT, respectively, which were defined in a manner similar to the EAM model. ΔGRT1 and ΔGRT2 are the free-energy of the R-T transition for each domain. A is allosteric regulation ligand binding to one (blue) domain, and B is the substrate to the other (yellow) domain. A and B are different molecules, i.e., we consider the heterotropic allosteric effect. To enable both positive and negative allosteric effect for ordered proteins, we consider two binding modes for A: it can only bind to the R state of the blue domain (A-R binding mode) (as depicted here), or can only bind to the T state of the blue domain (A-T binding mode). B always binds only to the R state of the yellow domain.
Fig 3
Fig 3. Three allosteric subsystems/pathways in the comprehensive ensemble model.
The arrows indicate the population shifts caused by ligand binding which are capable of affecting the substrate binding (see text for details). The A-R binding mode is assumed here. The contribution ratios of pathways to the allostery of the comprehensive system are given in Eqs (4–7).
Fig 4
Fig 4. The allosteric coupling response (CR) of the comprehensive ensemble model.
(a,b) CR as a function of Δgint,R and Δgint,T (in kcal/mol) when the other parameters are fixed (chosen to produce notable allostery) as: ΔGR1 = −1.0, ΔGR2 = 1.3, ΔGRT1 = 1.0, ΔGRT2 = 3.0 (all in units of kcal/mol). Note that for A-T binding mode there is no activated allosteric effect. (c,d) Distribution of CR when the stability free-energy parameters (ΔGR1, ΔGR2, ΔGRT1, ΔGRT2, Δgint,R, Δgint,T) vary randomly with an equal probability density between −8 and +8 kcal/mol. The A-R binding mode is adopted in (a,c) and the A-T binding mode is adopted in (b,d) with ΔgLig,A = −3 cal/mol.
Fig 5
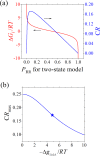
Fig 5. Limits of CR.
(a) The relations among PRR, ΔGi and CR for the MWC model with two states, plotted according to Eqs 8 and 9. (b) The CR maximum (via optimizing state stabilities of proteins) as a function of −ΔgLig,A/RT, plotted according to Eq (10) which is valid for the comprehensive ensemble model as well as the MWC and EAM models. The star represents the data point for ΔgLig,A = −3 kcal/mol and T = 310.15 K used in other figures.
Fig 6
Fig 6. Contributions of three pathways (MWC, EAM, Others) in the comprehensive ensemble model.
The stability free-energy parameters (ΔGR1, ΔGR2, ΔGRT1, ΔGRT2, Δgint,R, Δgint,T) vary randomly with an equal probability density between −8 and +8 kcal/mol, resulting in different systems (samples). (a) The average weights of pathways as functions of CRtot. The pathway weights of a system (sample) are calculated based on Eqs 6 and 7. (b) The capacity of three pathways for allostery, being calculated with Eq (12). The A-R binding mode is adopted in left panels and the A-T binding mode is adopted in right panels with ΔgLig,A = −3 kcal/mol. It is noted that a large portion of samples practically have CR = 0 and the pathway contributions are ill-defined with Eqs 6 and 7, which are thus ignored.
Fig 7
Fig 7. The influence of the variation range (ΔGmax, in a unit of kcal/mol) for free-energy parameters (ΔGR1, ΔGR2, ΔGRT1, ΔGRT2, Δgint,R, Δgint,T) of the comprehensive ensemble model with the A-R binding mode.
(a) The possibilities for three pathways [calculated with Eq (12)] obtained at different [–ΔGmax, +ΔGmax] range. (b) The probabilities of CR > 0.171 as a function of ΔGmax.
Fig 8
Fig 8. Interplay between different states and subsystems/pathways in the comprehensive ensemble model.
The A-R binding mode is adopted. (a) Proportion of four categories [single subsystem with single pathways (S,S), single subsystem with mixing pathways (S,M), mixing subsystems with single pathways (M,S), and mixing subsystems with mixing pathways (M,M)] in systems with CR. (b) The proportion of systems with two-state transition. (c) Distribution of PRR and state probability of three subsystems (PRR + PTT for the MWC pathway, PRR + PIR + PRI + PII for the EAM pathway, and PRR + PTI + PIT for the Other pathway) for systems with CR ≈ 0.16. ΔGmax = 3 or 13 kcal/mol. The theoretical CR ~ PRR curve (blue line) for the two-state model is also plotted using Eq (9). The horizontal dashed line represents CR = 0.16.
Fig 9
Fig 9. Analysis results with other measures of allostery.
(a) Distribution of lnα where α is the thermodynamic allosteric efficacy defined in Eq (13), as well as the capacity of three pathways. (b) The average weights of pathways as functions of lnα. (c) The average thermodynamic coupling function [ΔΔFi, as defined in Eq (15), and in a unit of RT] at some states as functions of lnα. (d) The average normalized allosteric coupling [AC, as defined in Eq (16)] of some states as functions of lnα. The variation range (ΔGmax) for free-energy parameters is 8 kcal/mol.
Fig 10
Fig 10. The properties under Ising-like interface interactions.
(a) Distribution of lnα when the Ising-like interface interactions of the Allosteric Ising Model (AIM) were introduced to combine with the MWC and EAM models. The variation range of Ising interface energy is ΔGmax = 3 RT. (b) The capacity of three pathways in the comprehensive ensemble model when the interface interactions are Ising-like. The variation range (ΔGmax) for free-energy parameters is 8 kcal/mol.

Similar articles

Cited by

References

    1. Fenton AW (2008) Allostery: an illustrated definition for the 'second secret of life'. Trends In Biochemical Sciences 33: 420–425. 10.1016/j.tibs.2008.05.009 - DOI - PMC - PubMed
    1. Monod J, Changeux JP, Jacob F (1963) Allosteric proteins and cellular control systems. Journal Of Molecular Biology 6: 306–329. - PubMed
    1. Monod J, Wyman J, Changeux JP (1965) On nature of allosteric transitions—a plausible model. Journal Of Molecular Biology 12: 88–118. - PubMed
    1. Koshland DE, Nemethy G, Filmer D (1966) Comparison of experimental binding data and theoretical models in proteins containing subunits. Biochemistry 5: 365–385. - PubMed
    1. Eaton WA, Henry ER, Hofrichter J, Mozzarelli A (1999) Is cooperative oxygen binding by hemoglobin really understood? Nature Structural Biology 6: 351–358. 10.1038/7586 - DOI - PubMed

Publication types