. 2018 Dec 3;14(12):e1007417.
doi: 10.1371/journal.ppat.1007417. eCollection 2018 Dec.

Tissue tropisms opt for transmissible reassortants during avian and swine influenza A virus co-infection in swine

Affiliations

Tissue tropisms opt for transmissible reassortants during avian and swine influenza A virus co-infection in swine

Xiaojian Zhang et al. PLoS Pathog. .

Abstract

Genetic reassortment between influenza A viruses (IAVs) facilitate emergence of pandemic strains, and swine are proposed as a "mixing vessel" for generating reassortants of avian and mammalian IAVs that could be of risk to mammals, including humans. However, how a transmissible reassortant emerges in swine are not well understood. Genomic analyses of 571 isolates recovered from nasal wash samples and respiratory tract tissues of a group of co-housed pigs (influenza-seronegative, avian H1N1 IAV-infected, and swine H3N2 IAV-infected pigs) identified 30 distinct genotypes of reassortants. Viruses recovered from lower respiratory tract tissues had the largest genomic diversity, and those recovered from turbinates and nasal wash fluids had the least. Reassortants from lower respiratory tracts had the largest variations in growth kinetics in respiratory tract epithelial cells, and the cold temperature in swine nasal cells seemed to select the type of reassortant viruses shed by the pigs. One reassortant in nasal wash samples was consistently identified in upper, middle, and lower respiratory tract tissues, and it was confirmed to be transmitted efficiently between pigs. Study findings suggest that, during mixed infections of avian and swine IAVs, genetic reassortments are likely to occur in the lower respiratory track, and tissue tropism is an important factor selecting for a transmissible reassortant.


Conflict of interest statement

The authors have declared that no competing interests exist.

Figures

Fig 1
Fig 1. Biological characteristics of avian H1N1 and swine H3N2 influenza A viruses (IAVs).
(A) Receptor binding properties of avian H1N1 (left panel) and swine H3N2 (right panel) IAVs. Biolayer interferometry data for the binding of avian H1N1 and swine H3N2 IAVs to avian (3ʹSLN) and human (6ʹSLN) receptor analogues. Streptavidin-coated biosensors were immobilized with biotinylated glycans at different levels. Sugar loading–dependent binding signals were captured in the association step and normalized to the same background. Binding curves were fitted by using the binding-saturation method in GraphPad Prism version 7 (https://www.graphpad.com/scientific-software/prism/). Horizontal dashed line indicates half of the fractional saturation (f = 0.5), and vertical dashed line indicates relative sugar loading (RSL0.5) at f = 0.5; the higher the RSL0.5, the smaller the binding affinity. (B) Infectivity of avian H1N1 IAV in feral swine. The animals in treatment group were intranasally inoculated with 106 EID50 of avian H1N1 IAV, and animals in the control group were intranasally inoculated with 1 mL of PBS. On indicated days, nasal wash fluids and respiratory tract tissues were collected from each animal for viral titration in 10-day-old specific pathogen–free eggs. Cumulative infectivity calculations were based on titration results.
Fig 2
Fig 2. Genotyping of plaque isolates in animal study.
A total of 571 viruses from nasal wash specimens (n = 159) and respiratory tract tissues (n = 412) were isolated by plaque assays and then subjected to genomic sequencing. (A) Plaque isolates from tissues of infected pigs. (B) Plaque isolates from infected pigs euthanized on each indicated day. (C) Plaque isolates from contact pigs, H1N1-inoculated pigs, and H3N2-inoculated pigs. (D) Overall genotyping. Grouping information is shown at the top of the figure. Nasal wash fluids (N) obtained 3, 5, and 7 days after inoculation (dpi) and respiratory tract tissue sections are indicated on the left. Dot size indicates quantity of isolates; colors indicate different origins of the isolates. ET, ethmoid turbinate; MT, middle turbinate; RT, rostral turbinate; TR-U, upper trachea; TR-M, middle trachea; TR-D, distal trachea; BR, bronchus; LCR, left cranial lung; RCR, right cranial lung; RMD, right middle lung; RA, right accessory; LCD, left caudal lung; RCD, right caudal lung.
Fig 3
Fig 3. Genotypes of isolated viruses.
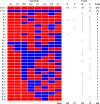
A total of 571 plaques were analyzed and 546 of them were genotyped with complete genomic sequences. The origin of each of the eight gene segments is shown at the top of the columns on the left. Red indicates segments from swine H3N2 virus, blue indicates segments from avian H1N1 virus. The numbers in the columns right indicate the quantity of isolates in nasal wash fluids (N) and in the upper (U, turbinate), middle (M, trachea), and lower (L, lung) respiratory tracts of pigs. Each plaque was assigned with a plaque number and a genotype number, and one genotype can have multiple plaques. R-number on the left column indicates a specific reassortant genotype number. For example, R3 refers to genotype 3 and includes a total of six individual plaques.
Fig 4
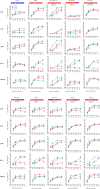
Fig 4. Growth dynamics of parental and reassortant viruses in swine nasal epithelium cells (SNE), swine tracheal epithelium cells (STE), human alveolar basal epithelial cells (A549), chicken embryo fibroblasts (DF-1), and Madin-Darby canine kidney (MDCK) cells.
Cells were infected at a multiplicity of infection of 0.001 TCID50/cell with the indicated parental or reassortant viruses. The nasal wash fluids (N) and tissue sections of the testing genotypes of the reassortant viruses are shown (U, upper respiratory tract; M, middle respiratory tract; L, lower respiratory tract). The origin of each segment for indicated viruses are shown at the top of the columns; red indicates segments from swine H3N2 virus, and blue indicates segments from avian H1N1 virus. Infected cells were incubated at 33°C, 37°C, or 39°C. Growth curves were determined by using the viral titers in the supernatants of infected cells obtained at 12, 24, 48, and 72 h post-inoculation. Data shown represent the mean titers ± standard errors (n = 3 cultures). Significance is noted (*P<0.05, **P<0.01, and ***P<0.001) where virus titers obtained for a virus at 33°C or 39°C were statistically different from those obtained at 37°C at the same time point.
Fig 5
Fig 5. Growth dynamics of reassortant influenza viruses in swine nasal epithelium cells (SNE), swine tracheal epithelium cells (STE), and human alveolar basal epithelial cells (A549).
A) Plaque isolates from nasal wash fluids (N) and upper (U), middle (M), and lower (L) respiratory tracts of infected feral swine were selected to grow in SNE, STE, and A549 cells at 33°C, 37°C, and 39°C, respectively. Stars indicate viruses isolated from various samples. Colors indicated virus genotypes. No. of genotypes were also shown in the legend. B–D) Virus titers for reassortants from nasal wash fluids and upper (B), middle (C), and lower (D) respiratory tracts. Cells were seeded in 6-well plates and infected in triplicate with plaque viruses at a multiplicity of infection of 0.001. Supernatant samples were collected at 72 h and titrated by TCID50 in Madin-Darby canine kidney cells. In panel B-D, the color was used to distinguish the factor of temperature (i.e., blue for 33 oC, green for 37 oC, and red for 39 oC) and the shape to distinguish the tissue source for the plaques (i.e., circle for upper respiratory tracts, square for middle respiratory tracts, and triangle for lower respiratory tracts). The distribution of the plaques are shown in Fig 2, the genotypes of the plaques in Fig 3, and the growth phenotypes of the plaques in Fig 4 and S3 Fig.

Similar articles

Cited by

References

    1. Tong S, Li Y, Rivailler P, Conrardy C, Castillo DA, Chen LM, et al. A distinct lineage of influenza A virus from bats. Proc Natl Acad Sci U S A. 2012;109(11):4269–74. 10.1073/pnas.1116200109 ; PubMed Central PMCID: PMCPMC3306675. - DOI - PMC - PubMed
    1. Tong S, Zhu X, Li Y, Shi M, Zhang J, Bourgeois M, et al. New world bats harbor diverse influenza A viruses. PLoS Pathog. 2013;9(10):e1003657 10.1371/journal.ppat.1003657 ; PubMed Central PMCID: PMCPMC3794996. - DOI - PMC - PubMed
    1. Olsen B, Munster VJ, Wallensten A, Waldenstrom J, Osterhaus AD, Fouchier RA. Global patterns of influenza a virus in wild birds. Science. 2006;312(5772):384–8. 10.1126/science.1122438 . - DOI - PubMed
    1. Webster RG, Bean WJ, Gorman OT, Chambers TM, Kawaoka Y. Evolution and ecology of influenza A viruses. Microbiol Rev. 1992;56(1):152–79. ; PubMed Central PMCID: PMCPMC372859. - PMC - PubMed
    1. Webster RG, Shortridge KF, Kawaoka Y. Influenza: interspecies transmission and emergence of new pandemics. FEMS Immunol Med Microbiol. 1997;18(4):275–9. . - PMC - PubMed

Publication types

MeSH terms