. 2018 Dec 3;13(12):e0207873.
doi: 10.1371/journal.pone.0207873. eCollection 2018.

RG108 increases NANOG and OCT4 in bone marrow-derived mesenchymal cells through global changes in DNA modifications and epigenetic activation

Affiliations

RG108 increases NANOG and OCT4 in bone marrow-derived mesenchymal cells through global changes in DNA modifications and epigenetic activation

Rahyza I F Assis et al. PLoS One. .

Abstract

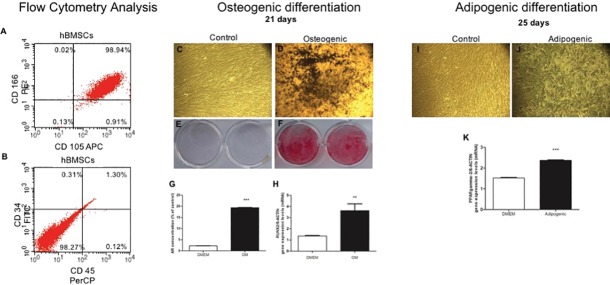
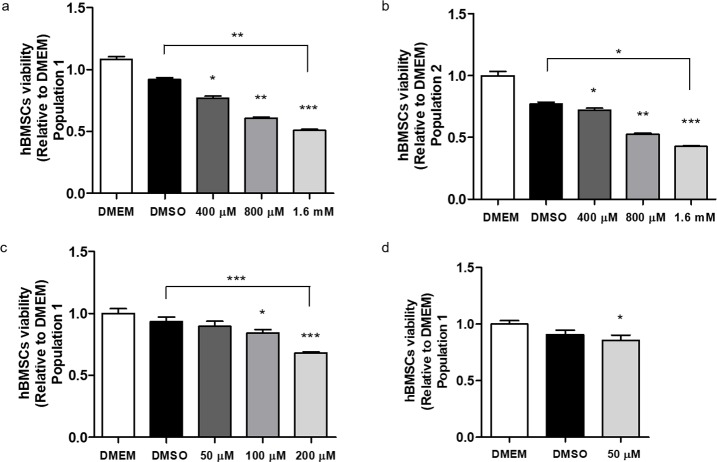
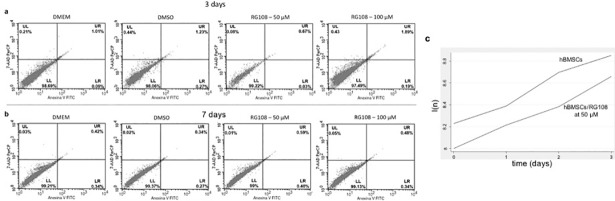
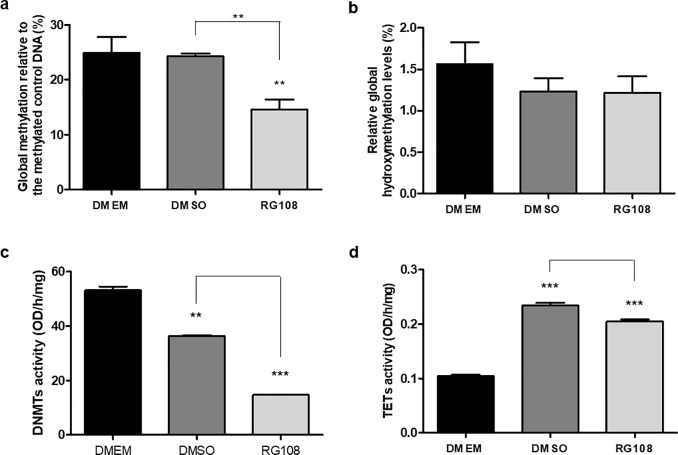
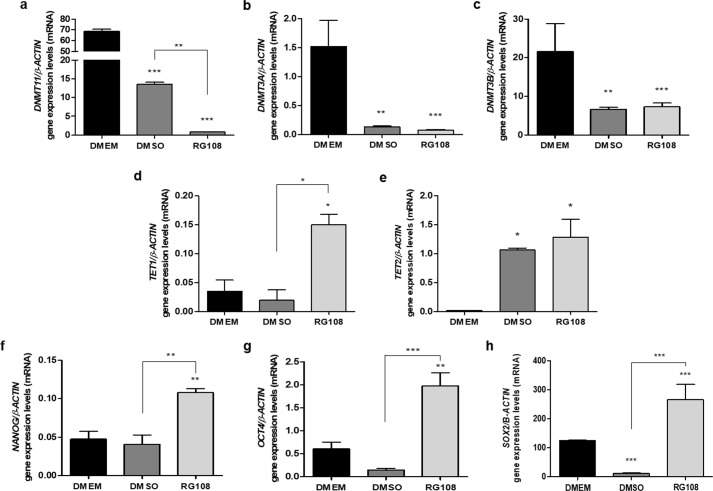
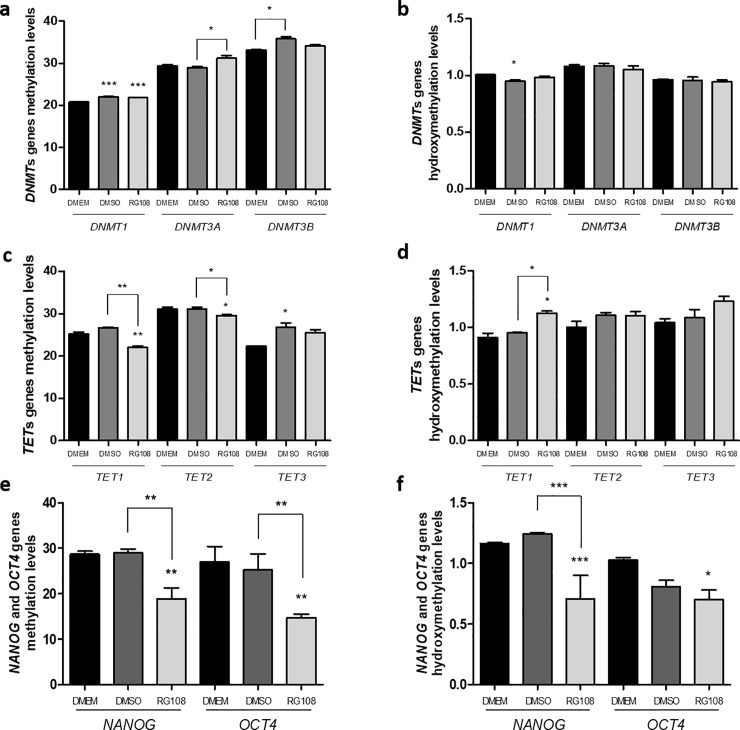
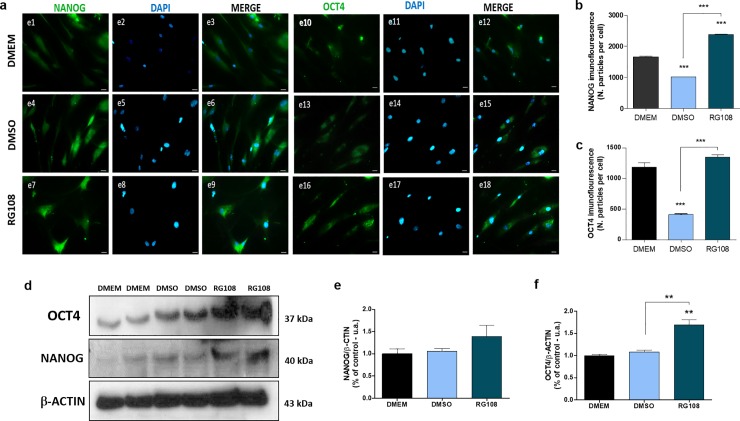
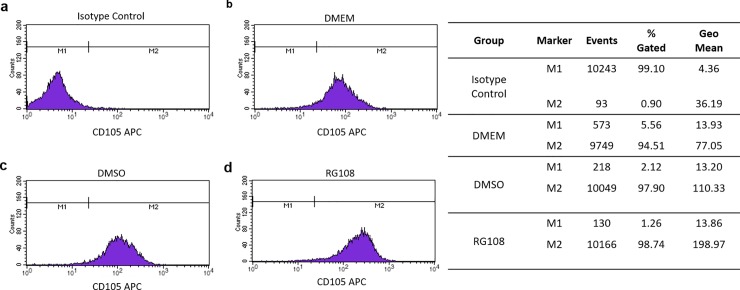
Human bone marrow-derived mesenchymal stem cells (hBMSCs) are important for tissue regeneration but their epigenetic regulation is not well understood. Here we investigate the ability of a non-nucleoside DNA methylation inhibitor, RG108 to induce epigenetic changes at both global and gene-specific levels in order to enhance mesenchymal cell markers, in hBMSCs. hBMSCs were treated with complete culture medium, 50 μM RG108 and DMSO for three days and subjected to viability and apoptosis assays, global and gene-specific methylation/hydroxymethylation, transcript levels' analysis of epigenetic machinery enzymes and multipotency markers, protein activities of DNMTs and TETs, immunofluorescence staining and western blot analysis for NANOG and OCT4 and flow cytometry for CD105. The RG108, when used at 50 μM, did not affect the viability, apoptosis and proliferation rates of hBMSCs or hydroxymethylation global levels while leading to 75% decrease in DNMTs activity and 42% loss of global DNA methylation levels. In addition, DNMT1 was significantly downregulated while TET1 was upregulated, potentially contributing to the substantial loss of methylation observed. Most importantly, the mesenchymal cell markers CD105, NANOG and OCT4 were upregulated being NANOG and OCT4 epigenetically modulated by RG108, at their gene promoters. We propose that RG108 could be used for epigenetic modulation, promoting epigenetic activation of NANOG and OCT4, without affecting the viability of hBMSCs. DMSO can be considered a modulator of epigenetic machinery enzymes, although with milder effect compared to RG108.


Conflict of interest statement

The authors have declared that no competing interests exist.

Figures

Fig 1
Fig 1. hBMSCs phenotyping and differentiation.
Dot plot graphs illustrate the presence/absence of mesenchymal cell surface markers, performed by flow cytometry analysis on hBMSCs. (A) CD166 and CD105 positive cells are sorted into the upper right quadrant (UR) (98.94%) and (B) CD34 and CD45 negative cells are sorted into the lower left (LL) (98.27%). The results were obtained by flow cytometry performed in FACS Calibur flow cytometer (BD Biosciences, San Jose, CA, USA). (C) Representative photomicrograph of osteogenic differentiation with 10x magnification of control group (standard medium—DMEM 10%) and (D) osteogenic group (osteogenic induction medium). (E) Alizarin red staining after 21 days of osteogenic induction with standard culture medium—DMEM 10% and (F) osteogenic medium and (G) levels of alizarin red concentration in both groups; (H) RT-PCR analysis of RUNX2 gene expression. Representative photomicrograph of adipogenic differentiation (10x magnification) after 25 days of induction, (I) control group cultured in standard medium–(DMEM 10%) and (J) adipogenic induction medium; (K) RT-PCR analysis of gene expression of PPARgamma-2. For all graphics, * above the bars represent significant inter-group differences when compared to DMEM. ** and *** indicate, respectively, p ≤ 0.001 p ≤ 0.0001 by the test T student.
Fig 2
Fig 2. Effect of RG108 on hBMSCs cell viability.
(A, B) 2 populations of hBMSCs were treated with 400 μM, 800 μM and 1.6 mM of RG108 for 7 days, showing significant reduction in viability comparing to DMEM and DMSO control groups. (C) Population 1 was treated with 200 μM, 100 μM and 50 μM of RG108 for 7 days; only 50 μM showed similar metabolic activity to DMEM group. (D) Population 1 was treated with 50 μM RG108 for 3 days confirming this concentration has little effect on hBMSCs viability. Three biological replicates were used for each experiment and each one was plated in six technical repeats and the cells’ metabolic activity was measured using the 3-(4,5-dimethylthiazol-2-yl)-2,5-diphenyltetrazolium bromide (MTT) assay. The data are presented relative to DMEM group as mean and standard deviation. For all graphics, asterisks above the bars represent significant inter-group differences when compared to DMEM. Other significant differences are represented by asterisks above the linkers. *, ** and *** indicate, respectively, p ≤ 0.01, p ≤ 0.001 p ≤ 0.0001 by ANOVA One Way followed by the Tukey test (c and d) and by Kruskal-Wallis followed by the Dunn's Multiple Comparison Test (a and b).
Fig 3
Fig 3. Effect of RG108 on apoptosis in hBMSCs.
(A, B) hBMSCs were treated for 3 and 7 days with 50 μM and 100 μM RG108 and compared to DMEM and DMSO controls. Neither of the treatments triggered cell death by apoptosis at 3 and 7 days. The non-apoptotic cells are sorted into the lower left (LL) quadrant. (C) Three days of 50 μM RG108 treatment did not affect also the hBMSCs’ ability to proliferate in vitro. Two biological replicates were performed for each group; data are presented as l(n) of cells seeded at three different densities and quantified spectrophotometrically at 260 nm.
Fig 4
Fig 4. Global effects of RG108 on DNA modifications and DNMTs and TETs enzymatic activities in hBMSCs.
hBMSCs were treated with 50 μM RG108 for 3 days and compared to DMEM and DMSO controls. (A) Global methylation was assessed using Imprint Methylated DNA Quantification Kit showing a significant decrease in the RG108 group. (B) Global hydroxymethylation was analyzed using Quest 5-hmC DNA Elisa kit; no statistical differences are observed amongst groups. DNMTs (C) and TETs (D) enzymatic activities were assessed using colorimetric assays. Global methylation and hydroxymethylation experiments were performed in biological triplicates and DNMTs and TETs activities were performed in biological duplicates. For all graphics, ** or *** above the bars represent significant inter-group differences when compared to DMEM. Other significant differences are represented by * symbol above the linkers. ** and *** indicate, respectively, p ≤ 0.001 and p ≤ 0.0001 by ANOVA One Way followed by the Tukey test.
Fig 5
Fig 5. Changes in transcript levels of epigenetic machinery genes and multipotency markers after RG108 treatment.
DNMT1 (A), DNMT3A (B), DNMT3B (C), TET1 (D), TET2 (E), NANOG (F), OCT4 (G) and SOX2 (H) mRNA levels were analyzed by qPCR after 3 days of treatment with 50 μM of RG108. Results correspond to mRNA levels ratio normalized to the β-actin levels. Determination of gene expression relative levels was performed using the cycle threshold (Ct) method and the results are presented as mean/SD. Two biological replicates were performed for each group and each of the biological replicates was analyzed in technical triplicates. For all graphics, *, ** or *** above bars represent significant inter-group differences when compared to DMEM. Other significant differences are represented by * symbol above the linkers. *, ** and *** indicate, respectively, p ≤ 0.01, p ≤ 0.001 p ≤ 0.0001 by ANOVA One Way followed by the Tukey test.
Fig 6
Fig 6. Changes in DNA modifications at gene-specific regulatory elements in response to RG108 treatment.
Methylation and hydroxymethylation levels were analyzed by DNA glycosylation followed by restriction enzyme analysis and qPCR of promoter sequences, after 3 days of 50 μM RG108 treatment and compared to DMEM and DMSO controls. The relative levels were determined using the cycle threshold (Ct) method and the methylation results are presented as HpaII levels—MspI levels/control levels and the hydroxymethylation results are presented as MspI levels/control levels (% of control). Two biological replicates were performed for each group and each of the biological replicates was done in technical triplicates. (A) All DNMT genes are mostly unmethylated (20–30% methylation level) and undergo only small (2–3%) methylation after RG108. (B) The hydroxymethylation levels at DNMTs’ promoters are low and do not change after RG108 treatment. (C) TET genes have similar 20–30% methylation levels; TET1 and TET2 undergo small but significant demethylation after RG108. (D) Hydroxymethylation levels at TET genes are low and do not change with RG108. (E) RG108 treatment resulted in 40% and 40% loss of methylation and hydroxymethylation, respectively at NANOG regulatory element. (F) For OCT4, the methylation loss was 48% and hydroxymethylation was 32%. For all graphics, *, ** or *** above the bars represent significant inter-group differences when compared to DMEM. Other significant differences are represented by * symbol above the linkers. *, ** and *** indicate, respectively, p ≤ 0.01, p ≤ 0.001 p ≤ 0.0001 by ANOVA One Way followed by the Tukey test.
Fig 7
Fig 7. RG108-trigerred changes to multipotency gene markers.
hBMSCs were treated with 50 μM of RG108 for 3 days and subject to immunostaining (A, B and C) and western blot (D, E and F) analysis. Untreated (DMEM) and vehicle control-treated (DMSO) cells were used as controls. Two biological replicates were performed for each group. The data show a significant increase in the immunostaining of NANOG (A and B) and OCT4 (A, C, D and F). Representative images are shown in A and D. Nuclei were labelled with DAPI (blue). Magnification x40. For all graphics, ** over the bars represent significant inter-group differences when compared to DMEM. Other significant differences are represented by * symbol above the linkers. ** and *** indicate, respectively, p ≤ 0.001 p ≤ 0.0001 by ANOVA One Way followed by the Tukey test.
Fig 8
Fig 8. Effect of RG108 on CD105 surface marker.
Flow cytometry histograms of hBMSCs showed modulation of CD105 surface marker, after RG108 and DMSO treatments, for three days. hBMSCs were labelled with allophycocyanin (APC)-conjugated monoclonal antibody; positive cells are located at M2 region and M1 represents isotype as control.

References

    1. Greco SJ, Liu K and Rameshwar P. Functional similarities among genes regulated by OCT4 in human mesenchymal and embryonic stem cells. Stem Cells. 2007; 25: 3143–3154. 10.1634/stemcells.2007-0351 - DOI - PubMed
    1. Wei X and Shen CY. Transcriptional regulation of Oct4 in human bone marrow mesenchymal stem cells. Stem Cells Dev. 2011. 10.1089/scd.2010.0069 - DOI - PubMed
    1. Boyer LA, Lee TI, Cole MF, Johnstone SE, Levine SS, Zucker JP, et al. Core transcriptional regulatory circuitry in human embryonic stem cells. Cell. 2005; 122: 947–956. 10.1016/j.cell.2005.08.020 - DOI - PMC - PubMed
    1. Tsai CC, Su PF, Huang YF, Yew TL and Hung SC. Oct4 and Nanog directly regulate Dnmt1 to maintain self-renewal and undifferentiated state in mesenchymal stem cells. Mol Cell. 2012. 10.1016/j.molcel.2012.06.020 - DOI - PubMed
    1. Costa Y, Ding J, Theunissen TW, Faiola F, Hore TA, Shliaha PV, et al. NANOG-dependent function of TET1 and TET2 in establishment of pluripotency. Nature. 2013. 10.1038/nature11925 - DOI - PMC - PubMed

Publication types

MeSH terms