Review
. 2019 Jan 28;144(3):794-807.
doi: 10.1039/c8an01574k.

New mass spectrometry technologies contributing towards comprehensive and high throughput omics analyses of single cells

Affiliations
Review

New mass spectrometry technologies contributing towards comprehensive and high throughput omics analyses of single cells

Sneha P Couvillion et al. Analyst. .

Abstract

Mass-spectrometry based omics technologies - namely proteomics, metabolomics and lipidomics - have enabled the molecular level systems biology investigation of organisms in unprecedented detail. There has been increasing interest for gaining a thorough, functional understanding of the biological consequences associated with cellular heterogeneity in a wide variety of research areas such as developmental biology, precision medicine, cancer research and microbiome science. Recent advances in mass spectrometry (MS) instrumentation and sample handling strategies are quickly making comprehensive omics analyses of single cells feasible, but key breakthroughs are still required to push through remaining bottlenecks. In this review, we discuss the challenges faced by single cell MS-based omics analyses and highlight recent technological advances that collectively can contribute to comprehensive and high throughput omics analyses in single cells. We provide a vision of the potential of integrating pioneering technologies such as Structures for Lossless Ion Manipulations (SLIM) for improved sensitivity and resolution, novel peptide identification tactics and standards free metabolomics approaches for future applications in single cell analysis.


Figures

Figure 1.
Figure 1.. Limitations of bulk cell analysis vs benefits of single cell analysis.
(A) Population averages can mask cell heterogeneity. The mean measurement (indicated by dashed lines) of a population may not capture (i) the shaded tail of the distribution, (ii) a subpopulation or (iii) majority of the cells in case of bimodal behavior. (iv) Univariate analysis of a single measurement from individual cells may not be able to distinguish correlated (left) or anticorrelated (right) expression of cells (f1 and f2 indicate single cell measurements). (B) Interpreting functional significance from heterogeneity. (i) Individual cells can be represented as points in a feature space (ii) Cells can be partitioned into subpopulations (eg: S1 and S2) in regions of the feature space (iii) The presence of significant differences between subpopulations or ensemble averages can be tested. One can assess how informative is an entire decomposition of heterogeneity (middle and right). Reproduced from Altschuler and Wu with permission from Elsevier, Copyright 2010.
Figure 2.
Figure 2.. Proteome coverage achieved using nanoPOTS (orange) and other (blue) technologies for samples comprising ≤1000 mammalian somatic cells.
Orange data points, from left to right, are from Zhu et al., Zhu et al., and Dou et al. Blue data points represent proteome coverage reported by Wang et al., Zhang et al., Wiśniewski et al., Kasuga et al. and Li et al.
Figure 3.
Figure 3.
Depiction of the CRIMP step, where three broad ions are successfully compressed into much narrower ones following CRIMP, thereby increasing signal intensity, and thus S/N.
Figure 4.
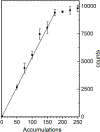
Figure 4.. Demonstration of ion enrichment in SLIM.
As an ion is enriched longer (more accumulations), its signal intensity will continue to linearly increase until reaching a horizontal asymptote. Reproduced from Chen et al with permission from American Chemical Society, Copyright 2016.
Figure 5.
Figure 5.. Identification of a peptide feature based on comparison of experimental properties vs those contained in a reference library.
A peptide was detected in a LC-IMS-MS experiment with a measured mass and elution time (red dot) that could match to two different peptides in a reference library (blue dots), when considering only mass and elution time. The mass measurement errors between the experimental mass and library masses are identical, while the normalized elution time errors are different but not sufficiently so to enable a unique identification. Drift time, as measured by drift tube IM, was significantly different between the two library entries to enable the peptide to be identified as DCFILDHGKDGK. Reproduced from Crowell et al. with permission from Elsevier, Copyright 2013.
Figure 6.
Figure 6.
Representative workflow for identifying molecules based on matching of experimental m/z and CCS to computationally predicted values.
Figure 7.
Figure 7.. Drift times and infrared spectra for six isomeric disaccharides.
The drift time distributions for the six isobaric disaccharides overlap, and so they would not be distinguishable by IMS alone. However, their vibrational spectra are very different, providing a means for their identification. Reproduced from Masellis et al. with permission from Springer Nature, Copyright 2017.
Figure 8.
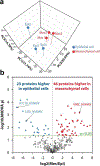
Figure 8.. Principal component analysis (PCA) of label-free proteomics data from FACS-sorted cells.
a) Unsupervised PCA based on label‐free quantification of proteins expressed in epithelial and mesenchymal cells from human lung. b) Volcano plot of differentially expressed proteins. Epithelial cell Replicate 2 was excluded for this analysis. Reproduced from Zhu et al. with permission from John Wiley and Sons, Copyright 2018.

References

    1. Altschuler SJ and Wu LF, Cell, 2010, 141, 559–563. - PMC - PubMed
    1. Huang S, Development, 2009, 136, 3853–3862. - PMC - PubMed
    1. Dagogo-Jack I and Shaw AT, Nature Reviews Clinical Oncology, 2018, 15, 81. - PubMed
    1. Braun S, Vogl FD, Naume B, Janni W, Osborne MP, Coombes RC, Schlimok G, Diel IJ, Gerber B and Gebauer G, New England journal of medicine, 2005, 353, 793–802. - PubMed
    1. Braun S, Kentenich C, Janni W, Hepp F, de Waal J, Willgeroth F, Sommer H and Pantel K, Journal of clinical oncology, 2000, 18, 80-80. - PubMed