

Analysis of Physician Variation in Provision of Low-Value Services
- PMID: 30508010
- PMCID: PMC6583417
- DOI: 10.1001/jamainternmed.2018.5086
Analysis of Physician Variation in Provision of Low-Value Services
Abstract
Importance: Facing new financial incentives to reduce unnecessary spending, health care organizations may attempt to reduce wasteful care by influencing physician practices or selecting more cost-effective physicians. However, physicians' role in determining the use of low-value services has not been well described.
Objectives: To quantify variation in provision of low-value health care services among primary care physicians and to estimate the proportion of variation attributable to physician characteristics that may be used to predict performance.
Design, setting, and participants: This retrospective analysis included national Medicare fee-for-service claims of 3 159 834 beneficiaries served by 41 773 generalist physicians from January 1, 2008, through December 31, 2013 (data were analyzed in 2016 through 2018). Multilevel modeling was used to estimate the extent of variation in service use across physicians within their region and provider organization, adjusted for patient clinical and sociodemographic characteristics and sampling variation. The proportion of variation attributable to physician characteristics that may be used to predict performance (age, sex, academic degree, professorship, publication record, trial investigation, grant receipt, pharmaceutical or device manufacturer payment, and panel size) was estimated via additional regression analysis.
Main outcomes and measures: Annual count per beneficiary of 17 primary care-associated services that provide minimal clinical benefit.
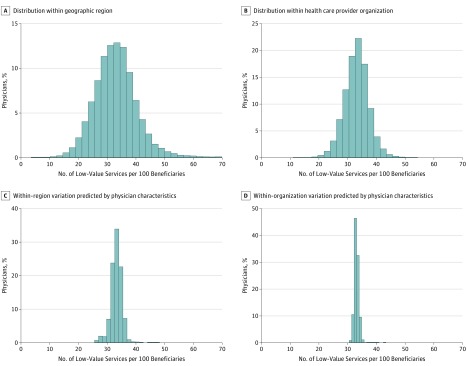
Results: Among the 3 159 834 beneficiaries (58.3% women; mean [SD] age, 73.2 [11.0] years) served by 41 773 physicians (74.9% men; mean [SD] age, 48.0 [10.1] years), the mean annual rate of low-value services was 33.1 services per 100 beneficiaries. Considerable variation across physicians within the same region was found (SD, 8.8 [95% CI, 8.7-8.9]; 90th:10th percentile ratio, 2.03 [95% CI, 2.01-2.06]) and across physicians within the same organization (SD, 6.1 [95% CI, 6.0-6.2]; 90th:10th percentile ratio, 1.61 [95% CI, 1.60-1.63]). The corresponding rates at the 10th percentile of physicians within region and within organization respectively were 21.8 and 25.3 services per 100 beneficiaries. Observable physician characteristics accounted for only 4.4% of physician variation within region and 1.4% of physician variation within organization.
Conclusions and relevance: Physician practices may substantially contribute to low-value service use, which is prevalent even among the least wasteful physicians. Because little variation is predicted by measured physician characteristics, direct measures of low-value care provision may aid organizational efforts to encourage high-value practices.
Conflict of interest statement
Figures
Comment in
-
Medical Overuse as a Physician Cognitive Error: Looking Under the Hood.JAMA Intern Med. 2019 Jan 1;179(1):26-27. doi: 10.1001/jamainternmed.2018.5136. JAMA Intern Med. 2019. PMID: 30508015 No abstract available.
-
Re: Analysis of Physician Variation in Provision of Low-Value Services.J Urol. 2019 May;201(5):849. doi: 10.1097/JU.0000000000000168. J Urol. 2019. PMID: 30747869 No abstract available.
References
-
- Centers for Medicare & Medicaid Services The Medicare Access & CHIP Reauthorization Act of 2015 Quality Payment Program. https://www.cms.gov/Medicare/Quality-Initiatives-Patient-Assessment-Inst.... 2017. Accessed May 21, 2017.
Publication types
MeSH terms
Grants and funding
LinkOut - more resources
Full Text Sources
Medical
