Case Reports
. 2019 Mar 1;76(3):310-317.
doi: 10.1001/jamaneurol.2018.3692.

Correlation of In Vivo [18F]Flortaucipir With Postmortem Alzheimer Disease Tau Pathology

Affiliations
Case Reports

Correlation of In Vivo [18F]Flortaucipir With Postmortem Alzheimer Disease Tau Pathology

Ruben Smith et al. JAMA Neurol. .

Abstract

Importance: In Alzheimer disease (AD), tau filaments form neuronal inclusions in neurites (neuropil threads) and in somata (neurofibrillary tangles), and neurite tau pathology constitutes the most common pathology. Positron emission tomography (PET) ligands have been developed to detect in vivo tau pathology in AD. However, the association of AD tau pathology post mortem with in vivo tau PET retention has not been established. Therefore, there is a need to investigate the associations of tau PET with postmortem tau pathology in AD.

Objective: To study the association of regional in vivo retention of the tau PET ligand [18F]flortaucipir (previously known as AV1451) with the density of tau neuropathology in the corresponding brain regions in a patient with AD.

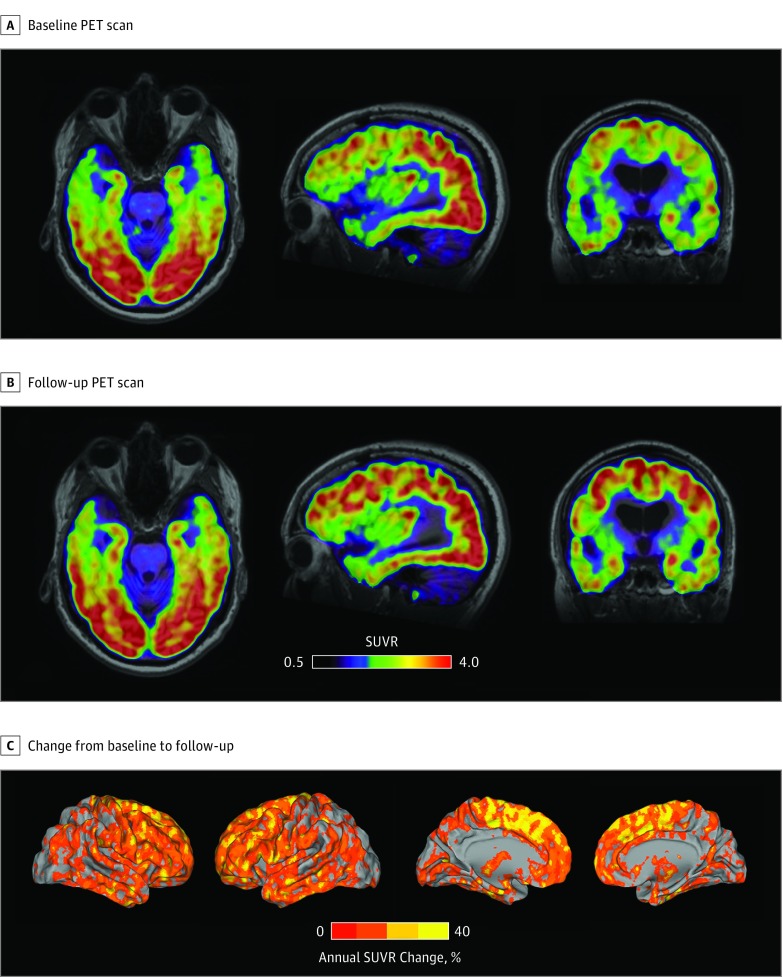
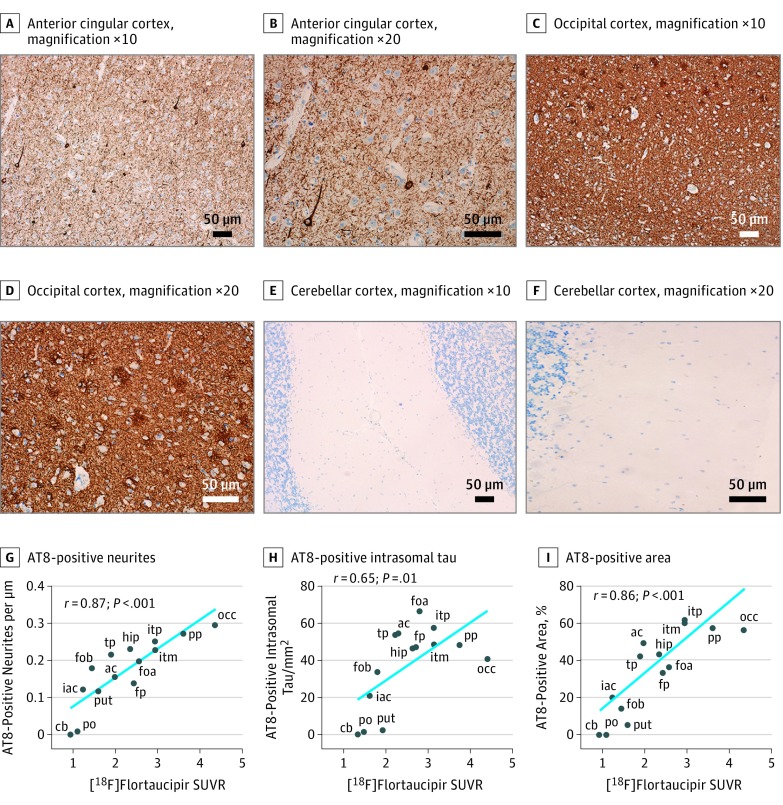
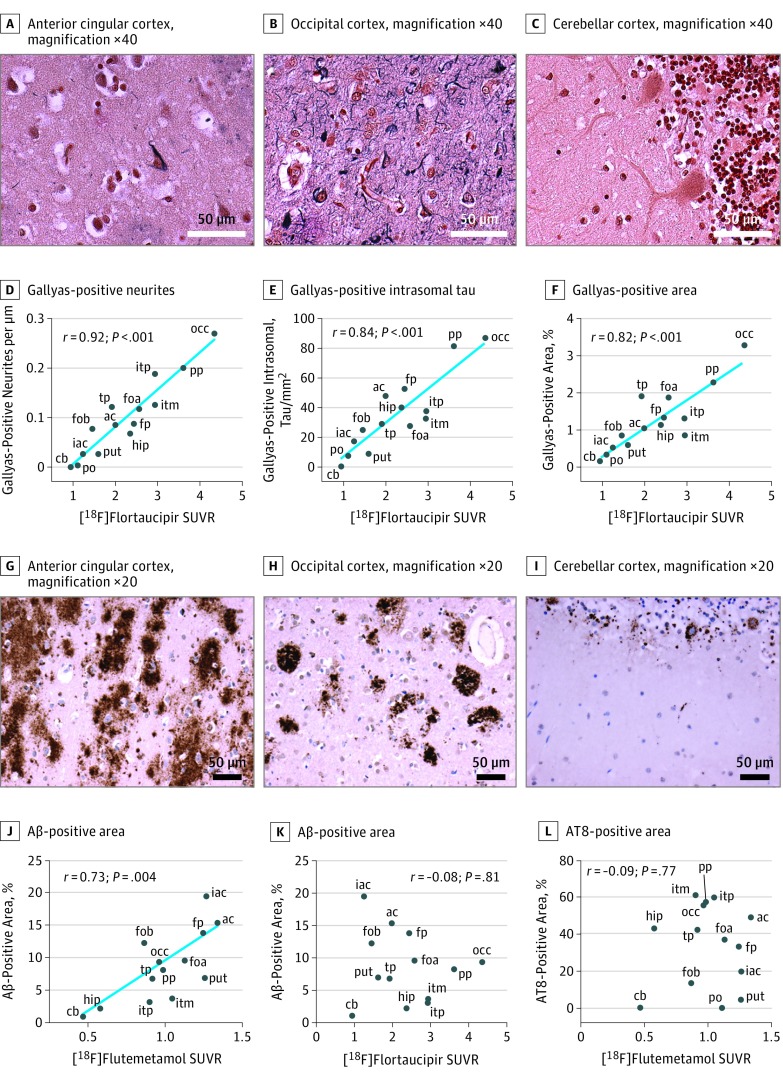
Design, setting, and participants: The patient was a man in his 40s with AD caused by a PSEN1 mutation. Between May 2015 and December 2016, he underwent 2 [18F]flortaucipir PET scans at Lund University Hospital, Lund, Sweden. Postmortem analysis was performed 12 months after the last PET scan. Tau pathology was assessed using phosphorylated tau (AT8) immunohistochemistry and Gallyas silver staining. In addition to the regional total tau pathology burden, the density of tau-positive neurites and intrasomal tau tangles were quantified using a stereology-based method. Further, β-amyloid-containing plaques were detected using 4G8 immunohistochemistry. Data were analyzed between January 2018 and August 2018.

Main outcomes and measures: Regional standardized uptake value ratios of [18F]flortaucipir were compared with the amount of tau pathology in the corresponding brain areas.

Results: In this patient, the clinical disease symptoms progressed rapidly in life, paralleled with an annual increase of tau PET retention of 20% to 40% in many cortical regions. Compared with postmortem immunohistochemistry, regional in vivo uptake of [18F]flortaucipir was correlated with the density of tau-positive neurites (AT8: rs = 0.87; P < .001; Gallyas: rs = 0.92; P < .001), intrasomal tau tangles (AT8: rs = 0.65; P = .01; Gallyas: rs = 0.84; P < .001), and total tau burden (AT8: rs = 0.84; P < .001; Gallyas: rs = 0.82; P < .001). No correlations between [18F]flortaucipir and β-amyloid pathology were found.

Conclusions and relevance: These results indicate that [18F]flortaucipir PET retention is a robust in vivo measure of the total AD tau burden.


Conflict of interest statement

Conflict of Interest Disclosures: Dr Hansson has received research support from F. Hoffmann–La Roche, GE Healthcare, Biogen, Avid Radiopharmaceuticals, Fujirebio Diagnostics, and Euroimmun, which were paid to Lund University. In the past 2 years, he has received consultancy/speaker fees from Biogen, F. Hoffmann–La Roche, and Fujirebio Diagnostics, which were paid to Lund University. No other disclosures were reported.

Figures

Figure 1.
Figure 1.. Baseline and Follow-up [18F]Flortaucipir Positron Emission Tomography (PET) and Annual Change in Standardized Uptake Value Ratio (SUVR)
A, SUVR images from the baseline PET scan acquired 32 months prior to the patient’s death. B, SUVR images from the follow-up PET scan acquired 12 months before the patient’s death. C, The annual percentage of SUVR change from the baseline to the follow-up scan.
Figure 2.
Figure 2.. Neuropathological Assessment of Phosphorylated Tau (AT8) Pathology and Correlations With Positron Emission Tomography (PET) Data
Panels A-F depict AT8 immunohistochemistry of the anterior cingular cortex at ×10 (A) and ×20 (B) magnification, the occipital cortex at ×10 (C) and ×20 (D) magnification, and the cerebellar cortex at ×10 (E) and ×20 (F) magnification. Scale bars indicate 50 μm. Panels G-I show the correlations of [18F]flortaucipir standardized uptake value ratio (SUVR) values with AT8 tau-positive neurite density (G), AT8-positive intrasomal tau tangles (H), and the overall density of AT8 tau immunohistochemistry (I). ac indicates anterior cingulum (dexter); cb, cerebellar gray matter; foa, fronto-orbital cortex (sinister), sample a; fob, fronto-orbital cortex (sinister), sample b; fp, frontal pole (sinister); hip, hippocampus (sinister); iac, inferior anterior cingulum (dexter); itm, inferior temporal (sinister), midway along an anteroposterior axis; itp, inferior temporal (sinister), posterior aspect; occ, occipital cortex (sinister; calcarine fissure); po, pons; pp, parasagittal parietal cortex (dexter); put, putamen (sinister); tp, temporal pole (sinister). The blue line indicates linear regressions.
Figure 3.
Figure 3.. Correlation of Gallyas Silver Stain and β-Amyloid (Aβ) Pathology With Positron Emission Tomography (PET) Retention
Panels A-C depict Gallyas silver staining of the anterior cingular cortex (A), the occipital cortex (B), and the cerebellar cortex (C), all at ×40 magnification. Scale bars indicate 50 μm. Panels D-F show the correlations of [18F]flortaucipir standardized uptake value ratio (SUVR) values with Gallyas-positive neurite density (D), Gallyas-positive intrasomal tau tangles (E), and the overall density of tau positivity using the Gallyas silver stain (F). Panels G-I depict 4G8 immunohistochemistry to detect Aβ in the anterior cingular cortex (G), the occipital cortex (H), and the cerebellar cortex (I), all at ×20 magnification. Scale bars indicate 50 μm. J, Correlation of Aβ density with [18F]flutemetamol SUVR. K, Correlation of Aβ density with [18F]flortaucipir SUVR. L, Correlation of phosphorylated tau (AT8)–positive area with [18F]flutemetamol SUVR. ac indicates anterior cingulum (dexter); cb, cerebellar gray matter; foa, fronto-orbital cortex (sinister), sample a; fob, fronto-orbital cortex (sinister), sample b; fp, frontal pole (sinister); hip, hippocampus (sinister); iac, inferior anterior cingulum (dexter); itm, inferior temporal (sinister), midway along an anteroposterior axis; itp, inferior temporal (sinister), posterior aspect; occ, occipital cortex (sinister; calcarine fissure); po, pons; pp, parasagittal parietal cortex (dexter); put, putamen (sinister); tp, temporal pole (sinister). The blue line indicates linear regressions.

References

    1. Dani M, Brooks DJ, Edison P. Tau imaging in neurodegenerative diseases. Eur J Nucl Med Mol Imaging. 2016;43(6):1139-1150. doi:10.1007/s00259-015-3231-2 - DOI - PMC - PubMed
    1. Johnson KA, Schultz A, Betensky RA, et al. . Tau positron emission tomographic imaging in aging and early Alzheimer disease. Ann Neurol. 2016;79(1):110-119. doi:10.1002/ana.24546 - DOI - PMC - PubMed
    1. Ossenkoppele R, Schonhaut DR, Schöll M, et al. . Tau PET patterns mirror clinical and neuroanatomical variability in Alzheimer’s disease. Brain. 2016;139(pt 5):1551-1567. doi:10.1093/brain/aww027 - DOI - PMC - PubMed
    1. Schöll M, Lockhart SN, Schonhaut DR, et al. . PET imaging of tau deposition in the aging human brain. Neuron. 2016;89(5):971-982. doi:10.1016/j.neuron.2016.01.028 - DOI - PMC - PubMed
    1. Schöll M, Ossenkoppele R, Strandberg O, et al. ; Swedish BioFINDER study . Distinct 18F-AV-1451 tau PET retention patterns in early- and late-onset Alzheimer’s disease. Brain. 2017;140(9):2286-2294. doi:10.1093/brain/awx171 - DOI - PubMed

Publication types