. 2019 Feb;49(2):242-254.
doi: 10.1002/eji.201847717. Epub 2018 Dec 18.

Self-glycerophospholipids activate murine phospholipid-reactive T cells and inhibit iNKT cell activation by competing with ligands for CD1d loading

Affiliations

Self-glycerophospholipids activate murine phospholipid-reactive T cells and inhibit iNKT cell activation by competing with ligands for CD1d loading

Ramesh Chandra Halder et al. Eur J Immunol. 2019 Feb.

Abstract

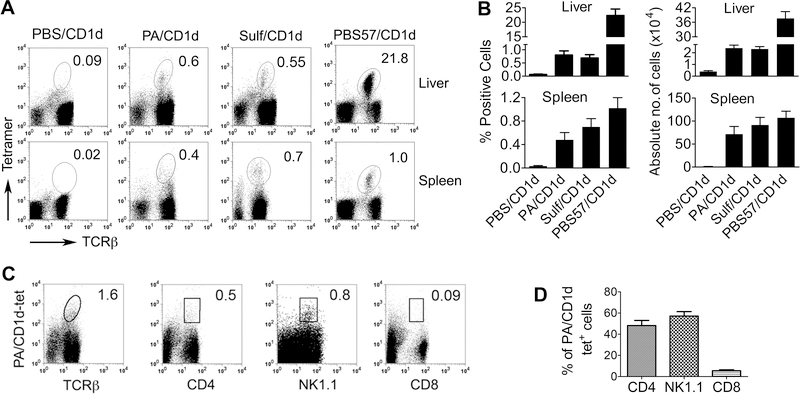
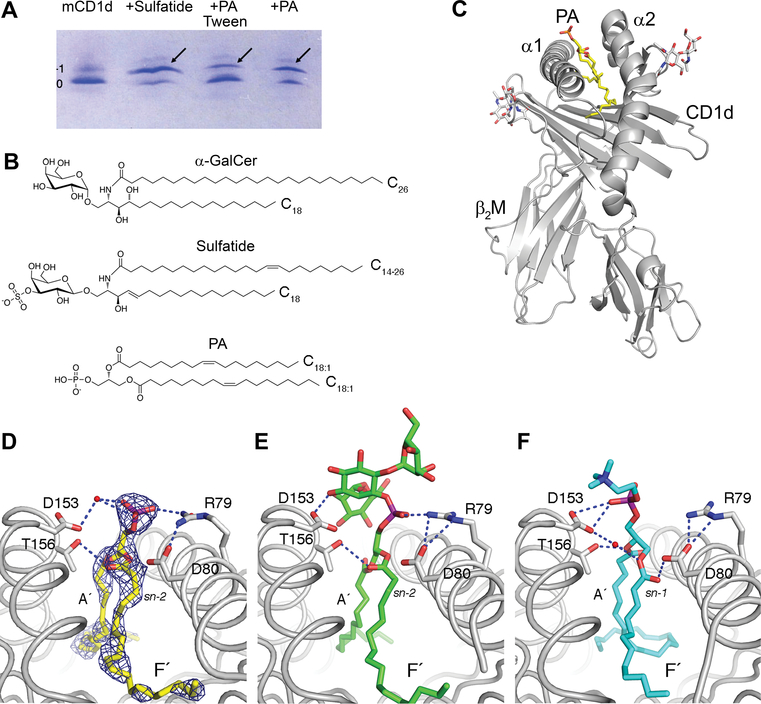
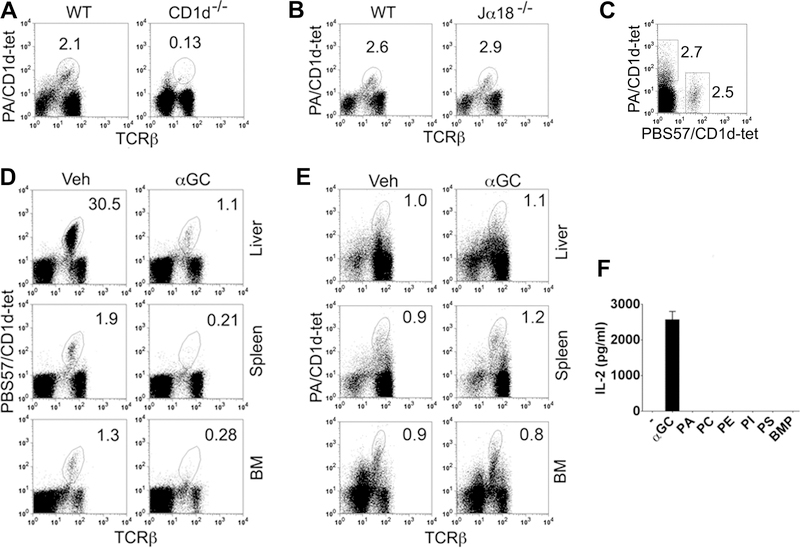
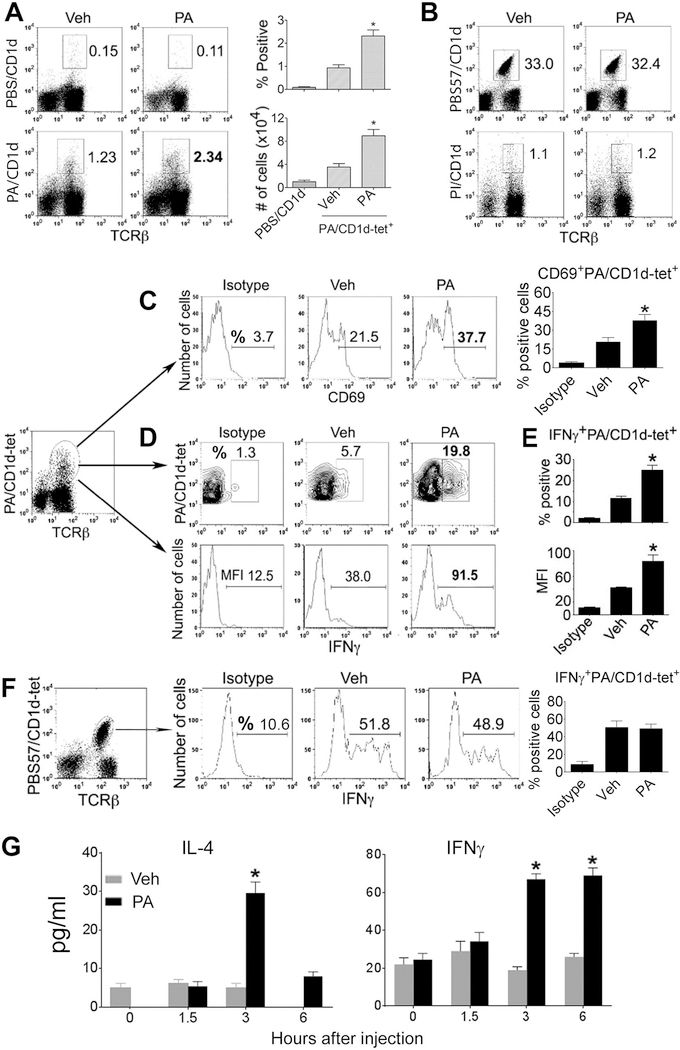
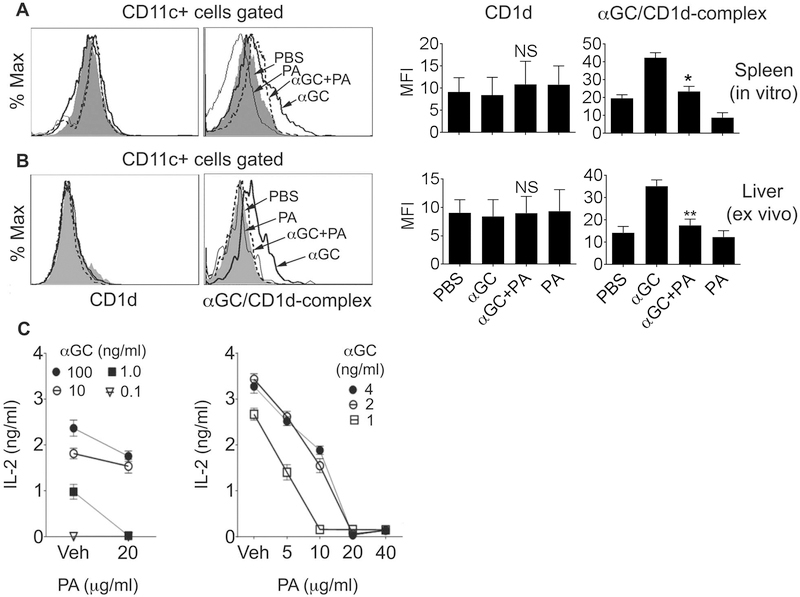
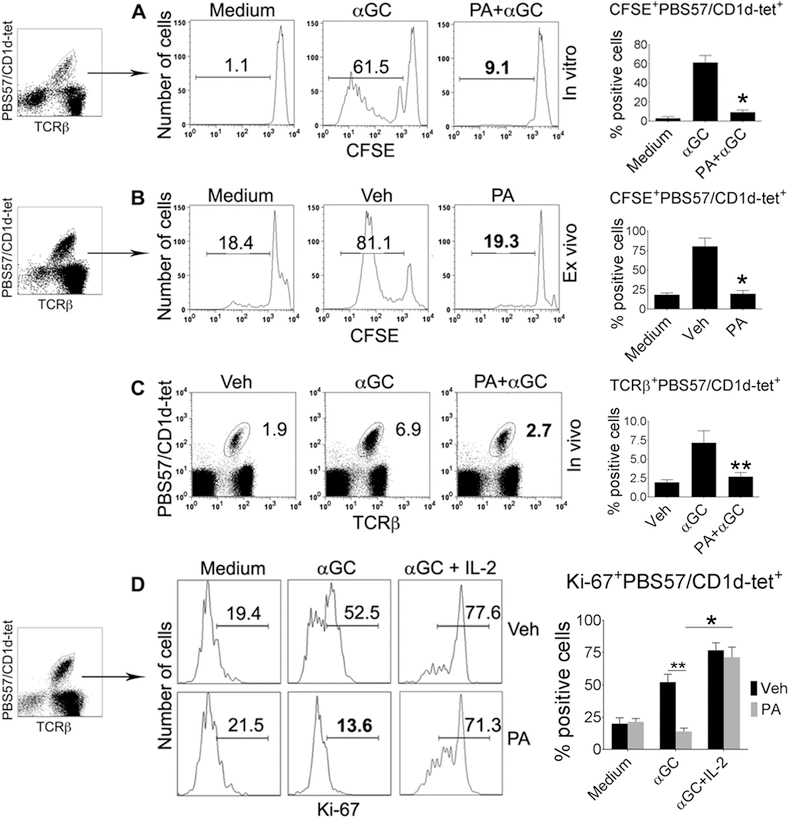
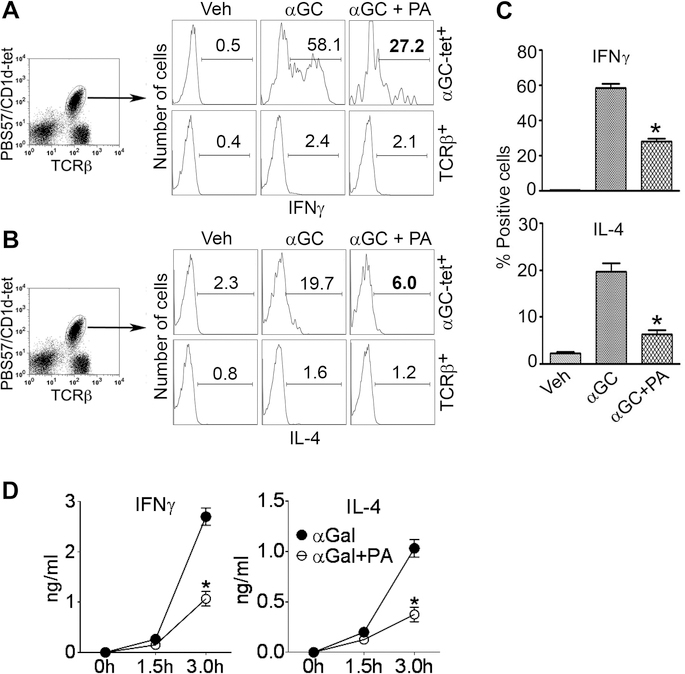
Glycosphingolipids and glycerophospholipids bind CD1d. Glycosphingolipid-reactive invariant NKT-cells (iNKT) exhibit myriad immune effects, however, little is known about the functions of phospholipid-reactive T cells (PLT). We report that the normal mouse immune repertoire contains αβ T cells, which recognize self-glycerophospholipids such as phosphatidic acid (PA) in a CD1d-restricted manner and don't cross-react with iNKT-cell ligands. PA bound to CD1d in the absence of lipid transfer proteins. Upon in vivo priming, PA induced an expansion and activation of T cells in Ag-specific manner. Crystal structure of the CD1d:PA complex revealed that the ligand is centrally located in the CD1d-binding groove opening for TCR recognition. Moreover, the increased flexibility of the two acyl chains in diacylglycerol ligands and a less stringent-binding orientation for glycerophospholipids as compared with the bindings of glycosphingolipids may allow glycerophospholipids to readily occupy CD1d. Indeed, PA competed with α-galactosylceramide to load onto CD1d, leading to reduced expression of CD1d:α-galactosylceramide complexes on the surface of dendritic cells. Consistently, glycerophospholipids reduced iNKT-cell proliferation, expansion, and cytokine production in vitro and in vivo. Such superior ability of self-glycerophospholipids to compete with iNKT-cell ligands to occupy CD1d may help maintain homeostasis between the diverse subsets of lipid-reactive T cells, with important pathogenetic and therapeutic implications.

Keywords: CD1d; iNKT cells; phosphatidic acid; phospholipid; phospholipid-reactive T cells.


Figures

Figure 1.
Figure 1.. Detection of phospholipid-reactive T cells.
(A) Freshly isolated spleen and liver mononuclear cells from naïve B6 mice were stained with CD1d tetramers loaded with PBS (PBS/CD1d), a GPL Ag (phosphatidic acid [PA]), and glycosphingolipid Ag sulfatide (Sulf) and αGalCer (αGC)-analog PBS57. Stained cells were analyzed for iNKT cells (αGalCer-reactive T cells), dNKT (sulfatide-reactive T cells), and PLT (PA-reactive T cells) on gated live non-B lymphocytes. Numbers on plots indicate TCRβ+tetramer+ cells as % of live lymphocytes. Dotplots shown are representative of more than five independent experiments, each using 2 to 4 mice. (B) Results are summarized as the mean ± SE % and absolute numbers of tetramer+ cells (n = 5–8 mice, pooled from two separate experiments). (C) Liver MNCs from naïve B6 mice were stained with PA-loaded CD1d tetramer (PA/CD1d-tet) and Ab for the indicated markers, and analyzed for PLT cells. Numbers on plots indicate % positive of PA/CD1d-tet+ T cells. Results shown are representative of three independent experiments, each using 2 to 4 mice. (D) Percentages of PLT cells expressing various markers are expressed as the mean ± SE (n = 5 mice pooled from two experiments).
Figure 2.
Figure 2.. Binding and presentation of PA to mCD1d.
(A) Binding of synthetic dioleoyl-PA (PA) to mCD1d, as detected by native IEF gel electrophoresis. mCD1d (negative control) was incubated with sulfatide (positive control) or PA overnight at RT and successful lipid loading was visualized as a gel shift by native IEF. Notably, 0.05% Tween-20 in loading buffer reduces loading efficiency (+PA Tween). (B) Chemical structures of PA and the NKT cell ligands sulfatide and αGalCer (αGC). (C) Schematic representation of the mCD1d:PA complex showing PA bound between the α1 and α2 helix of CD1d, which non-covalently associates with β2-microglobulin. (D) Details of PA presentation by mCD1d. PA is oriented by H-bonds (blue dotted lines with distance of 3.5Å or less) by CD1d residues D153 (through water-mediated H bond), T156 and R79. Electron density for the ligand is depicted as blue mesh (2FoFc map contoured at 1 sigma). PA binds with sn-2 linked fatty acid in F’ pocket, similar to the ligands phosphatidyl inositol dimannoside (PIM2) (E) and PC (F). The data are representative of two independent experiments.
Figure 3.
Figure 3.. Characterization of phospholipid-reactive T cells.
(A, B) Spleen cells from B6 CD1d–/– and BALB/c Jα18–/– mice and their respective wild-type (WT) controls were analyzed for PLT cells. Numbers on plots indicate % TCRβ+tetramer+ cells of live non-B lymphocytes. The data shown are representative of two (CD1d–/–) and three (Jα18–/–) independent experiments, each using 3 mice per group. (C) B6 spleen cells were stained with PE-labeled PA/CD1d and APC-labeled PBS57/CD1d tetramers, and analyzed for PLT and iNKT cells, respectively. Numbers on plots indicate % TCRβ+tetramer+ cells of live TCRβ+ lymphocytes. Data shown are representative of four independent experiments, each using 2 to 3 mice per group. (D, E) B6 mice were injected with vehicle (Veh) or αGalCer (2 μg i.p.). Their liver, spleen and bone marrow (BM) were harvested 24 h later, and analyzed for iNKT (D) or PLT cells (E). Numbers on plots indicate % TCRβ+tetramer+ cells of live non-B lymphocytes. The data shown are representative of three independent experiments, each using 2 to 3 mice per group. (F) PBS (–), αGalCer (10 ng/ml) or GPLs (20 μg/ml), including PA, PC, PE, PI, PS, and PG isomer BMP [bis(monoacylglycero)phosphate], were added to wells pre-coated with mCD1d, washed, and iNKT hybridoma cells added for 17 h. Supernatants were assayed for IL-2. The data shown are representative of three independent experiments.
Figure 4.
Figure 4.. Effect of immunization with PA on PA-reactive T cells in vivo.
(A) B6 mice were injected with vehicle (Veh) or PA (20 μg i.p.), and liver was harvested 24 h later. Isolated liver MNCs were stained with CD1d tetramers loaded with PBS or PA. Numbers on plots indicate % TCRβ+tetramer+ cells of live non-B lymphocytes. Dotplots shown are representative of four independent experiments, each using 2 to 3 mice per group. Percent positive and absolute numbers of PA/CD1d-tet+ cells from these animals are expressed as the mean ± SE in a bar diagram (*p <0.003; n = 9 mice/group, pooled from three experiments). (B) Liver MNCs from these animals were stained with CD1d tetramers loaded with PBS57 and PI, and analyzed on live non-B lymphocyte gate. Numbers on plots indicate % TCRβ+tetramer+ cells of live non-B lymphocytes. Data shown are representative of three experiments. (C) PA/CD1d-tet+ T cells from these animals were analyzed for CD69 expression (*p <0.0001; n = 9 mice/group; mean ± SE). (D-F) Liver MNCs isolated 24 h after a PA or vehicle injection were cultured for 5–6 h with 500 ng/ml ionomycin and 10 ng/ml PMA in presence of Golgi-plug (1 μl/ml), and cells analyzed for intracellular cytokines. Results of IFNγ production on gated TCRβ+ PA/CD1d-tet+ cells (D, E) or gated iNKT cells (F) are shown. Numbers on histograms represent % positive cells or MFI, as indicated. Data in (E) are presented as the mean ± SE % positive and MFI of IFNγ on gated PA/CD1d-tet+ cells (*p <0.002; n = 6 mice/group, pooled from three experiments). Data shown are representative of three independent experiments. (G) B6 mice were injected with vehicle (Veh) or PA (20 μg i.p.), and bled at the indicated timepoints. Their serum samples assayed by ELISA for cytokines (*p <0.001; n = 6–8 mice/timepoint, pooled from three separate experiments; mean ± SE).
Figure 5.
Figure 5.. PA competes with αGalCer for loading onto CD1d and presentation.
(A) Spleen cells were incubated with PBS (filled histogram), PA (20 μg/ml, gray line), αGalCer (αGC) (100 ng/ml, thick line) or PA + αGalCer (dashed line) for 20h. Cells were then stained with anti-CD1d or anti-CD1d:αGalCer complex (clone 363) and anti-CD11c Ab. Surface expression of CD1d and CD1d:αGalCer complexes on DCs (CD11c+) is shown in left and right panels, respectively. The data shown are representative of three independent experiments, each using cells from one animal. Combined data with statistics are shown in the bar diagrams (*p <0.001; n = 3). (B) B6 mice were injected with PBS (filled histogram), PA alone (gray line), αGalCer alone (thick line), or PA + αGalCer (dashed line). Animals were euthanized at 24h, and isolated liver leukocytes stained with Ab against CD1d or CD1d:αGalCer complex and CD11c. Stained cells were analyzed for surface expression of CD1d (left panels) or CD1d:αGalCer complexes (right panels) on DCs. Note the reduced expression of CD1d:αGalCer complexes on DCs in animals injected with PA + αGalCer as compared to animals injected with αGalCer alone. The data are representative of two independent experiments, each using three mice per group. Combined data with statistics are shown in the bar diagrams (**p<0.01; n = 3). (C) Plates were coated with soluble mCD1d and washed after 18 h. αGalCer at different concentrations was then added to these plates, followed immediately by addition of vehicle (Veh) or PA at concentrations indicated on figure panels. Plates were washed after 4 h, and iNKT hybridoma cells added. Supernatants collected after 17 h were tested for IL-2. Results are expressed as the mean ± SD of the mean triplicate values of IL-2. Similar results were obtained in another set of experiments using PA and αGalCer concentrations used in both panels.
Figure 6.
Figure 6.. Effect of PA on iNKT cell proliferation.
(A) Spleen cells from B6 mice were labeled with CFSE, and cultured with medium alone, αGalCer (αGC), or PA+αGalCer for 4 d at 37°C. iNKT cell proliferation was assessed by CSFE dilution in PBS57/CD1d-tet+ TCRβ+ live B220 lymphocytes. Numbers on plots indicate % positive cells. The data are representative of five independent experiments, each using spleen cells from one animal. (B) B6 mice were injected with PA or vehicle (Veh), and spleen harvested after 24 h. Spleen cells were labeled with CFSE, cultured with αGalCer for 4 d, and CFSE dilution analyzed on iNKT cells. The data are representative of five independent experiments, each using 3 mice per group. (C) B6 mice were injected with vehicle, αGalCer, or PA+αGalCer. Spleen cells isolated from these animals were analyzed for PBS57/CD1d-tet+ TCRβ+ cells on gated live B220 lymphocytes. The data shown are representative of three independent experiments, each using 3 to 4 mice per group. (D) B6 mice were injected with PA or vehicle, and spleen harvested 12h later. Spleen cells were cultured with medium alone, αGalCer or αGalCer+IL-2 for 4 d, and Ki-67 analyzed on iNKT cells. The data are representative of three independent experiments, each using 3 mice per group. Combined data with statistics are shown in the bar diagrams (*p <0.001, **p<0.01; n = 3–5).
Figure 7.
Figure 7.. Effect of PA on cytokine production by iNKT cells.
B6 mice were injected with PA (20 μg i.p.) + αGalCer (2–4 μg i.p.) or αGalCer (αGC) alone, and animals were euthanized 3 h later. Liver MNCs were isolated and analyzed for intracellular cytokines. Representative histograms show IFNγ+ (A) and IL-4+ (B) cells on gated iNKT cells (PBS57/CD1d tetramer+ TCRβ+; upper panels) or conventional T cells (tetramerTCRβ+; lower panels) from one of three independent experiments, each using 2 mice per group. Results are summarized in panel (C) (*p <0.004; n = 6 mice/group, pooled from three experiments; mean ± SE). (D) B6 mice were injected with αGalCer or αGalCer+PA, and animals bled at the indicated time points. Serum samples were assayed for cytokines by ELISA (*p =0.003; n = 6 mice/group, pooled from two separate experiments; mean ± SE).

Similar articles

Cited by

References

    1. van Meer G, Voelker DR and Feigenson GW, Membrane lipids: where they are and how they behave. Nat Rev Mol Cell Biol 2008. 9: 112–124. - PMC - PubMed
    1. De Libero G and Mori L, Structure and biology of self lipid antigens. Curr Top Microbiol Immunol 2007. 314: 51–72. - PubMed
    1. Brennan PJ, Brigl M and Brenner MB, Invariant natural killer T cells: an innate activation scheme linked to diverse effector functions. Nat Rev Immunol 2013. 13: 101–117. - PubMed
    1. Cox D, Fox L, Tian R, Bardet W, Skaley M, Mojsilovic D, Gumperz J and Hildebrand W, Determination of cellular lipids bound to human CD1d molecules. PLoS One 2009. 4: e5325. - PMC - PubMed
    1. Giabbai B, Sidobre S, Crispin MD, Sanchez-Ruiz Y, Bachi A, Kronenberg M, Wilson IA and Degano M, Crystal structure of mouse CD1d bound to the self ligand phosphatidylcholine: a molecular basis for NKT cell activation. J Immunol 2005. 175: 977–984. - PubMed

Publication types