. 2018 Dec 3;18(1):320.
doi: 10.1186/s12870-018-1551-7.

Identification and characterization of GmMYB118 responses to drought and salt stress

Affiliations

Identification and characterization of GmMYB118 responses to drought and salt stress

Yong-Tao Du et al. BMC Plant Biol. .

Abstract

Background: Abiotic stress severely influences plant growth and development. MYB transcription factors (TFs), which compose one of the largest TF families, play an important role in abiotic stress responses.

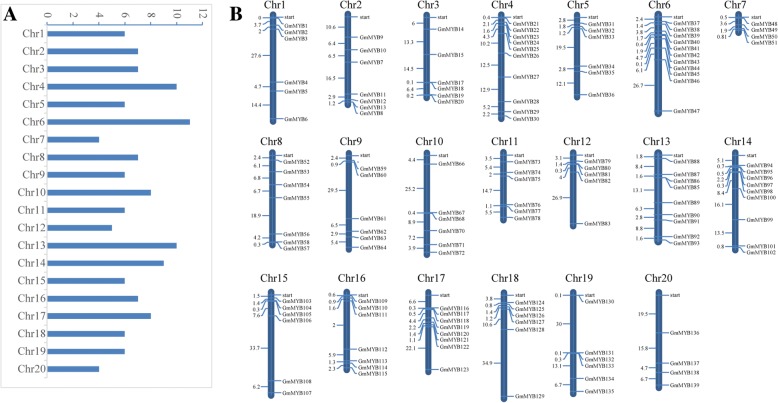
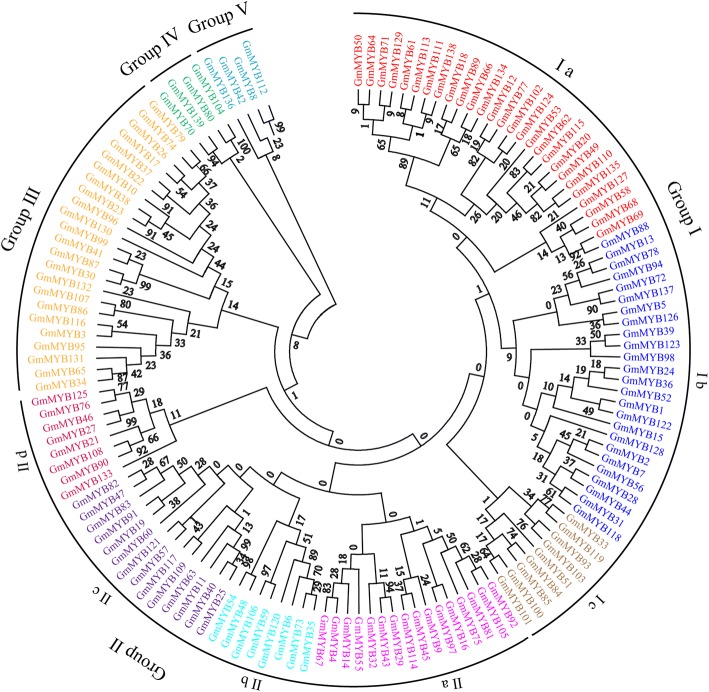
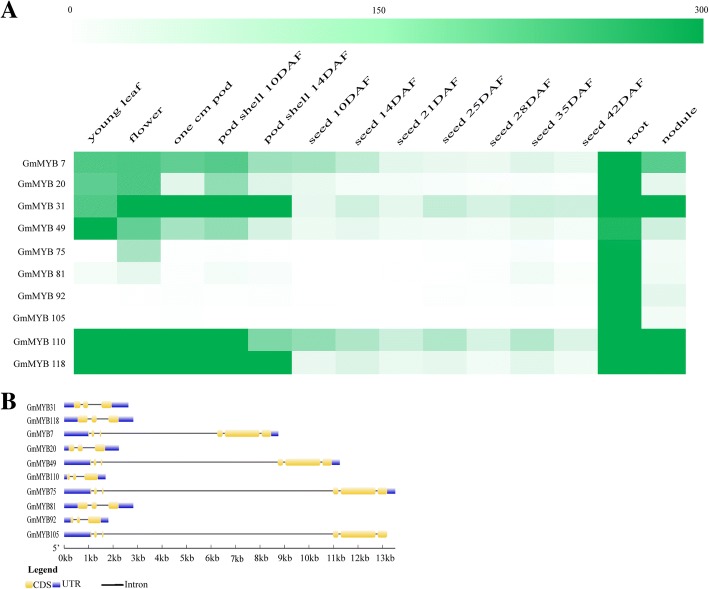
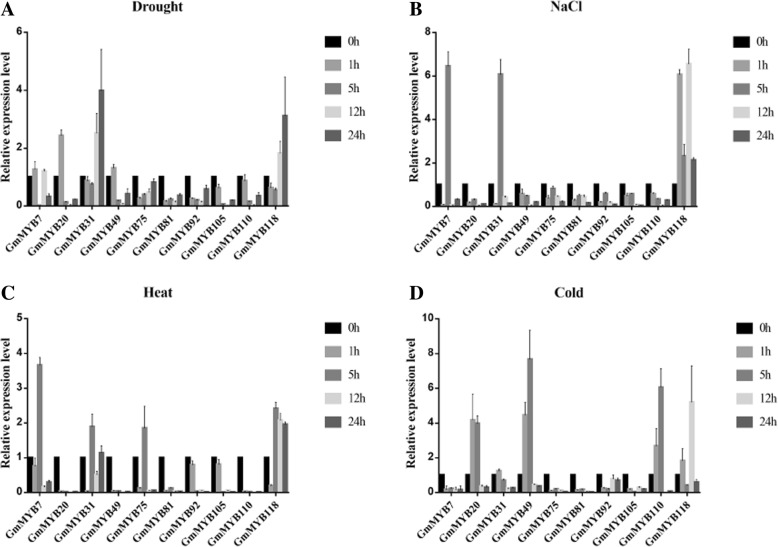
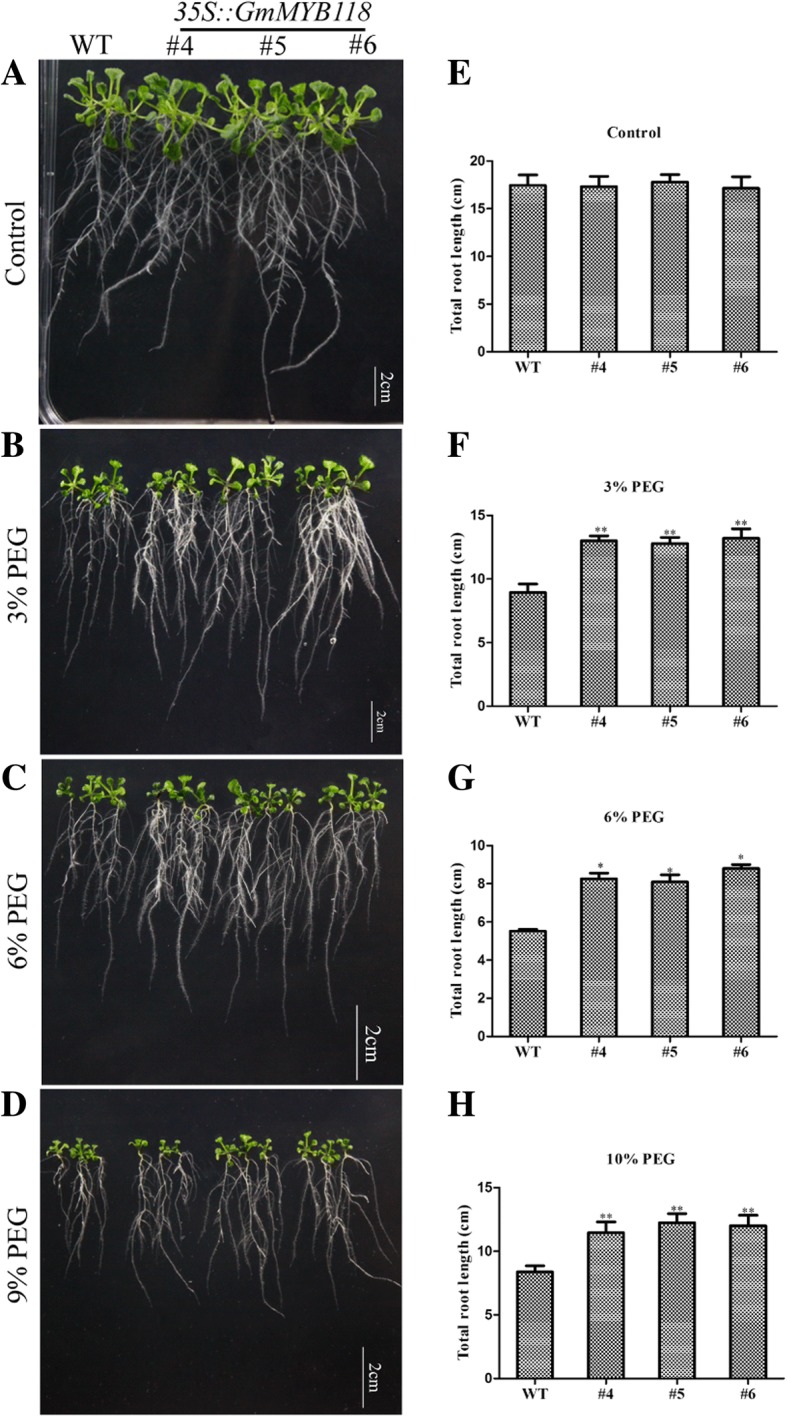
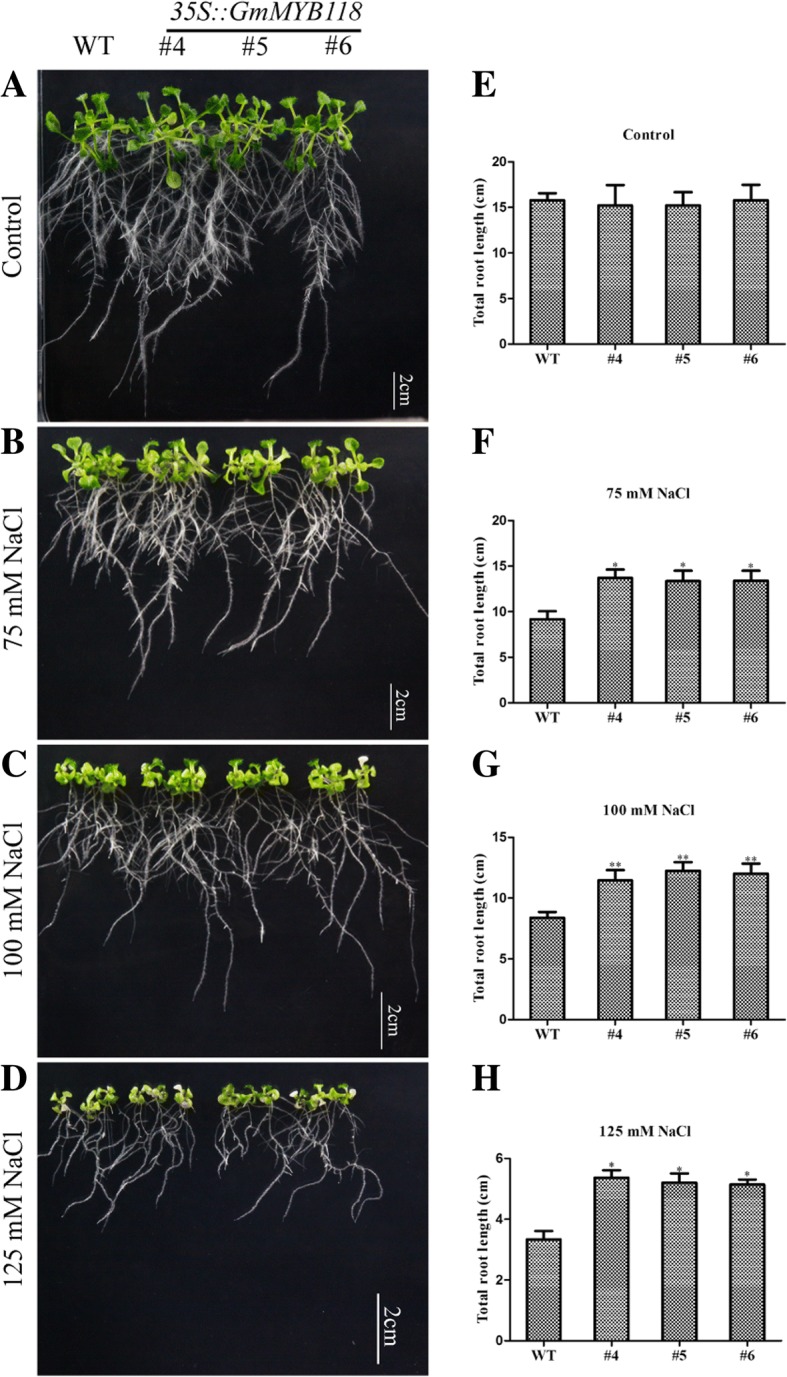
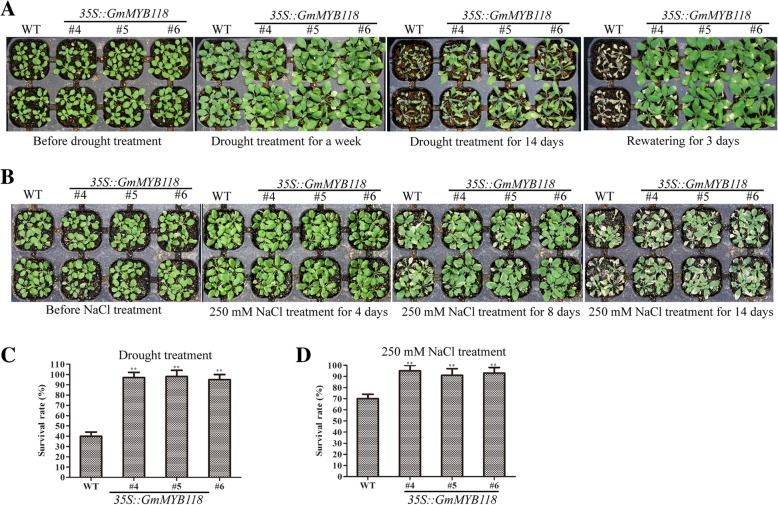
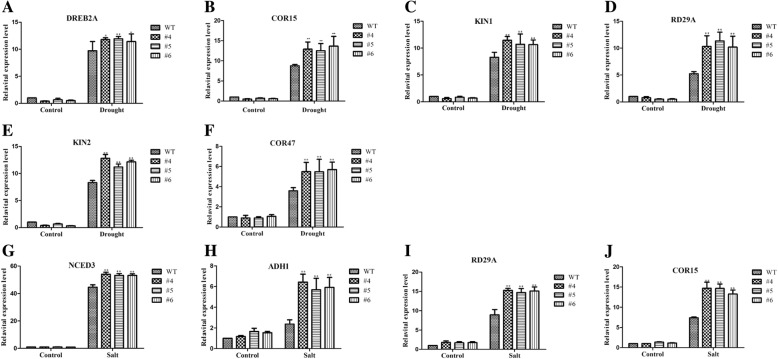
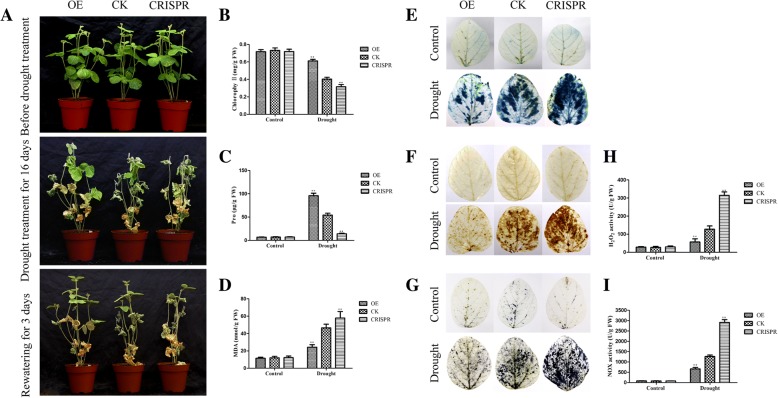
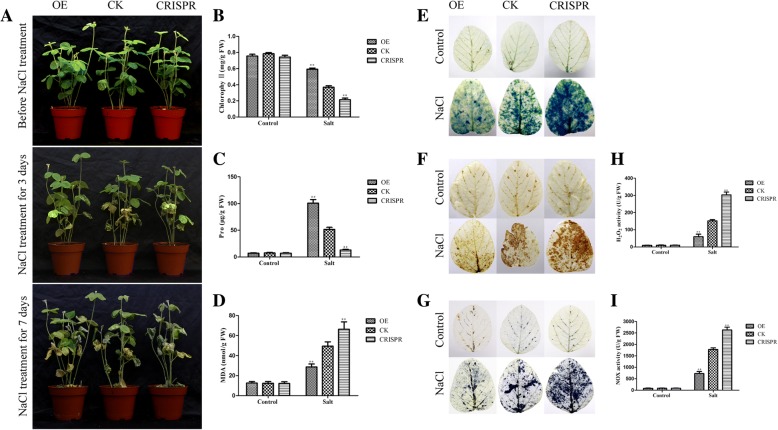
Result: We identified 139 soybean MYB-related genes; these genes were divided into six groups based on their conserved domain and were distributed among 20 chromosomes (Chrs). Quantitative real-time PCR (qRT-PCR) indicated that GmMYB118 highly responsive to drought, salt and high temperature stress; thus, this gene was selected for further analysis. Subcellular localization revealed that the GmMYB118 protein located in the nucleus. Ectopic expression (EX) of GmMYB118 increased tolerance to drought and salt stress and regulated the expression of several stress-associated genes in transgenic Arabidopsis plants. Similarly, GmMYB118-overexpressing (OE) soybean plants generated via Agrobacterium rhizogenes (A. rhizogenes)-mediated transformation of the hairy roots showed improved drought and salt tolerance. Furthermore, compared with the control (CK) plants, the clustered, regularly interspaced, short palindromic repeat (CRISPR)-transformed plants exhibited reduced drought and salt tolerance. The contents of proline and chlorophyll in the OE plants were significantly greater than those in the CK plants, whose contents were greater than those in the CRISPR plants under drought and salt stress conditions. In contrast, the reactive oxygen species (ROS) and malondialdehyde (MDA) contents were significantly lower in the OE plants than in the CK plants, whose contents were lower than those in the CRISPR plants under stress conditions.

Conclusions: These results indicated that GmMYB118 could improve tolerance to drought and salt stress by promoting expression of stress-associated genes and regulating osmotic and oxidizing substances to maintain cell homeostasis.

Keywords: CRISPR; Drought tolerance; Genome-wide analysis; MYB transcription factor; Salt tolerance; Soybean.


Conflict of interest statement

Ethics approval and consent to participate

Not applicable.

Consent for publication

Not applicable.

Competing interests

The authors declare that they have no competing interests.

Publisher’s Note

Springer Nature remains neutral with regard to jurisdictional claims in published maps and institutional affiliations.

Figures

Fig. 1
Fig. 1
Chromosomal distribution of 139 MYB-related genes in soybean. We identified 139 MYB-related genes in soybean by researching several databases such as Phytozome, TFDB, Pfam, SMART and ScanProsite. The members of MYB-related genes were distributed on different Chr (numbers 1–20) (a). The physical location of each member was shown in Figure (b). The deep blue bars represent the Chrs, and the Chr numbers were shown on the top of the bars. The length of the bar was not represented the size of the Chr. The numbers on the left side of the bars show the distances in megabases (Mb) between neighboring genes
Fig. 2
Fig. 2
Phylogenetic tree of the MYB-related TFs subfamily in soybean. Amino acid sequences were aligned via ClustalX and were manually corrected. The phylogenetic tree was constructed with MEGA 6 in conjunction with the NJ method. The same color represents the same group
Fig. 3
Fig. 3
Quantified prediction of tissue expression in soybean and sequence conservation analysis of the ten selected MYB-related TF genes. In accordance with the quantified prediction of fourteen tissue expression provided by SoyBase, the ten MYB-related TF genes that according to the quantified expression level of more than 300 were screened from the 139 MYB-related genes for further analysis. The deeper color represents a greater quantity (a). We analyzed the structure using Gene Structure Display Server (http://gsds.cbi.pku.edu.cn/) by submitting CDSs and genomic sequences (b)
Fig. 4
Fig. 4
Expression patterns of the ten selected MYB-related TF genes under salt, drought, cold and heat treatment. Fifteen-year-old seedling of soybean were treated with Drought (a), NaCl (b), Heat (c) and Cold (d) for 0, 1, 5, 12 and 24 h. The expression patterns of the ten select MYB-related TF genes under various abiotic stresses were quantified by qRT-PCR analysis. GmMYB118 clearly responded to multiple abiotic stresses including drought, salt, cold and heat stresses (a-d). The data were shown as the means ± SDs of three experiments
Fig. 5
Fig. 5
Root length phenotypes of EX lines under PEG treatment. The six-day-old seedlings grown on 1/2 MS were transferred to 1/2 MS medium containing different concentrations of PEG6000. A week later, the growth of roots was photographed of EX and WT (Col-0) seedlings under 0, 3, 6 and 9% PEG6000 treatment (a-d). Compared with those of the WT (Col-0) seedlings, the statistical results of total root length were shown of the EX seedlings under 0, 3, 6 and 9% PEG treatment (e-h). The data were shown as the means ± SDs (n = 30) of three experiments. ANOVA test demonstrated that there were significant differences ( P < 0.05, ∗∗ P < 0.01)
Fig. 6
Fig. 6
Root length phenotypes of EX lines under NaCl treatment. The six-day-old seedlings grown on 1/2 MS were transferred to 1/2 MS medium containing different concentrations of NaCl. A week later, the growth of roots was photographed of EX and WT (Col-0) seedlings under 0, 75, 100 and 125 mM NaCl treatment (a-d). Compared with those of the WT seedlings, the statistical results of total root length are shown of the EX seedlings under 0, 75, 100 and 125 mM NaCl treatment (e-h). The data were shown as the means ± SDs (n = 30) of three experiments. ANOVA test demonstrated that there were significant differences ( P < 0.05, ∗∗ P < 0.01)
Fig. 7
Fig. 7
Phenotypes of late-stage EX lines under drought and salt treatments. Three-week-old seedlings were subjected to drought and salt treatment for two weeks. Drought tolerance phenotypes of EX and WT (Col-0) lines under water deficit conditions (a). Salinity tolerance phenotypes of EX and WT (Col-0) lines under 250 mM NaCl conditions (b). The survival rate of the water-stressed plants was monitored 3 days after rewatering (c). The survival rate of the transgenic and WT (Col-0) lines under 250 mM NaCl for 14 days (d). The data were shown as the means ± SDs (n = 30) of three experiments. ANOVA test demonstrated that there were significant differences ( P < 0.05, ∗∗ P < 0.01)
Fig. 8
Fig. 8
GmMYB118 regulates stress-responsive gene expression in transgenic Arabidopsis plants. Extraction of RNA from two-week-old seedlings grown on 1/2 MS medium with drought and NaCl (100 mM) treatment for 2 h. Gene expression level was quantified by qRT-PCR assays. Expression of AtActin was analyzed as a control. Gene-specific primers were used to detect the expression levels of stress-related genes. The expression levels of drought-related genes significantly increased in transgenic Arabidopsis plants under drought treatment (a-f). The expression levels of salt-related genes significantly increased in the transgenic Arabidopsis plants under salt treatment (g-j). The data were the means ± SDs of three experiments. ANOVA test demonstrated that there were significant differences ( P < 0.05, ∗∗ P < 0.01)
Fig. 9
Fig. 9
GmMYB118 improves drought stress tolerance in transgenic soybean hairy roots. The seedlings with 2–5 cm hairy roots were grown for 5 days on pot under normal condition, then, the plants were dehydrated for 16 days. Survival rate of the water-stressed plants was monitored 3 days after rewatering. Image of drought resistance phenotypes of OE, CK and CRISPR plants under drought conditions was shown (a). The leaves contents of Chlorophyll (b), Proline (c) and MDA (d) were detected in OE, CK and CRISPR plants under drought or normal growth condition for a week. Trypan blue staining of soybean plant leaves without irrigation for 14 days (e), the dead cells can be strained, but living cells cannot. DAB (f) and NBT (g) staining of the leaves of OE, CK and CRISPR plants after drought treatment or normal condition for 7 days. The depth of color shows the concentration of H2O2 and O2 in the leaves (f-g). The content of H2O2 (h) and O2 (i) in the leaves of OE, CK and CRISPR plants after drought treatment or normal condition for 7 days. The data were means ± SDs of three experiments. ANOVA test demonstrated that there were significant differences ( P < 0.05, ∗∗ P < 0.01)
Fig. 10
Fig. 10
GmMYB118 improves salt stress tolerance in transgenic soybean hairy roots. The seedlings with 2–5 cm hairy roots were grown for 5 days on pot under normal condition, then, the plants were 250 mM NaCl treated for a week. Image of salinity resistance phenotypes of OE, CK and CRISPR plants under salt conditions was shown (a). The leaves contents of Chlorophyll (b), Proline (c) and MDA (d) were detected in OE, CK and CRISPR plants with 250 mM NaCl treatment or normal growth condition for 3 days. Trypan blue staining of soybean plant leaves without irrigation for a week (e), the dead cells can be strained, but living cells cannot. DAB (f) and NBT (g) staining of the leaves of OE, CK and CRISPR plants after 250 mM NaCl treatment or normal condition for 3 days. The depth of color shows the concentration of H2O2 and O2 in the leaves (f-g). The content of H2O2 (h) and O2 (i) in the leaves of OE, CK and CRISPR plants after 250 mM NaCl treatment or normal condition for 3 days. The data were means ± SDs of three experiments. ANOVA test demonstrated that there were significant differences ( P < 0.05, ∗∗ P < 0.01)

Similar articles

Cited by

References

    1. Wang F, Chen HW, Li QT, Wei W, Li W, Zhang WK, Ma B, Bi YD, Lai YC, Liu XL, et al. GmWRKY27 interacts with GmMYB174 to reduce expression of GmNAC29 for stress tolerance in soybean plants. Plant J. 2015;83(2):224–236. doi: 10.1111/tpj.12879. - DOI - PubMed
    1. Yamaguchi-Shinozaki K, Shinozaki K. Transcriptional regulatory networks in cellular responses and tolerance to dehydration and cold stresses. Annu Rev Plant Biol. 2006;57:781–803. doi: 10.1146/annurev.arplant.57.032905.105444. - DOI - PubMed
    1. Xu ZS, Chen M, Li LC, Ma YZ. Functions of the ERF transcription factor family in plants. Botany. 2008;86(9):969–977. doi: 10.1139/B08-041. - DOI
    1. Xu ZS, Chen M, Li LC, Ma YZ. Functions and application of the AP2/ERF transcription factor family in crop improvement. J Integr Plant Biol. 2011;53(7):570–585. doi: 10.1111/j.1744-7909.2011.01062.x. - DOI - PubMed
    1. Yanhui C, Xiaoyuan Y, Kun H, Meihua L, Jigang L, Zhaofeng G, Zhiqiang L, Yunfei Z, Xiaoxiao W, Xiaoming Q, et al. The MYB transcription factor superfamily of Arabidopsis: expression analysis and phylogenetic comparison with the rice MYB family. Plant Mol Biol. 2006;60(1):107–124. doi: 10.1007/s11103-005-2910-y. - DOI - PubMed

MeSH terms