. 2018 Dec 3;19(1):865.
doi: 10.1186/s12864-018-5248-y.

Histological, transcriptomic and in vitro analysis reveal an intrinsic activated state of myogenic precursors in hyperplasic muscle of trout

Affiliations

Histological, transcriptomic and in vitro analysis reveal an intrinsic activated state of myogenic precursors in hyperplasic muscle of trout

Sabrina Jagot et al. BMC Genomics. .

Abstract

Background: The dramatic increase in myotomal muscle mass in post-hatching fish is related to their ability to lastingly produce new muscle fibres, a process termed hyperplasia. The molecular and cellular mechanisms underlying fish muscle hyperplasia largely remain unknown. In this study, we aimed to characterize intrinsic properties of myogenic cells originating from hyperplasic fish muscle. For this purpose, we compared in situ proliferation, in vitro cell behavior and transcriptomic profile of myogenic precursors originating from hyperplasic muscle of juvenile trout (JT) and from non-hyperplasic muscle of fasted juvenile trout (FJT) and adult trout (AT).

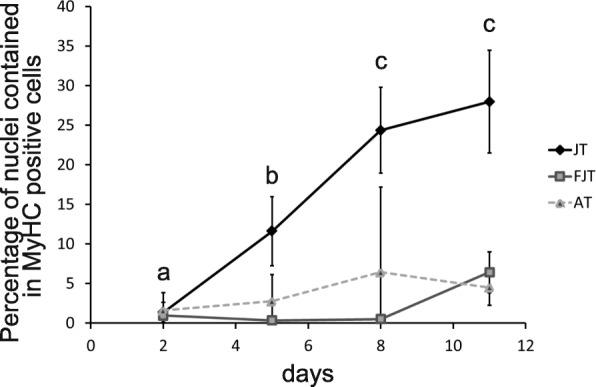
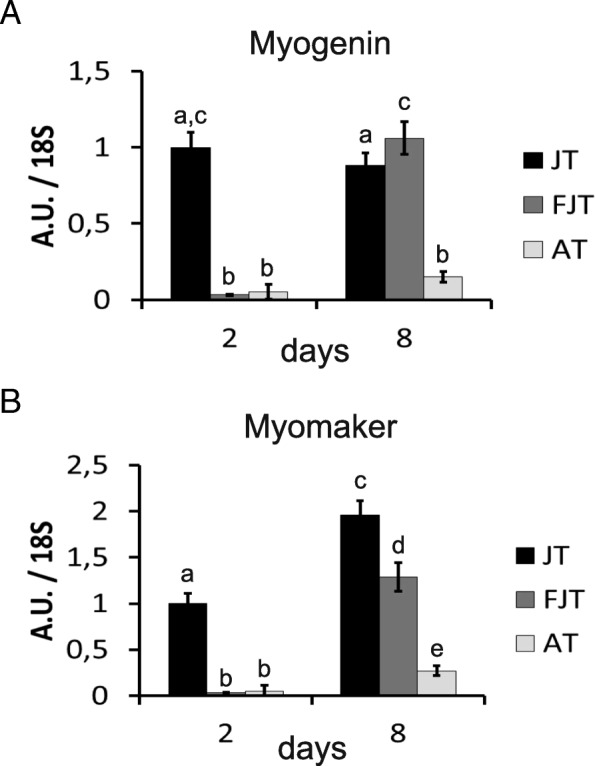
Results: For the first time, we showed that myogenic precursors proliferate in hyperplasic muscle from JT as shown by in vivo BrdU labeling. This proliferative rate was very low in AT and FJT muscle. Transcriptiomic analysis revealed that myogenic cells from FJT and AT displayed close expression profiles with only 64 differentially expressed genes (BH corrected p-val < 0.001). In contrast, 2623 differentially expressed genes were found between myogenic cells from JT and from both FJT and AT. Functional categories related to translation, mitochondrial activity, cell cycle, and myogenic differentiation were inferred from genes up regulated in JT compared to AT and FJT myogenic cells. Conversely, Notch signaling pathway, that signs cell quiescence, was inferred from genes down regulated in JT compared to FJT and AT. In line with our transcriptomic data, in vitro JT myogenic precursors displayed higher proliferation and differentiation capacities than FJT and AT myogenic precursors.

Conclusions: The transcriptomic analysis and examination of cell behavior converge to support the view that myogenic cells extracted from hyperplastic muscle of juvenile trout are intrinsically more potent to form myofibres than myogenic cells extracted from non-hyperplasic muscle. The generation of gene expression profiles in myogenic cell extracted from muscle of juvenile trout may yield insights into the molecular and cellular mechanisms controlling hyperplasia and provides a useful list of potential molecular markers of hyperplasia.

Keywords: Differentiation; Fish; Hyperplasia; Muscle stem cell; Myoblast; Proliferation.


Conflict of interest statement

Ethics approval

Fish used in this study were reared and handled in strict accordance with French and European policies and guidelines of the Institutional Animal Care and Use Committee (no. 3312–20 15,121,511 022362 and 3313–20 15,121,511 094929), which approved this study.

Consent for publication

Not applicable.

Competing interests

The authors declare that they have no competing interests.

Publisher’s Note

Springer Nature remains neutral with regard to jurisdictional claims in published maps and institutional affiliations.

Figures

Fig. 1
Fig. 1
Quantification of satellite cells proliferation in hyperplasic and non-hyperplasic muscle of trout (a) Muscle cross sections stained with anti-laminin (red) and anti-BrdU (green) in trout of 2 g, 500 g and of 3-weeks fasted trout (5 g). Nuclei were counter-stained with DAPI (blue) (scale bar = 20 μm). b Quantification of BrdU positive nuclei (% ± SD) in satellite cells position, (under the basal lamina), in white muscle of trout weighing 2 g, 500 g and of 3-weeks fasted trout weighing 5 g. Different letters indicate a significant difference between means (Kruskal-Wallis and Dunn’s multiple comparisons test; p-value ≤0.05; n = 5)
Fig. 2
Fig. 2
Hierarchical clustering of differentially expressed genes between JT myogenic precursors and FJT and AT myogenic precursors. Each row represents the expression pattern of a single gene and each column corresponds to a single sample: columns 1 to 5: JT myogenic precursors sampled; columns 6 to 10: FJT myogenic precursors sampled; and columns 11 to 15: AT myogenic precursors sampled. The expression levels are represented by colored tags, with red representing the highest levels of expression and blue representing the lowest levels of expression
Fig. 3
Fig. 3
Hierarchical clustering of differentially expressed cell cycle genes between JT myogenic precursors and FJT and AT myogenic precursors. Each row represents the expression pattern of a single gene and each column corresponds to a single sample: columns 1 to 5: JT myogenic precursors sampled; columns 6 to 10: FJT myogenic precursors sampled; and columns 11 to 15: AT myogenic precursors sampled. The expression levels are represented by colored tags, with red representing the highest levels of expression and blue representing the lowest levels of expression
Fig. 4
Fig. 4
Hierarchical clustering of differentially expressed myogenic genes between JT myogenic precursors and FJT and AT myogenic precursors. Each row represents the expression pattern of a single gene and each column corresponds to a single sample: columns 1 to 5: JT myogenic precursors sampled; columns 6 to 10: FJT myogenic precursors sampled; and columns 11 to 15: AT myogenic precursors sampled. The expression levels are represented by colored tags, with red representing the highest levels of expression and blue representing the lowest levels of expression
Fig. 5
Fig. 5
Proliferation rate of JT, FJT and AT myogenic precursors after 2, 5, 8, 11 days of plating (D2, D5, D8 and D11). Each point represents the mean (% ± SD) of BrdU positive nuclei ratio for each condition at D2, D5, D8 and D11. Different letters indicate a significant difference between means (two-way ANOVA and Tukey’s multiple comparisons test; p-value ≤0.05; n ≥ 5)
Fig. 6
Fig. 6
Differentiation rate of JT, FJT and AT myogenic precursors after 2, 5, 8, 11 days in culture (D2, D5, D8 and D11). Each point represents the mean (% ± SD) of the percentage of nuclei contained in MyHC positive cells for each condition at D2, D5, D8 and D11. Different letters indicate a significant difference between means (two-way ANOVA and Tukey’s multiple comparisons test; p-value ≤0.05; n ≥ 6)
Fig. 7
Fig. 7
Quantification of the expression of myogenin and myomaker in JT, FJT and AT myogenic precursors. Each bar represents the mean (AU ± SD) of the expression of myogenin (a) and myomaker (b) normalized by the expression mean of 18S as referential gene for each condition at D2 and D8. Different letters indicate a significant difference between means (two-way ANOVA and Tukey’s multiple comparisons test; p-value ≤0.05; n ≥ 4)

References

    1. Rowlerson A, Mascarello F, Radaelli G, Veggetti A. Differentiation and growth of muscle in the fish Sparus aurata (L): II. Hyperplastic and hypertrophic growth of lateral muscle from hatching to adult. J Muscle Res Cell Motil. 1995;16:223–236. doi: 10.1007/BF00121131. - DOI - PubMed
    1. Koumans JTM, Akster HA, Booms GHR, Osse JWM. Growth of carp (Cyprinus carpio) white axial muscle; hyperplasia and hypertrophy in relation to the myonucleus/sarcoplasm ratio and the occurrence of different subclasses of myogenic cells. J Fish Biol. 1993;43:69–80. doi: 10.1111/j.1095-8649.1993.tb00411.x. - DOI
    1. Veggetti A, Mascarello F, Scapolo PA, Rowlerson A. Hyperplastic and hypertrophic growth of lateral muscle in Dicentrarchus labrax (L.) Anat Embryol. 1990;182:1–10. doi: 10.1007/BF00187522. - DOI - PubMed
    1. Stickland NC. Growth and development of muscle fibres in the rainbow trout (Salmo gairdneri) J Anat. 1983;137(Pt 2):323–333. - PMC - PubMed
    1. Rescan P-Y, Rallière C, Lebret V, Fretaud M. Analysis of muscle fibre input dynamics using a myog:GFP transgenic trout model. J Exp Biol. 2015;218:1137–1142. doi: 10.1242/jeb.113704. - DOI - PubMed

MeSH terms