

A dual-AAV approach restores fast exocytosis and partially rescues auditory function in deaf otoferlin knock-out mice
- PMID: 30509897
- PMCID: PMC6328916
- DOI: 10.15252/emmm.201809396
A dual-AAV approach restores fast exocytosis and partially rescues auditory function in deaf otoferlin knock-out mice
Abstract
Normal hearing and synaptic transmission at afferent auditory inner hair cell (IHC) synapses require otoferlin. Deafness DFNB9, caused by mutations in the OTOF gene encoding otoferlin, might be treated by transferring wild-type otoferlin cDNA into IHCs, which is difficult due to the large size of this transgene. In this study, we generated two adeno-associated viruses (AAVs), each containing half of the otoferlin cDNA Co-injecting these dual-AAV2/6 half-vectors into the cochleae of 6- to 7-day-old otoferlin knock-out (Otof-/-) mice led to the expression of full-length otoferlin in up to 50% of IHCs. In the cochlea, otoferlin was selectively expressed in auditory hair cells. Dual-AAV transduction of Otof-/- IHCs fully restored fast exocytosis, while otoferlin-dependent vesicle replenishment reached 35-50% of wild-type levels. The loss of 40% of synaptic ribbons in these IHCs could not be prevented, indicating a role of otoferlin in early synapse maturation. Acoustic clicks evoked auditory brainstem responses with thresholds of 40-60 dB. Therefore, we propose that gene delivery mediated by dual-AAV vectors might be suitable to treat deafness forms caused by mutations in large genes such as OTOF.
Keywords: deafness; gene therapy; hearing restoration; inner ear; inner hair cell.
© 2018 The Authors. Published under the terms of the CC BY 4.0 license.
Figures
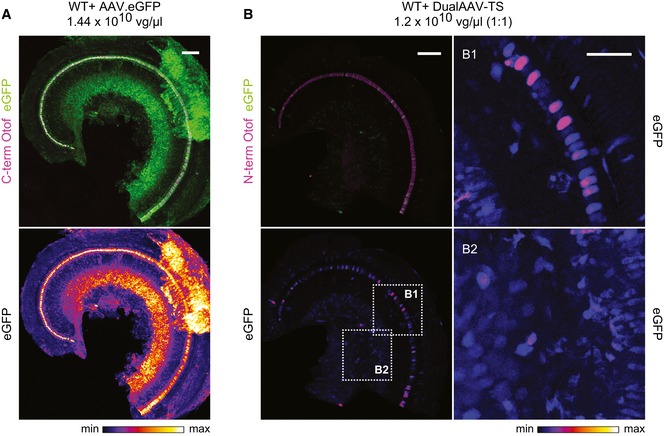
- A, B
Low magnification views for eGFP immunofluorescence in CD1B6F1 wild‐type organs of Corti transduced with AAV2/6 vectors, indicating a broad cell type tropism both for a single eGFP‐expressing AAV2/6 (A; P23) and eGFP expressed from otoferlin dual‐AAV‐TS vectors (B; P27). Images were acquired and displayed with the same settings. Organs of Corti were co‐immunolabeled for otoferlin (magenta) to visualize IHCs. (B1, B2) High magnification views of (B) displayed with higher intensity showing eGFP immunofluorescence in IHCs and supporting cells (B1) and in spiral ganglion neurons (B2) in dual‐AAV‐TS‐treated wild‐type mice. Individual eGFP immunostainings were depicted as color lookup tables with warmer colors representing higher pixel intensities (max). Maximum intensity projections of optical confocal sections. Vg, vector genomes. Scale bars: 100 μm (A, B), 50 μm (B1, B2).
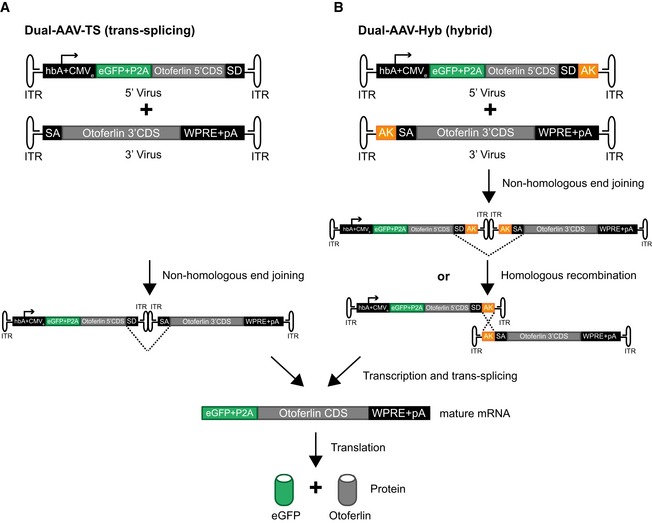
- A, B
Schematic representation of the otoferlin dual‐AAV‐TS (A) and dual‐AAV‐Hyb (B) half‐vectors used for postnatal cochlear injections. Both otoferlin dual‐AAV half‐vector systems contain the first half of the otoferlin coding sequence (CDS) in the 5′‐AAV and the other half in the 3′‐AAV half‐vector. The correct reconstitution of the full‐length otoferlin mRNA in the dual‐AAV‐TS strategy is mediated by non‐homologous end joining of the inverted terminal repeats (ITRs). In the dual‐AAV‐Hyb strategy, the reassembly is mediated by non‐homologous end joining of the ITRs and/or homologous recombination of the highly recombinogenic AK sequence. Splice donor (SD) and splice acceptor (SA) sites facilitate the excision of the ITRs via trans‐splicing. The woodchuck hepatitis virus post‐transcriptional regulatory element (WPRE) stabilizes the mRNA. To ensure the production of two separate proteins, a P2A peptide inducing ribosomal skipping is introduced between the eGFP and the otoferlin CDS. hbA: human beta‐actin promoter, CMVe: cytomegalovirus enhancer, pA: polyadenylation signal.
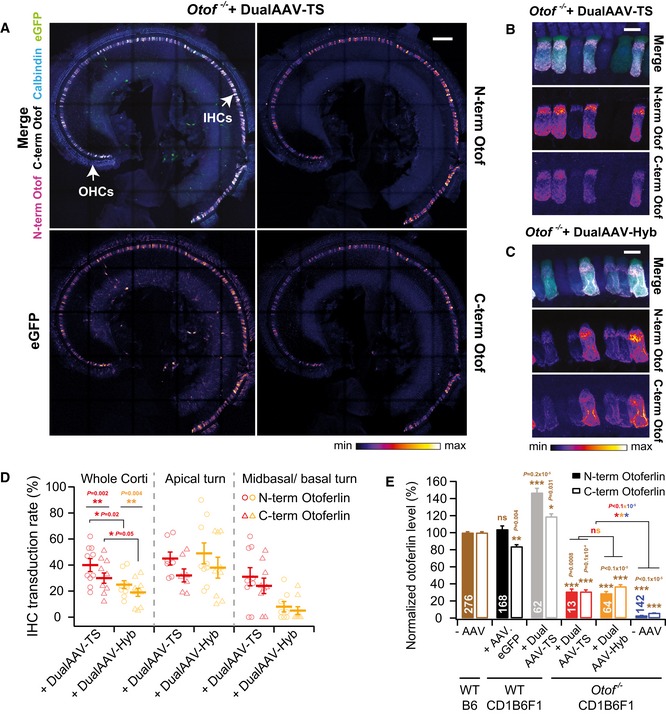
- A
Low magnification views of a CD1‐Otof −/− organ of Corti (P23)‐transduced with otoferlin dual‐AAV‐TS vectors. IHCs: inner hair cells, OHCs: outer hair cells.
- B, C
High magnification views of CD1B6F1‐Otof −/− IHCs transduced with otoferlin dual‐AAV‐TS (P26) (B) and dual‐AAV‐Hyb (P26) (C) vectors. Individual eGFP and otoferlin immunostainings are depicted as color lookup tables in (A‐C) with warmer colors representing higher pixel intensities. See Fig EV3 for comparison to wild‐type IHCs.
- D
Percentage of N‐ and C‐terminal otoferlin labeled IHCs in dual‐AAV‐TS (n = 10 mice)‐ and dual‐AAV‐Hyb (n = 9 mice)‐injected CD1B6F1‐Otof −/− mice (P18–30).
- E
Average N‐terminal and C‐terminal otoferlin immunofluorescence levels in dual‐AAV‐transduced Otof −/− and wild‐type IHCs (P23–30). Otoferlin levels were normalized to immunofluorescence levels in non‐transduced B6 wild‐type IHCs for each antibody separately.
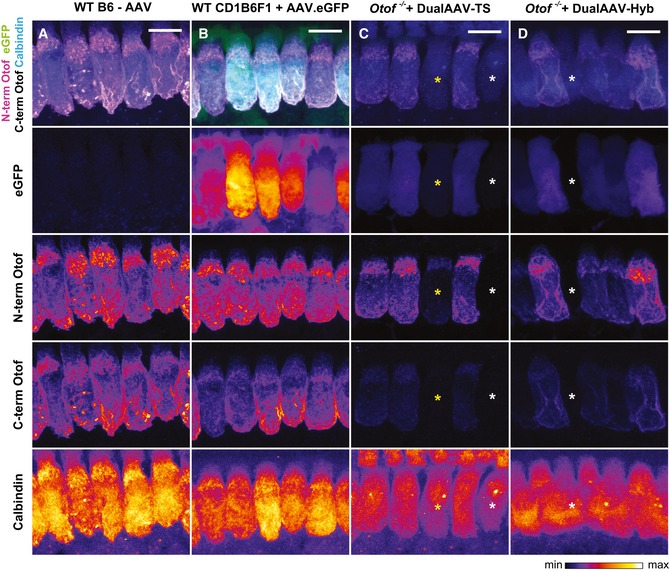
- A–D
High magnification views of dual‐AAV‐TS (C; P26) and dual‐AAV‐Hyb (D; P26)‐transduced CD1B6F1‐Otof −/− IHCs depicted in Fig 1B and C and compared to AAV2/6.eGFP transduced CD1B6F1 wild‐type (B; P28) and non‐injected B6 wild‐type (A; P27) IHCs. Successful virus transduction is monitored via eGFP immunofluorescence. Organs of Corti were immunolabeled against the N‐terminal (magenta) and C‐terminal (white) part of otoferlin. HCs were immunolabeled with calbindin. Individual eGFP, otoferlin, and calbindin immunostainings are depicted as color lookup tables with warmer colors representing higher pixel intensities. Non‐transduced IHCs are labeled with white asterisks, and one transduced IHC displaying only eGFP and N‐terminal otoferlin fluorescence, but hardly any C‐terminal otoferlin fluorescence with a yellow asterisk. All samples were processed in parallel and acquired and displayed with the same settings. Maximum intensity projections of optical confocal sections. Scale bars: 10 μm.
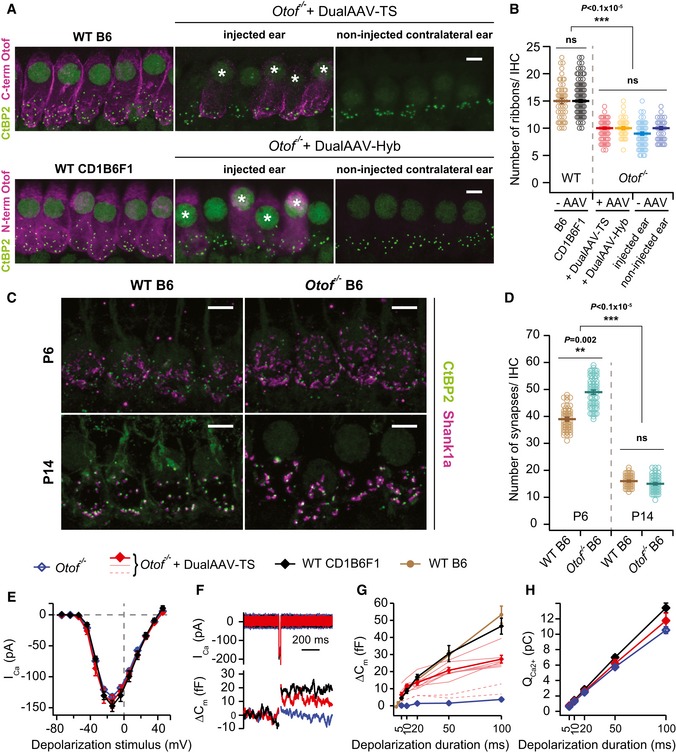
- A
High magnification views of IHCs immunolabeled for otoferlin and synaptic ribbons (CtBP2) from wild‐type (B6: P27, CD1B6F1: P29), dual‐AAV‐injected CD1B6F1‐Otof −/− (dualAAV‐TS: P26, dualAAV‐Hyb: P28), and their contralateral non‐injected ears. (*) Transduced cells. Maximum intensity projections of optical confocal sections. Scale bars: 5 μm.
- B
Synaptic ribbon numbers quantified from IHCs in apical cochlear turns of wild‐type (B6: n = 48 IHCs, CD1B6F1: n = 108 IHCs), transduced Otof −/− (dualAAV‐TS: n = 59 IHCs, dualAAV‐Hyb: n = 37 IHCs), and non‐transduced Otof −/− IHCs from injected (‐AAV‐injected ear, n = 65 IHCs) and contralateral non‐injected (‐AAV non‐injected ear, n = 46 IHCs) ears (P25–29).
- C
IHC synapses labeled with CtBP2 and the postsynaptic marker Shank1a in B6 wild‐type and Otof −/− P6 and P14 organs of Corti. Maximum intensity projections of optical confocal sections. Scale bars: 5 μm.
- D
Synapse numbers quantified from IHCs in apical cochlear turns (C) of B6 wild‐type (P6: n = 53 IHCs; P14: n = 73 IHCs) and B6‐Otof −/− (P6: n = 62 IHCs; P14: n = 65 IHCs) mice at two different developmental stages (P6 and P14).
- E
Ca2+‐current–voltage relationship of control CD1B6F1 wild‐type (n = 6 IHCs), dual‐AAV‐TS‐transduced (n = 8 IHCs), and non‐transduced CD1B6F1‐Otof −/− (n = 10 IHCs) IHCs (P14–18).
- F
Representative Ca2+‐currents (Ica) and IHC plasma membrane capacitance increments (ΔCm) of a wild‐type control, transduced, and non‐transduced Otof −/− IHC in response to a 20 ms depolarization pulse at maximum Ca2+‐current potentials (typically −14 mV).
- G, H
Average exocytosis level measured as ΔCm (G) and corresponding Ca2+‐current integrals (QCa2+) (H) in wild‐type [CD1B6F1: n = 6 IHCs; B6: n = 11 IHCs (B6 data replotted from Strenzke et al, 2016)], dual‐AAV‐TS‐transduced Otof −/− (n = 8 IHCs), and non‐transduced (n = 11 IHCs) Otof −/− IHCs. Individual dual‐AAV‐TS transduced Otof −/− IHCs expressing eGFP, that had exocytosis (thinner red lines) and almost no exocytosis (broken red lines; not included into the average), are depicted.
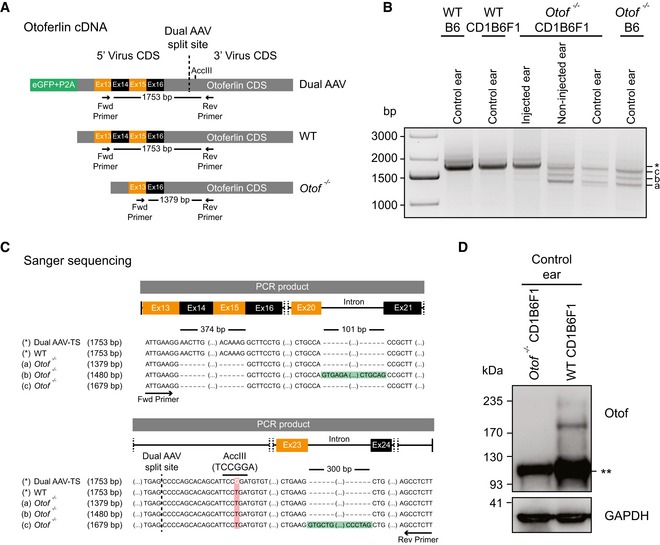
- A
Schematic representation of otoferlin cDNA from otoferlin dual‐AAV‐transduced, wild‐type, and Otof −/− organs of Corti, displaying binding sites of primers used in PCRs to assess dual‐AAV reassembly.
- B
Otoferlin PCR amplicons from organ of Corti cDNA. A 1,753‐bp‐long amplicon (*), also present in non‐injected wild‐type controls (WTB6, WTCD1B6F1), indicates successful reassembly of the split otoferlin expression cassette in otoferlin dual‐AAV‐TS‐transduced CD1B6F1‐Otof −/− organs of Corti (injected ear). In Otof −/− samples, three shorter products were amplified (a, b and c).
- C
Sanger sequencing confirmed correct dual‐AAV split‐site assembly (dashed line) as well as the presence of an artificial AccIII restriction site introduced in the dual‐AAV‐TS otoferlin cDNA, which is absent in the wild‐type (WT) and Otof −/− cDNA (a–c). Amplicons a‐c from Otof −/− organs of Corti all lack exons 14–15, while bands “b” (1,480 bp) and “c” (1,679 bp) still contain intron 20–21 (b) or intron 23–24 (c), respectively.
- D
Western blotting on cell lysates of WT and Otof −/− CD1B6F1 organs of Corti. Two bands of ˜210–230 kDa, corresponding to full‐length otoferlin, were detected in WT but absent in Otof −/− ears. (**) refers to an unspecific band detected in both samples. GAPDH was used as loading control.
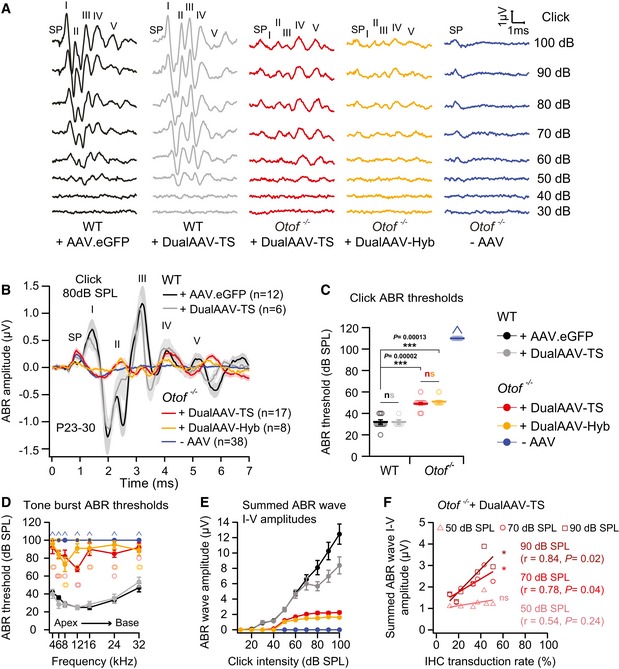
- A
Representative ABR wave traces in response to broadband click sound stimuli from otoferlin dual‐AAV‐TS (P26) and dual‐AAV‐Hyb (P27)‐injected CD1B6F1‐Otof −/− animals. AAV2/6.eGFP (+AAV.eGFP; P28) and dual‐AAV‐TS (P27)‐injected CD1B6F1 wild‐type, and non‐injected control Otof −/− littermate (‐AAV; P26) mice served as controls. SP: summating potential; ABR waves are indicated from I‐V.
- B
Average ABRs evoked by 80 dB SPL click sound stimuli for 20 clicks/s.
- C, D
ABR click sound (C) and tone burst (D) thresholds in otoferlin dual‐AAV‐treated Otof −/− mice compared to wild‐type and non‐treated Otof −/− control animals. In (D), the two best animals are depicted with open circles. Animals with thresholds exceeding the maximum loudspeaker output (arrows) of 100 dB SPL for clicks and 90 dB SPL for tone bursts were set to 110 dB SPL and 100 dB SPL, respectively. Apical and basal cochlear turns are indicated as Apex and Base, respectively.
- E
Summed ABR wave I‐V amplitudes at different click sound intensities in otoferlin dual‐AAV‐injected, non‐injected Otof −/−, and wild‐type control mice.
- F
Summed ABR wave I‐V amplitudes of individual dual‐AAV‐TS‐treated CD1B6F1‐Otof −/− animals (n = 8 animals; from Fig 3E) plotted against their full‐length otoferlin IHC transduction rates (from Fig 1D, C‐term otoferlin). r: correlation coefficient.
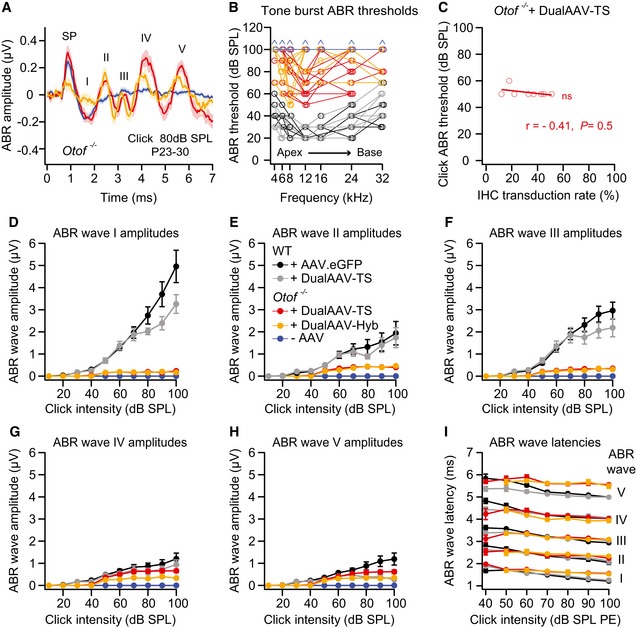
- A
Average ABR waves evoked by 80 dB SPL click sound stimuli in otoferlin dual‐AAV‐injected compared to non‐injected deaf CD1B6F1 Otof −/− mice. SP: summating potential.
- B
Tone burst ABR thresholds of individual otoferlin dual‐AAV‐treated Otof −/− mice compared to non‐treated Otof −/− and wild‐type control animals. Animals with thresholds exceeding the maximum loudspeaker output of 90 dB SPL were set to 100 dB SPL (arrows). Apical and basal cochlear turns are indicated as Apex and Base, respectively.
- C
ABR click sound thresholds of individual dual‐AAV‐TS injected CD1B6F1‐Otof −/− animals (n = 8 mice; from Fig 3C) plotted against their full‐length otoferlin IHC transduction rates (from Fig 1D, C‐term otoferlin). r: correlation coefficient.
- D–H
ABR wave I (D), wave II (E), wave III (F), wave IV (G), and wave V (H) amplitudes, calculated as the difference between the local maximum and the subsequent local minimum, at different click sound intensities in otoferlin dual‐AAV‐injected and non‐injected CD1B6F1‐Otof −/− mice compared to AAV2/6.eGFP and dual‐AAV‐TS injected control CD1B6F1 wild‐type (WT) animals. SPL: sound pressure level.
- I
ABR wave I‐V latencies at different click sound intensities in otoferlin dual‐AAV‐injected Otof −/− and injected CD1B6F1 wild‐type control mice. PE: peak equivalent.
Comment in
-
Split otoferlins reunited.EMBO Mol Med. 2019 Jan;11(1):e9995. doi: 10.15252/emmm.201809995. EMBO Mol Med. 2019. PMID: 30573543 Free PMC article.
References
-
- Bourien J, Tang Y, Batrel C, Huet A, Lenoir M, Ladrech S, Desmadryl G, Nouvian R, Puel J‐L, Wang J (2014) Contribution of auditory nerve fibers to compound action potential of the auditory nerve. J Neurophysiol 112: 1025–1039 - PubMed
Publication types
MeSH terms
Substances
LinkOut - more resources
Full Text Sources
Other Literature Sources
Medical
Miscellaneous
