. 2019 Jan 29;63(2):e02019-18.
doi: 10.1128/AAC.02019-18. Print 2019 Feb.

Genetic and Transcriptomic Analyses of Ciprofloxacin-Tolerant Staphylococcus aureus Isolated by the Replica Plating Tolerance Isolation System (REPTIS)

Affiliations

Genetic and Transcriptomic Analyses of Ciprofloxacin-Tolerant Staphylococcus aureus Isolated by the Replica Plating Tolerance Isolation System (REPTIS)

Miki Matsuo et al. Antimicrob Agents Chemother. .

Abstract

We developed a simple, efficient, and cost-effective method, named the replica plating tolerance isolation system (REPTIS), to detect the antibiotic tolerance potential of a bacterial strain. This method can also be used to quantify the antibiotic-tolerant subpopulation in a susceptible population. Using REPTIS, we isolated ciprofloxacin (CPFX)-tolerant mutants (mutants R2, R3, R5, and R6) carrying a total of 12 mutations in 12 different genes from methicillin-sensitive Staphylococcus aureus (MSSA) strain FDA209P. Each mutant carried multiple mutations, while few strains shared the same mutation. The R2 strain carried a nonsense mutation in the stress-mediating gene, relA Additionally, two strains carried the same point mutation in the leuS gene, encoding leucyl-tRNA synthetase. Furthermore, RNA sequencing of the R strains showed a common upregulation of relA Overall, transcriptome analysis showed downregulation of genes related to translation; carbohydrate, fat, and energy metabolism; nucleotide synthesis; and upregulation of amino acid biosynthesis and transportation genes in R2, R3, and R6, similar to the findings observed for the FDA209P strain treated with mupirocin (MUP0.03). However, R5 showed a unique transcription pattern that differed from that of MUP0.03. REPTIS is a unique and convenient method for quantifying the level of tolerance of a clinical isolate. Genomic and transcriptomic analyses of R strains demonstrated that CPFX tolerance in these S. aureus mutants occurs via at least two distinct mechanisms, one of which is similar to that which occurs with mupirocin treatment.

Keywords: Staphylococcus aureus; ciprofloxacin tolerance; leuS; relA; tolerant mutant; transcriptome.


Figures

FIG 1
FIG 1
Determining S. aureus tolerance to CPFX using the replica plating tolerance isolation system (REPTIS). The number of surviving cells following CPFX (1 mg/liter) treatment is greater for the R3 mutant than for the parent FDA209P strain. FDA209P (108 CFU) was exposed to CPFX at 1 mg/liter on an agar plate, while different initial inocula (108, 107, 106, and 105 CFU) of R3 were exposed to CPFX. Red arrows, tolerant colonies; yellow arrows, resistant colonies.
FIG 2
FIG 2
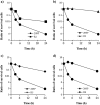
Time-kill assay of the strains surviving exposure to CPFX compared to the parent FDA209P strain. The killing kinetics of the R2 (a), R3 (b), R5 (c), and R6 (d) strains compared to those of the parent FDA209P strain in the presence of CPFX (1 mg/liter) are shown. Data are presented as the mean ± SD from three independent experiments.
FIG 3
FIG 3
Global gene expression analysis of CPFX-tolerant mutants compared to FDA209P treated or not treated with mupirocin. (a) Principal-component analysis (PCA) of whole-genome expression. The gene expression pattern of three of the four CPFX-tolerant strains (R2, R3, and R6) was similar to that of mupirocin-treated FDA209P (MUP0.03), while the transcriptome of R5 was unique. (b) Comparison of whole-genome regulation among the CPFX-tolerant mutants (R) versus MUP0.03 and parent strain FDA209P. The expression patterns are classified into four types: R ≈ MUP0.03 ≈ parent1 (conserved), R ≈ MUP0.03 (stringent pattern), R ≈ parent1 (unchanged), or unique.
FIG 4
FIG 4
MA plots showing the relationship between mean expression and the fold change in expression for all genes. Dots represent individual genes. Black dots, non-differentially expressed genes; pink dots, differentially expressed genes (FDR threshold, <0.05).
FIG 5
FIG 5
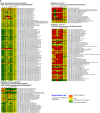
Heat map of the expression rate of the CPFX-tolerant R and MUP0.03 strains compared to that of the reference strain FDA209P (parent1). The expression rate of all strains compared to that of the parent1 strain is presented using a red-yellow-green gradient, with green indicating the bottom score (>3-fold downregulation) and red indicating the top score (>3-fold upregulation). These data represent the fold change in FPKM values compared to the corresponding gene expression in reference strain FDA209P (parent1). The categorization of differentially expressed genes is based on the KEGG pathway. (a) Genetic information processing/translation/aminoacyl-tRNA biosynthesis (PATH:ko00970), metabolism/energy metabolism/nitrogen metabolism (PATH:ko00910), metabolism/energy metabolism/oxidative phosphorylation (PATH:ko00190), metabolism/overview/2-oxocarboxylic acid metabolism (PATH:ko01210), and metabolism/overview/biosynthesis of amino acids (PATH:ko01230). (b) Environmental information processing/signal transduction/two-component system (PATH:ko02020) and environmental information processing/membrane transport/ABC transporters (PATH:ko02010), human diseases/infectious diseases/Salmonella infection (PATH:ko05132), human diseases/infectious diseases/epithelial cell signaling in Helicobacter pylori infection (PATH:ko05120), and human diseases/infectious diseases/bacterial invasion of epithelial cells (PATH:ko05100). A PATH number represents an entry code in the KEGG pathway database. The genes in this heat map correspond to the genes listed in Table S1 in the supplemental material. MUP, mupirocin; VCM, vancomycin.
FIG 5
FIG 5
Heat map of the expression rate of the CPFX-tolerant R and MUP0.03 strains compared to that of the reference strain FDA209P (parent1). The expression rate of all strains compared to that of the parent1 strain is presented using a red-yellow-green gradient, with green indicating the bottom score (>3-fold downregulation) and red indicating the top score (>3-fold upregulation). These data represent the fold change in FPKM values compared to the corresponding gene expression in reference strain FDA209P (parent1). The categorization of differentially expressed genes is based on the KEGG pathway. (a) Genetic information processing/translation/aminoacyl-tRNA biosynthesis (PATH:ko00970), metabolism/energy metabolism/nitrogen metabolism (PATH:ko00910), metabolism/energy metabolism/oxidative phosphorylation (PATH:ko00190), metabolism/overview/2-oxocarboxylic acid metabolism (PATH:ko01210), and metabolism/overview/biosynthesis of amino acids (PATH:ko01230). (b) Environmental information processing/signal transduction/two-component system (PATH:ko02020) and environmental information processing/membrane transport/ABC transporters (PATH:ko02010), human diseases/infectious diseases/Salmonella infection (PATH:ko05132), human diseases/infectious diseases/epithelial cell signaling in Helicobacter pylori infection (PATH:ko05120), and human diseases/infectious diseases/bacterial invasion of epithelial cells (PATH:ko05100). A PATH number represents an entry code in the KEGG pathway database. The genes in this heat map correspond to the genes listed in Table S1 in the supplemental material. MUP, mupirocin; VCM, vancomycin.
FIG 6
FIG 6
Verification of RNA-seq data by qRT-PCR. The relative expression of selected genes (relA, ileS, leuS, ilvA, and agrA) was determined by qRT-PCR in parent strain FDA209P, MUP0.03, and the CPFX-tolerant R strains. dnaB was used as the reference gene for normalization. Each bar represents the mean relative expression ± standard deviation for biological triplicates, where the mean expression in FDA209P is shown as 100%. Statistical significance was determined using Student's t test (*, P < 0.05; **, P < 0.01).

Similar articles

Cited by

References

    1. Fasugba O, Gardner A, Mitchell BG, Mnatzaganian G. 2015. Ciprofloxacin resistance in community- and hospital-acquired Escherichia coli urinary tract infections: a systematic review and meta-analysis of observational studies. BMC Infect Dis 15:545. doi:10.1186/s12879-015-1282-4. - DOI - PMC - PubMed
    1. Hiramatsu K, Igarashi M, Morimoto Y, Baba T, Umekita M, Akamatsu Y. 2012. Curing bacteria of antibiotic resistance: reverse antibiotics, a novel class of antibiotics in nature. Int J Antimicrob Agents 39:478–485. doi:10.1016/j.ijantimicag.2012.02.007. - DOI - PubMed
    1. Hiramatsu K, Katayama Y, Matsuo M, Sasaki T, Morimoto Y, Sekiguchi A, Baba T. 2014. Multi-drug-resistant Staphylococcus aureus and future chemotherapy. J Infect Chemother 20:593–601. doi:10.1016/j.jiac.2014.08.001. - DOI - PubMed
    1. Blumberg HM, Rimland D, Carroll DJ, Terry P, Wachsmuth IK. 1991. Rapid development of ciprofloxacin resistance in methicillin-susceptible and -resistant Staphylococcus aureus. J Infect Dis 163:1279–1285. doi:10.1093/infdis/163.6.1279. - DOI - PubMed
    1. Sreedharan S, Peterson LR, Fisher LM. 1991. Ciprofloxacin resistance in coagulase-positive and -negative staphylococci: role of mutations at serine 84 in the DNA gyrase A protein of Staphylococcus aureus and Staphylococcus epidermidis. Antimicrob Agents Chemother 35:2151–2154. doi:10.1128/AAC.35.10.2151. - DOI - PMC - PubMed

Publication types

MeSH terms

LinkOut - more resources