. 2019 Feb 4;151(2):174-185.
doi: 10.1085/jgp.201711884. Epub 2018 Dec 3.

Molecular dissection of multiphase inactivation of the bacterial sodium channel NaVAb

Affiliations

Molecular dissection of multiphase inactivation of the bacterial sodium channel NaVAb

Tamer M Gamal El-Din et al. J Gen Physiol. .

Abstract

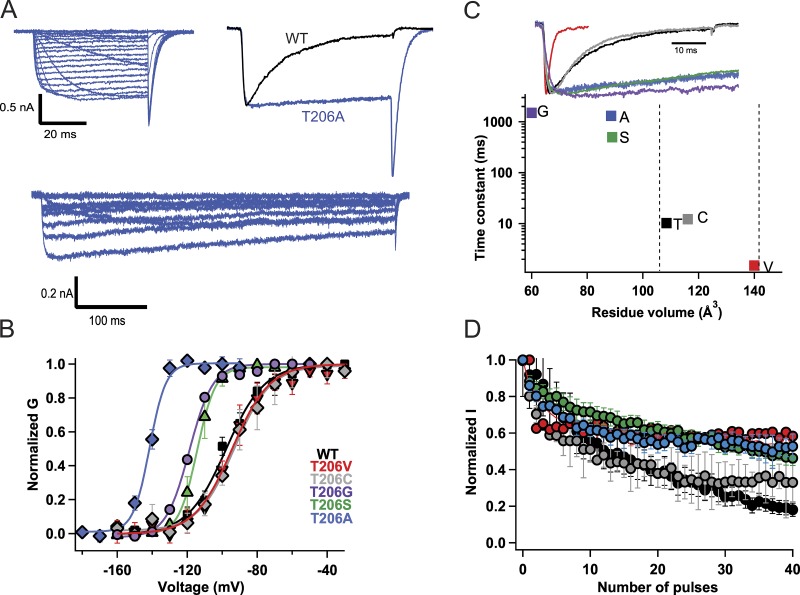
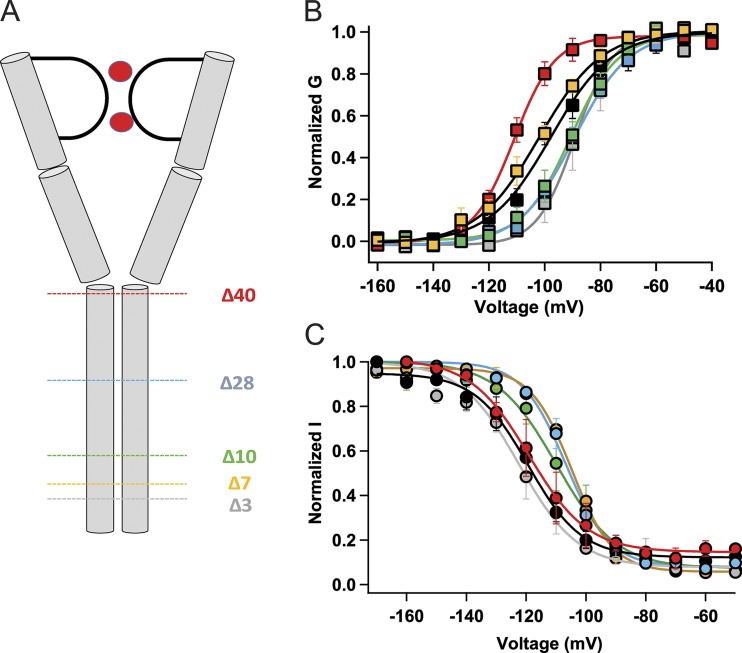
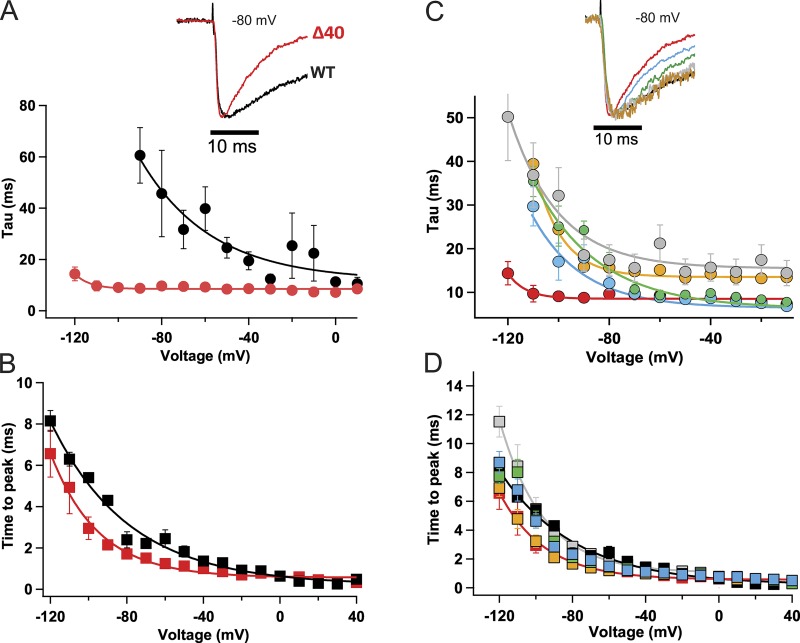
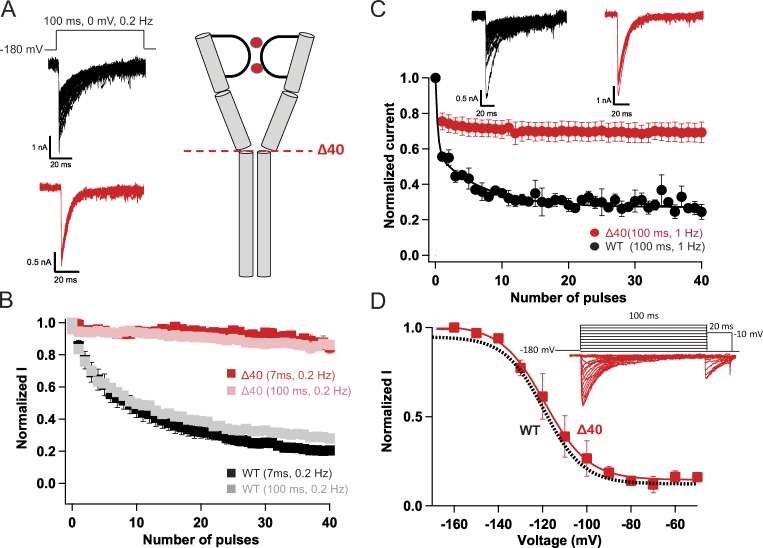
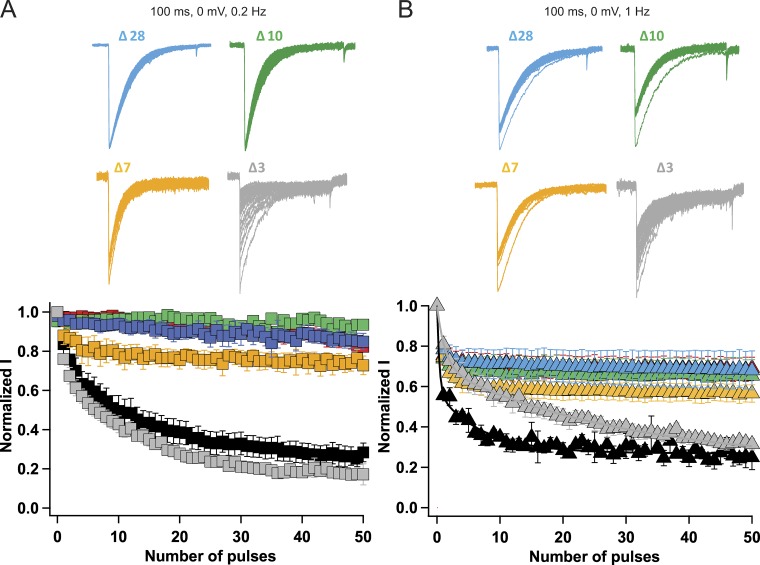
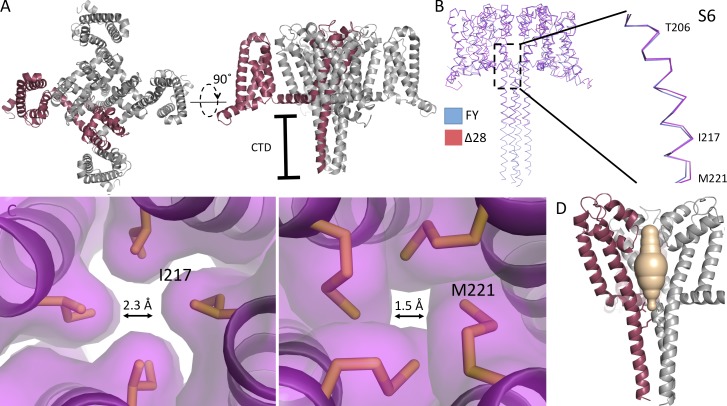
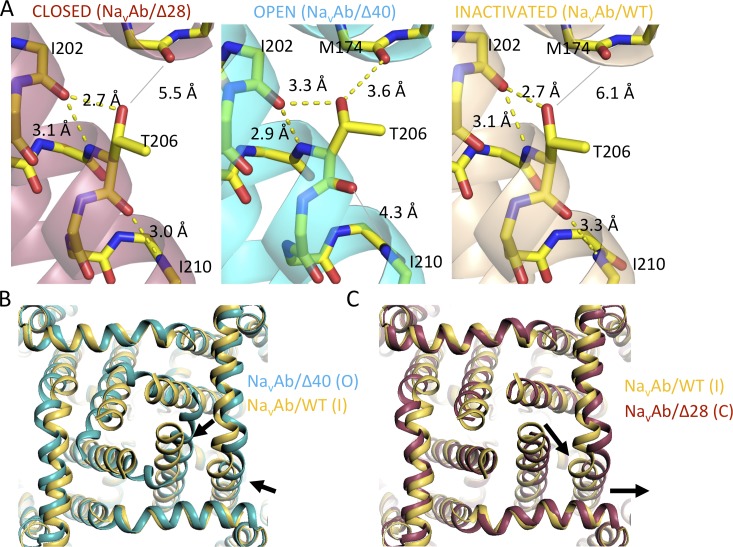
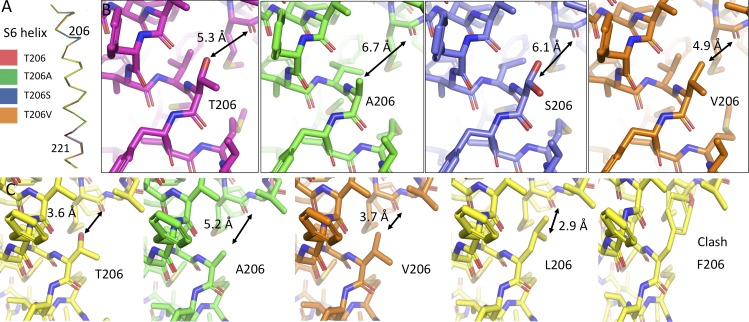
Homotetrameric bacterial voltage-gated sodium channels share major biophysical features with their more complex eukaryotic counterparts, including a slow-inactivation mechanism that reduces ion-conductance activity during prolonged depolarization through conformational changes in the pore. The bacterial sodium channel NaVAb activates at very negative membrane potentials and inactivates through a multiphase slow-inactivation mechanism. Early voltage-dependent inactivation during one depolarization is followed by late use-dependent inactivation during repetitive depolarization. Mutations that change the molecular volume of Thr206 in the pore-lining S6 segment can enhance or strongly block early voltage-dependent inactivation, suggesting that this residue serves as a molecular hub controlling the coupling of activation to inactivation. In contrast, truncation of the C-terminal tail enhances the early phase of inactivation yet completely blocks late use-dependent inactivation. Determination of the structure of a C-terminal tail truncation mutant and molecular modeling of conformational changes at Thr206 and the S6 activation gate led to a two-step model of these gating processes. First, bending of the S6 segment, local protein interactions dependent on the size of Thr206, and exchange of hydrogen-bonding partners at the level of Thr206 trigger pore opening followed by the early phase of voltage-dependent inactivation. Thereafter, conformational changes in the C-terminal tail lead to late use-dependent inactivation. These results have important implications for the sequence of conformational changes that lead to multiphase inactivation of NaVAb and other sodium channels.


Figures

Figure 1.
Figure 1.
Size-dependent effects of mutations of Thr206 on the early phase of inactivation. (A) Top left: Representative current traces of NaVAb/T206A. Cells were held at −180 mV, and 50-ms depolarizing pulses were applied in 10-mV steps from −180 mV to +50 mV. Top right: Comparison of NavAb/T206A inactivation during the pulse (blue) to NaVAb/WT (black). The 100-ms pulse was applied from a holding potential of −180 mV to −70 mV. Bottom: Representative current traces of NaVAb/T206A recorded during 500-ms depolarizing pulses from −180 mV to +50 mV. (B) Voltage dependence of NaVAb/WT and mutants: NaVAb/WT, V1/2 = −97 ± 1.4 mV (black circles; n = 7); NaVAb/T206A, V1/2 = −121 ± 2 mV (blue; n = 5); NaVAb/T206S, V1/2 = −115 ± 1 mV, (green); NaVAb/T206C, V1/2 = −95 ± 4 mV (gray; n = 7); NaVAb/T206V, V1/2 = −95 ± 0.9 mV (red; n = 8). The activation curves were constructed from I–V curves in which 500-ms depolarizing pulses were applied. (C) Top: Representative current traces showing inactivation kinetics of NaVAb Thr206 mutants compared with NaVAb WT. Bottom: Time constants for early voltage-dependent inactivation plotted versus the volume of the amino acid residue at position 206. (D) Peak inward currents measured during each pulse of 1-Hz trains of depolarizations and normalized to the current produced by the first depolarization of the train for NaVAb/WT (black), T206C (gray), T206S (green), T206V (red), T206G (purple), and T206A (blue). Error bars represent SEM.
Figure 2.
Figure 2.
Effects of C-terminal truncation on the voltage dependence of activation and inactivation. (A) A cartoon of NaVAb showing the different truncations of the C-terminal tail domain. (B) G–V curves of NaVAb/WT and C-terminal truncated constructs: NaVAb/WT, V1/2 = −97 ± 1.4 mV (black, n = 7); NaVAbΔ40, V1/2 = −110.7 ± 2.1 mV (red, n = 5); NaVAbΔ28, V1/2 = −90.1 ± 1.5 mV (blue, n = 8); NaVAbΔ10, V1/2 = −90.7 ± 0.8 mV (green, n = 4); NaVAb/Δ7, V1/2 = -104 ± 2 mV (gold, n = 5); and NaVAbΔ3, V1/2 = −89.1 ± 0.8 mv (gray, n = 4) (C) Steady-state inactivation curves of the constructs. NaVAb/WT, V1/2 = −119 ± 1.1 mV (black, n = 5); NaVAbΔ40, V1/2 = −116.1 ± 4.4 mV (red, n = 5); NaVAbΔ28, V1/2 = −106.7 ± 0.6 (blue, n = 3); NaVAbΔ10, V1/2 = −109.7 ± 0.6 mV (green, n = 5); NaVAbΔ7, V1/2 = −104.7 ± 0.4 mV (gold, n = 3); and NaVAbΔ3, V1/2= −121.7 ± 0.4 (gray, n = 5). Error bars represent SEM.
Figure 3.
Figure 3.
Truncation of the C-terminal tail accelerates the early phase of inactivation. (A) Cells were held at −180 mV, and 50-ms depolarizing pulses were applied in 10-mV steps from −180 mV to +50 mV. Top: Comparison of NaVAbΔ40 inactivation during the pulse (red) to NaVAb/WT (black) during a depolarizing pulse from a holding potential of −180 mV to −80 mV. Bottom: Time constant of the decay of current during depolarizations to the indicated potentials for NaVAbΔ40 (red, n = 4) and NaVAb/WT (black, n = 7). The NaVAb/WT inactivation time constants were adapted from previous work (Gamal El-Din et al., 2013) for ease of comparison. (B) Time to peak current for NaVAbΔ40 (red) and NaVAb/WT (black; n = 5–7). (C) Top: Representative normalized current traces during a depolarizing pulse from a holding potential of −180 mV to −80 mV. Time constant of inactivation for NaVAbΔ40 (red), NaVAbΔ28 (blue), NaVAbΔ10 (green), NaVAbΔ7 (gold), and NaVAbΔ3 (gray); n = 4–11. The inactivation time constants were estimated using the equation yo + A(exp(−t/τ). (D) Time to peak current of the C-terminal truncated constructs, color coded as in C (n = 6–7). Error bars represent SEM.
Figure 4.
Figure 4.
Truncation of the C-terminal tail abolishes late use-dependent inactivation. (A) Representative current traces showing late use-dependent inactivation of NaVAb WT (black) and loss of late use-dependent inactivation in NaVAbΔ40 (red). (B) Peak inward currents recorded during each pulse in trains of depolarizations at 0.2 Hz and normalized to the current produced by the first depolarization of the train for NaVAbΔ40 (7 ms, red, n = 7; 100 ms, pink, n = 5) and NaVAb/WT (7 ms, black, n = 7; 100 ms, gray n = 11). (C) Top: Representative currents recorded during each pulse in trains of depolarizations at 1 Hz. Bottom: Normalized currents during each depolarizing pulse for NaVAbΔ40 (red, n = 3) and NaVAb/WT (black, n = 5). (D) Top: Representative currents for NaVAb40 (red) during 100-ms conditioning pulses followed by 20-ms test pulses. Bottom: Voltage dependence of inactivation for NaVAb40 (red) compared with NaVAb/WT (black), as reported previously (Lenaeus et al., 2017). Error bars represent SEM.
Figure 5.
Figure 5.
Graded effects of C-terminal tail truncations on late use-dependent inactivation. (A) Top: Current traces elicited by applying 100-ms depolarizing pulses from a holding potential of −180 mV to 0 mV at 0.2 Hz for different truncated constructs. Bottom: Peak inward currents measured during each train of pulses and normalized to the current produced by the first depolarization of the train for NaVAb/WT (black, n = 7), NaVAb 40 (red, n = 7), NaVAb 28 (blue, n = 12), NaVAb 10 (green, n = 5), NaVAb 7 (yellow, n = 9), and NaVAb 3 (gray, n = 5). (B) Top: Current traces elicited by 100-ms depolarizations from a holding potential of −180 mV at 1 Hz with different constructs. Bottom: Use-dependent inactivation profile of the different constructs during application of 100-ms repetitive pulses applied at 1 Hz. NaVAb WT (black, n = 7), NaVAbΔ40 (red, n = 11), NaVAbΔ28 (blue, n = 6), NaVAbΔ10 (green, n = 5), NaVAbΔ7 (yellow, n = 6), and NaVAbΔ3 (gray, n = 5). Error bars represent SEM.
Figure 6.
Figure 6.
The structure of NaVAbΔ28. (A) The overall fold of NaVAbΔ28 is shown as cartoon helices, with one of the four monomers highlighted in red. Left: Top view. Right: Side view. (B) Ribbon overlay of NaVAbΔ28 (dark red) and NaVAb/T206F/V213Y (PDB accession no. 5VB8, blue). The inset shows a close-up view of the overlay in the region of the S6 helix and activation gate. (C) Side view of the pore domain of NaVAbΔ28, with one subunit highlighted as in A and one subunit removed for clarity. The solvent-accessible volume derived from the program MOLE is shown in wheat color to illustrate the closed activated gate at the level of Ile217 (left) and Met221 (right), which are shown in stick format. Arrows are shown to demonstrate the diameter of the activation gate at the level of the sidechain of I217 or M221, respectively. (D) The four S6 helices are shown at the level of the activation gate residues: Ile217 (left) and Met221 (right). The contours illustrate these amino acid residues in space-filling format. From the contours, we estimate that the orifice of the activation gate has a diameter of 2.3 Å at Ile217 and 1.5 Å at Met221. CTD, C-terminal domain; FY, NaVAb/FY; Δ28, NaVAb/Δ28.
Figure 7.
Figure 7.
Conformational changes accompanying gating of NaVAb. (A) Close-up views of the S6 helix near Thr206 during the closed, open, and inactivated states of NaVAbΔ28, NaVAb/1–226 (cyan, open; equivalent to NaVAbΔ40) and NaVAb/WT (yellow, inactivated). The main chain of each model is shown in stick format, as is the side chain of Thr206. All other side chains have been removed for clarity. Possible hydrogen bonds are shown as black dashes, and a broken hydrogen bond between the carbonyl of Thr206 and amide of Ile210 is shown in gray in the middle panel. (B) An overlay of NaVAb/1–226 (cyan, open; equivalent to NaVAb 40) and NaVAb/WT (yellow, inactivated) with the view as if one is standing below the membrane and looking upward along the permeation pathway. Voltage sensors have been removed for clarity, and arrows show the conformational changes associated with the transition from the open to the inactivated state. (C) An overlay (as in B) showing a comparison between NaVAb/WT (yellow, inactivated) and NaVAbΔ28 (magenta, closed). As in B, arrows highlight the conformational changes associated with the transition between states.
Figure 8.
Figure 8.
The structures of Thr206 mutants. (A) Side view of the isolated S6 helices of NaVAbΔ28 (dark red), NaVAbΔ28/T206A (green), NaVAbΔ28/T206S (blue), and NaVAbΔ28/T206V (orange). (B) Stick models are shown for each of the mutations in A, with focus on the 206 position of the S6 helix and the nearby portion of the pore helix. Coloring is as in A. Distances between the centers of the atoms of the side chain at position 206 and the main-chain carbonyl of Met174 are displayed in black in order to illustrate the differences among these mutations. Two rotamers are shown for T206S (blue), as determined in the crystal structure. (C) Hypothetical positions of Thr206 mutations in the open state (PDB accession no. 5VB2), with (from left to right) Thr206 (WT), T206A, T206V, T206L, and T206F. In each case, the model was created by substituting the Thr206 position with the amino acid shown, without energy minimization or any other rotamer selection. Rotamers selected are the most commonly encountered in the PDB and are meant to be illustrative of space constraints.

References

    1. Adams P.D., Afonine P.V., Bunkóczi G., Chen V.B., Davis I.W., Echols N., Headd J.J., Hung L.W., Kapral G.J., Grosse-Kunstleve R.W., et al. . 2010. PHENIX: a comprehensive Python-based system for macromolecular structure solution. Acta Crystallogr. D Biol. Crystallogr. 66:213–221. 10.1107/S0907444909052925 - DOI - PMC - PubMed
    1. Arrigoni C., Rohaim A., Shaya D., Findeisen F., Stein R.A., Nurva S.R., Mishra S., Mchaourab H.S., and Minor D.L. Jr. 2016. Unfolding of a temperature-sensitive domain controls voltage-gated channel activation. Cell. 164:922–936. 10.1016/j.cell.2016.02.001 - DOI - PMC - PubMed
    1. Bagnéris C., Decaen P.G., Hall B.A., Naylor C.E., Clapham D.E., Kay C.W., and Wallace B.A.. 2013. Role of the C-terminal domain in the structure and function of tetrameric sodium channels. Nat. Commun. 4:2465 10.1038/ncomms3465 - DOI - PMC - PubMed
    1. Cantrell A.R., and Catterall W.A.. 2001. Neuromodulation of Na+ channels: an unexpected form of cellular plasticity. Nat. Rev. Neurosci. 2:397–407. 10.1038/35077553 - DOI - PubMed
    1. Carr D.B., Day M., Cantrell A.R., Held J., Scheuer T., Catterall W.A., and Surmeier D.J.. 2003. Transmitter modulation of slow, activity-dependent alterations in sodium channel availability endows neurons with a novel form of cellular plasticity. Neuron. 39:793–806. 10.1016/S0896-6273(03)00531-2 - DOI - PubMed

Publication types

LinkOut - more resources