

Perivascular Adventitial Fibroblast Specialization Accompanies T Cell Retention in the Inflamed Human Dermis
- PMID: 30510068
- PMCID: PMC6305793
- DOI: 10.4049/jimmunol.1801209
Perivascular Adventitial Fibroblast Specialization Accompanies T Cell Retention in the Inflamed Human Dermis
Abstract
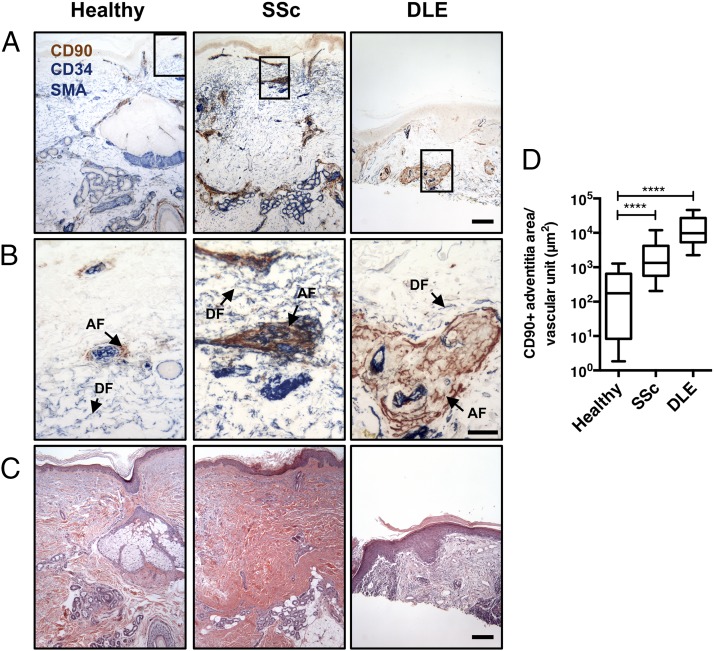
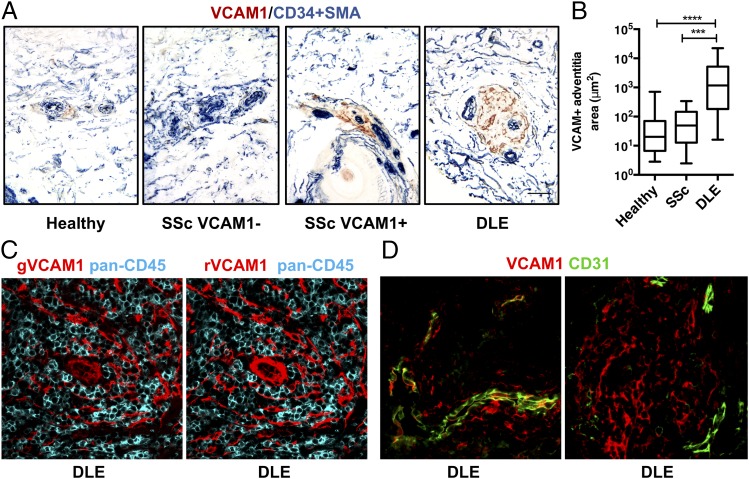
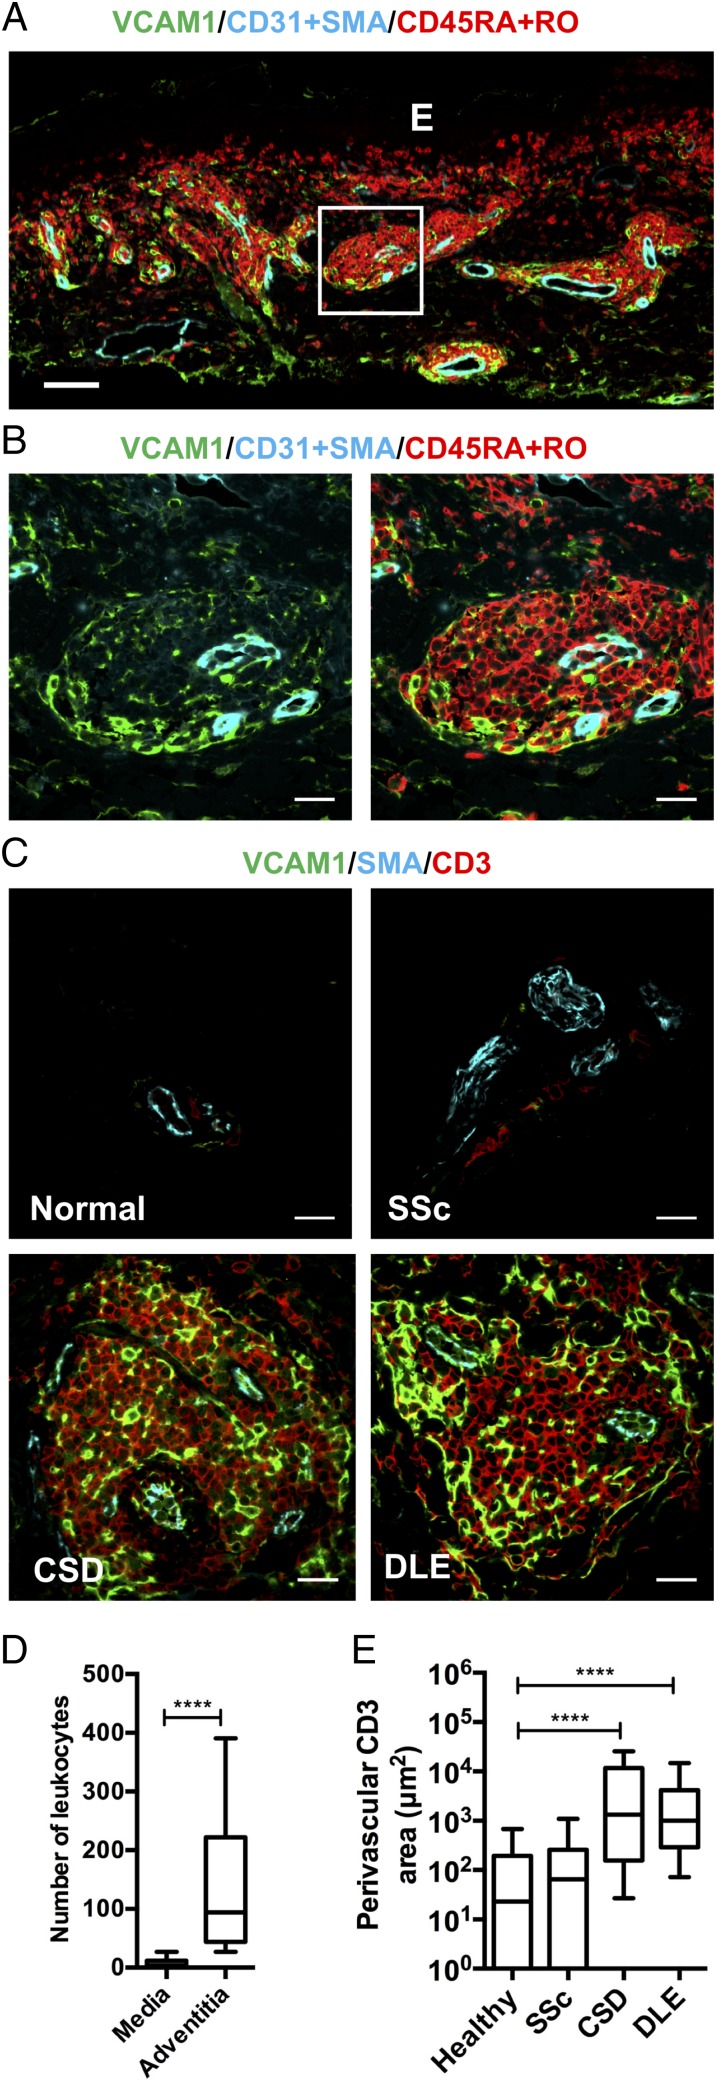
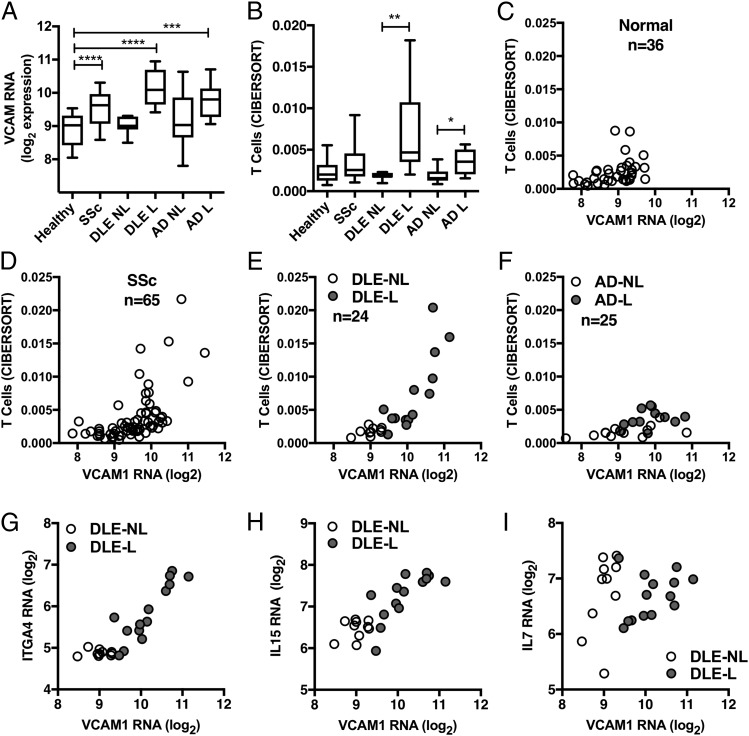
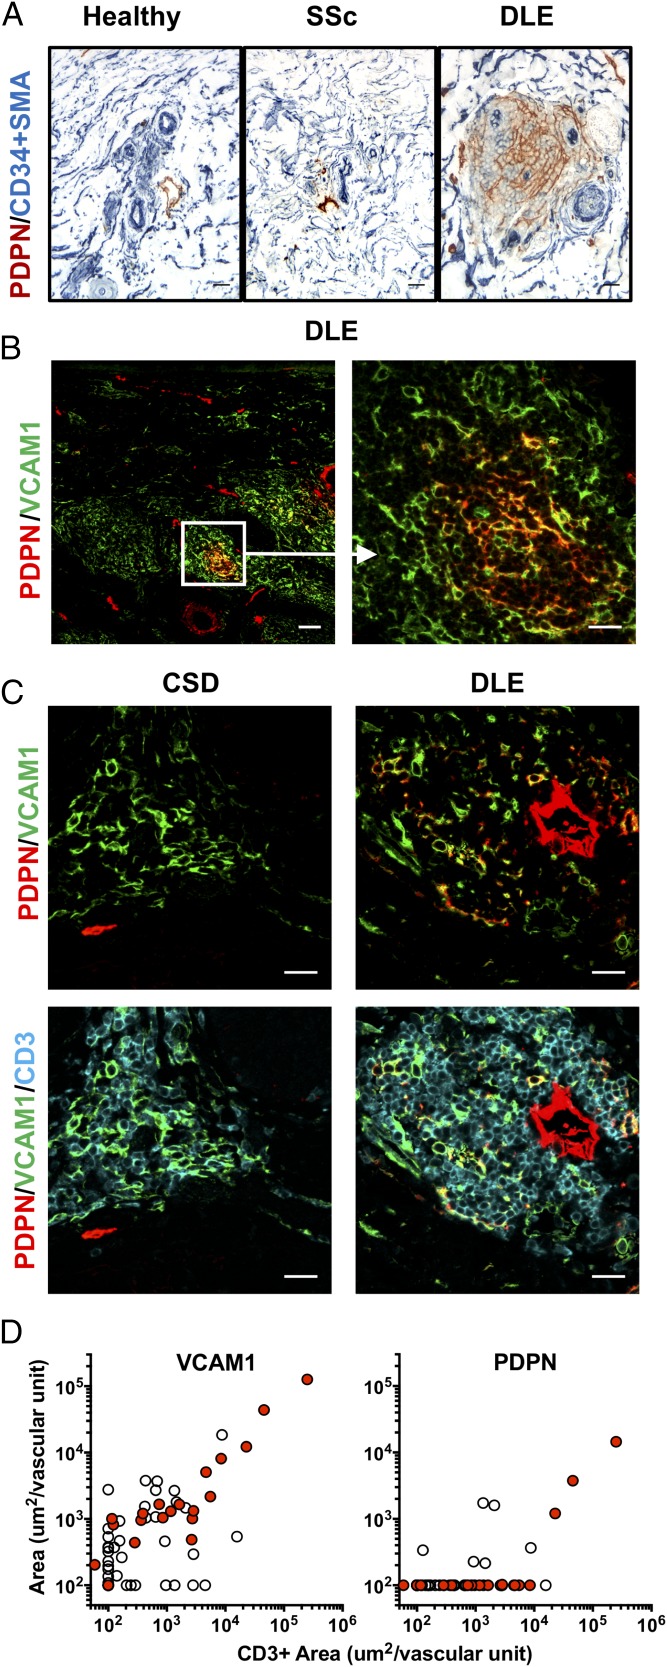
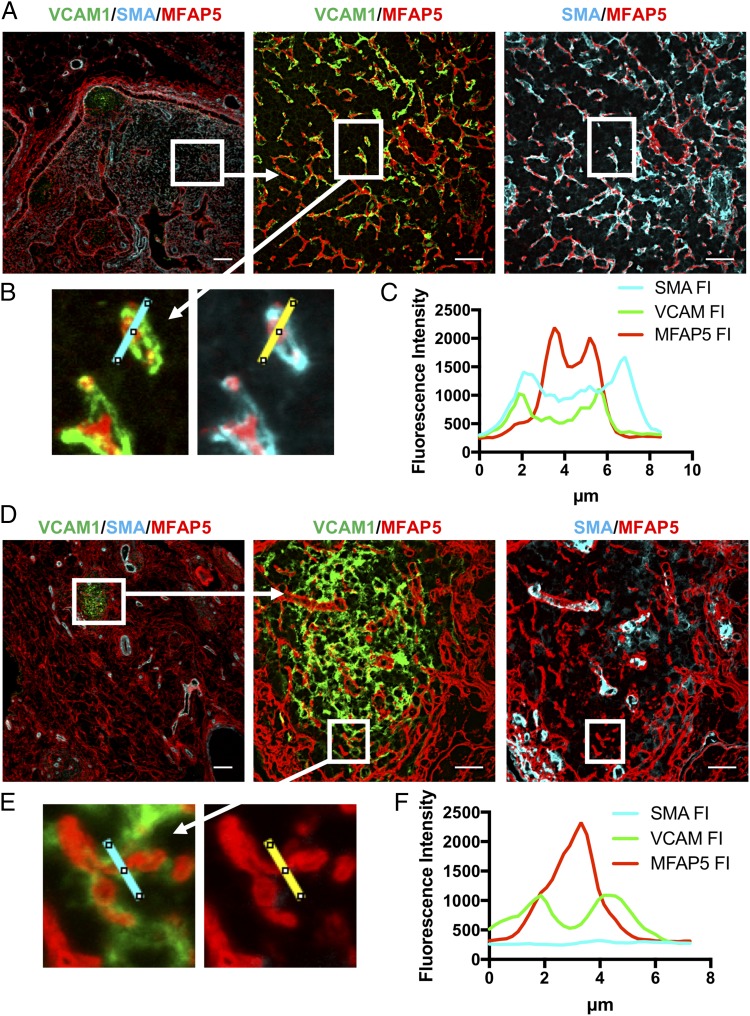
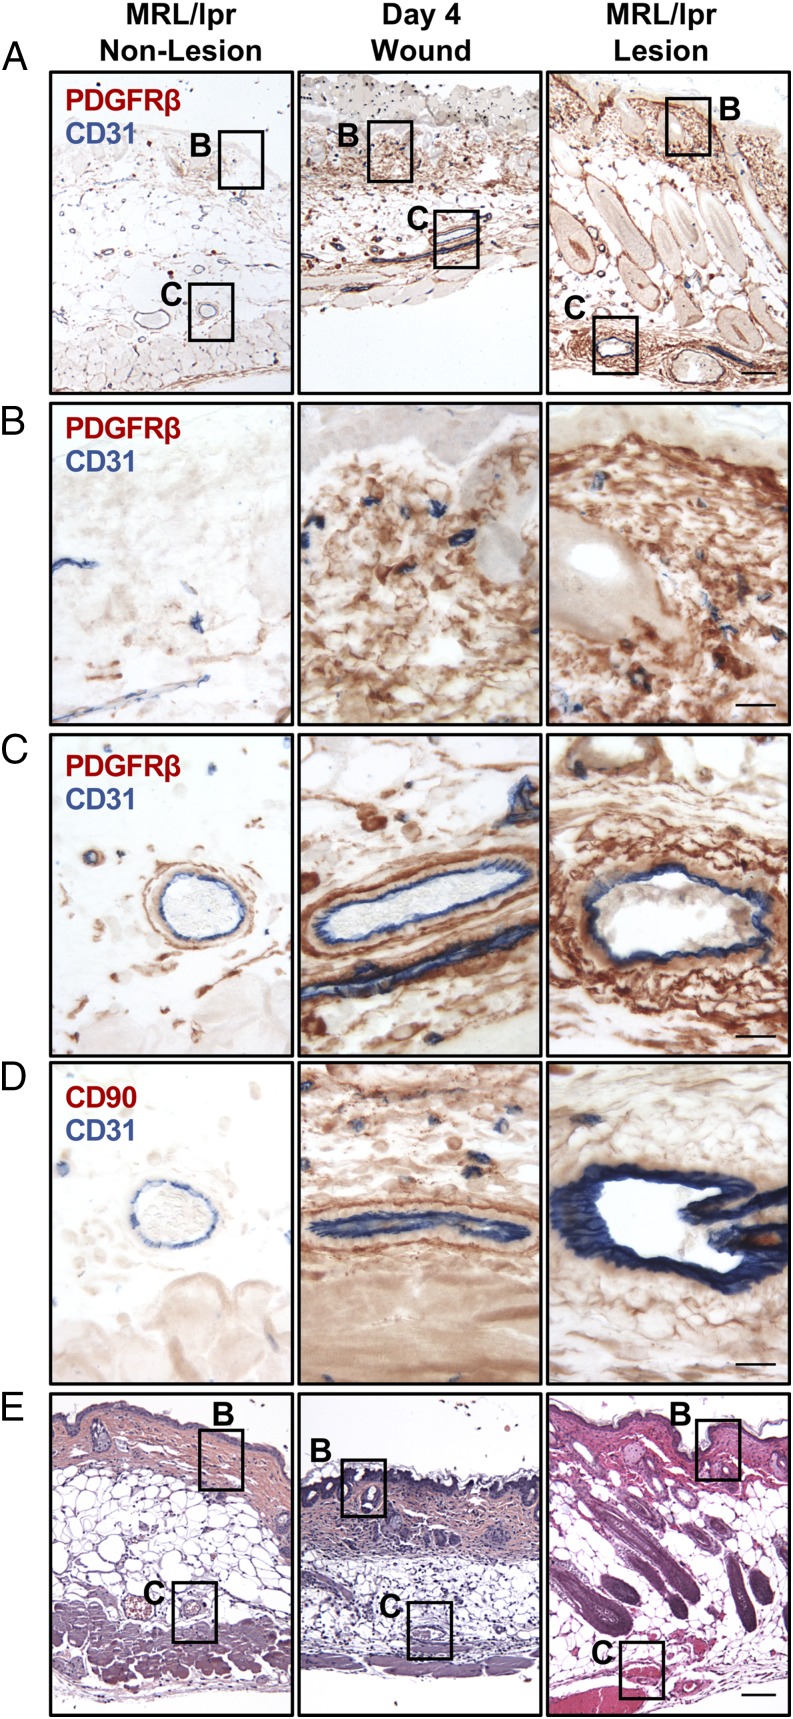
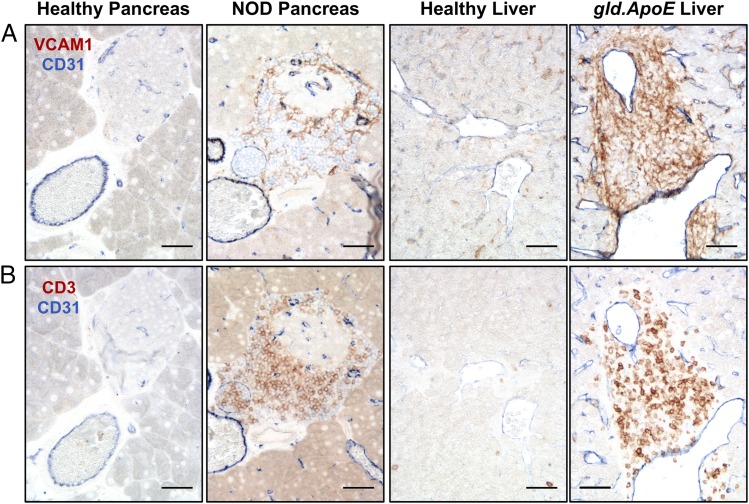
Perivascular accumulation of lymphocytes can be a prominent histopathologic feature of various human inflammatory skin diseases. Select examples include systemic sclerosis, spongiotic dermatitis, and cutaneous lupus. Although a large body of work has described various aspects of the endothelial and vascular smooth muscle layers in these diseases, the outer adventitial compartment is poorly explored. The goal of the current study was to characterize perivascular adventitial fibroblast states in inflammatory human skin diseases and relate these states to perivascular lymphocyte accumulation. In normal skin, adventitial fibroblasts are distinguished by CD90 expression, and dense perivascular lymphocytic infiltrates are uncommon. In systemic sclerosis, this compartment expands, but lymphocyte infiltrates remain sparse. In contrast, perivascular adventitial fibroblast expression of VCAM1 is upregulated in spongiotic dermatitis and lupus and is associated with a dense perivascular T cell infiltrate. VCAM1 expression marks transitioned fibroblasts that show some resemblance to the reticular stromal cells in secondary lymphoid organs. Expanded adventitial compartments with perivascular infiltrates similar to the human settings were not seen in the inflamed murine dermis. This species difference may hinder the dissection of aspects of perivascular adventitial pathology. The altered perivascular adventitial compartment and its associated reticular network form a niche for lymphocytes and appear to be fundamental in the development of an inflammatory pattern.
Copyright © 2018 by The American Association of Immunologists, Inc.
Figures
Similar articles
-
Altered Dermal Fibroblasts in Systemic Sclerosis Display Podoplanin and CD90.Am J Pathol. 2016 Oct;186(10):2650-64. doi: 10.1016/j.ajpath.2016.06.020. Epub 2016 Aug 23. Am J Pathol. 2016. PMID: 27565038 Free PMC article.
-
Expression of intercellular adhesion molecule-1 (ICAM-1) in the skin of patients with systemic scleroderma.J Invest Dermatol. 1991 Oct;97(4):667-71. doi: 10.1111/1523-1747.ep12483739. J Invest Dermatol. 1991. PMID: 1682392
-
Expression of class II-MHC antigens in the dermis of patients with progressive systemic sclerosis.Immunobiology. 1991 Jun;182(3-4):234-55. doi: 10.1016/S0171-2985(11)80660-1. Immunobiology. 1991. PMID: 1833311
-
T lymphocyte and fibroblast interactions: the case of skin involvement in systemic sclerosis and other examples.Springer Semin Immunopathol. 1999;21(4):431-50. doi: 10.1007/s002810000035. Springer Semin Immunopathol. 1999. PMID: 10945035 Review. No abstract available.
-
Role of cellular immunity in the pathogenesis of autoimmune skin diseases.Clin Exp Rheumatol. 2006 Jan-Feb;24(1 Suppl 40):S14-9. Clin Exp Rheumatol. 2006. PMID: 16466620 Review.
Cited by
-
Fibroblast subtypes in tissues affected by autoimmunity: with lessons from lymph node fibroblasts.Curr Opin Immunol. 2020 Jun;64:63-70. doi: 10.1016/j.coi.2020.03.002. Epub 2020 May 5. Curr Opin Immunol. 2020. PMID: 32387902 Free PMC article. Review.
-
CD105+CD90+CD13+ identifies a clonogenic subset of adventitial lung fibroblasts.Sci Rep. 2021 Dec 24;11(1):24417. doi: 10.1038/s41598-021-03963-9. Sci Rep. 2021. PMID: 34952905 Free PMC article.
-
Lung-resident memory B cells protect against bacterial pneumonia.J Clin Invest. 2021 Jun 1;131(11):e141810. doi: 10.1172/JCI141810. J Clin Invest. 2021. PMID: 34060477 Free PMC article.
-
T cell activation niches-Optimizing T cell effector function in inflamed and infected tissues.Immunol Rev. 2022 Mar;306(1):164-180. doi: 10.1111/imr.13047. Epub 2021 Dec 2. Immunol Rev. 2022. PMID: 34859453 Free PMC article. Review.
-
Interrelation Between Fibroblasts and T Cells in Fibrosing Interstitial Lung Diseases.Front Immunol. 2021 Nov 5;12:747335. doi: 10.3389/fimmu.2021.747335. eCollection 2021. Front Immunol. 2021. PMID: 34804029 Free PMC article. Review.
References
-
- Joshi R. 2013. Interface dermatitis. Indian J. Dermatol. Venereol. Leprol. 79: 349–359. - PubMed
-
- Pitzalis C., Jones G. W., Bombardieri M., Jones S. A. 2014. Ectopic lymphoid-like structures in infection, cancer and autoimmunity. Nat. Rev. Immunol. 14: 447–462. - PubMed
-
- Ley K., Laudanna C., Cybulsky M. I., Nourshargh S. 2007. Getting to the site of inflammation: the leukocyte adhesion cascade updated. Nat. Rev. Immunol. 7: 678–689. - PubMed
Publication types
MeSH terms
Substances
Grants and funding
LinkOut - more resources
Full Text Sources
Medical
Molecular Biology Databases
Miscellaneous
