. 2018 Dec 3;8(1):17559.
doi: 10.1038/s41598-018-35859-6.

Engineered K1F bacteriophages kill intracellular Escherichia coli K1 in human epithelial cells

Affiliations

Engineered K1F bacteriophages kill intracellular Escherichia coli K1 in human epithelial cells

Christian Møller-Olsen et al. Sci Rep. .

Abstract

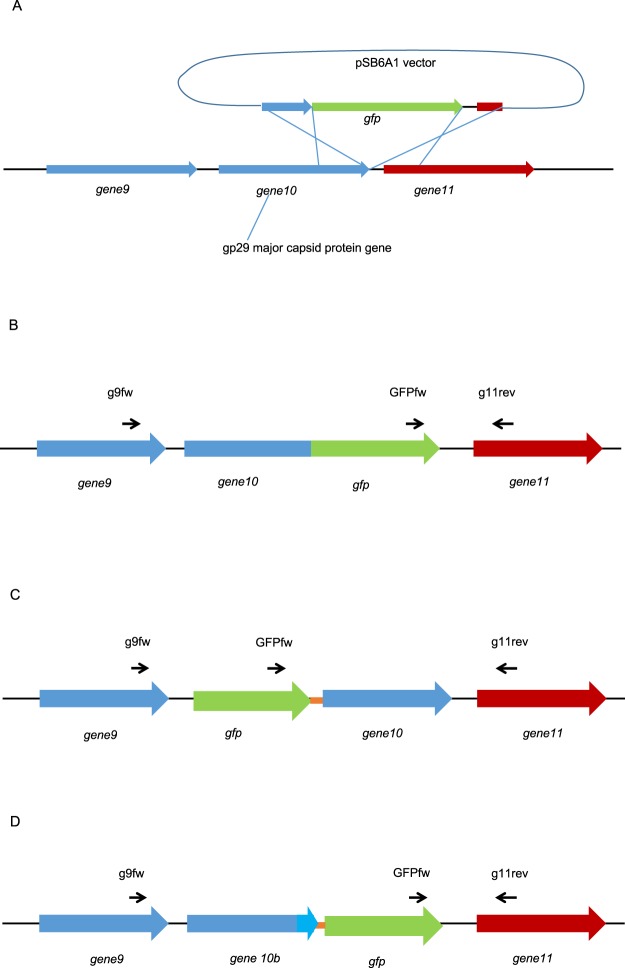
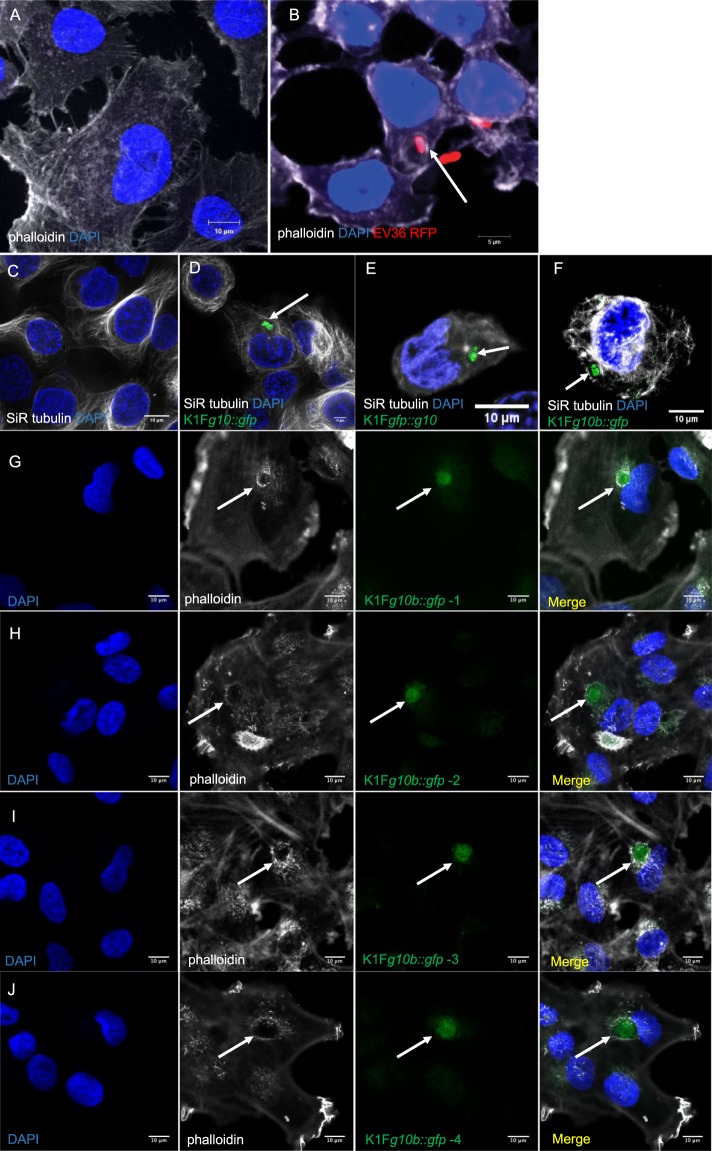
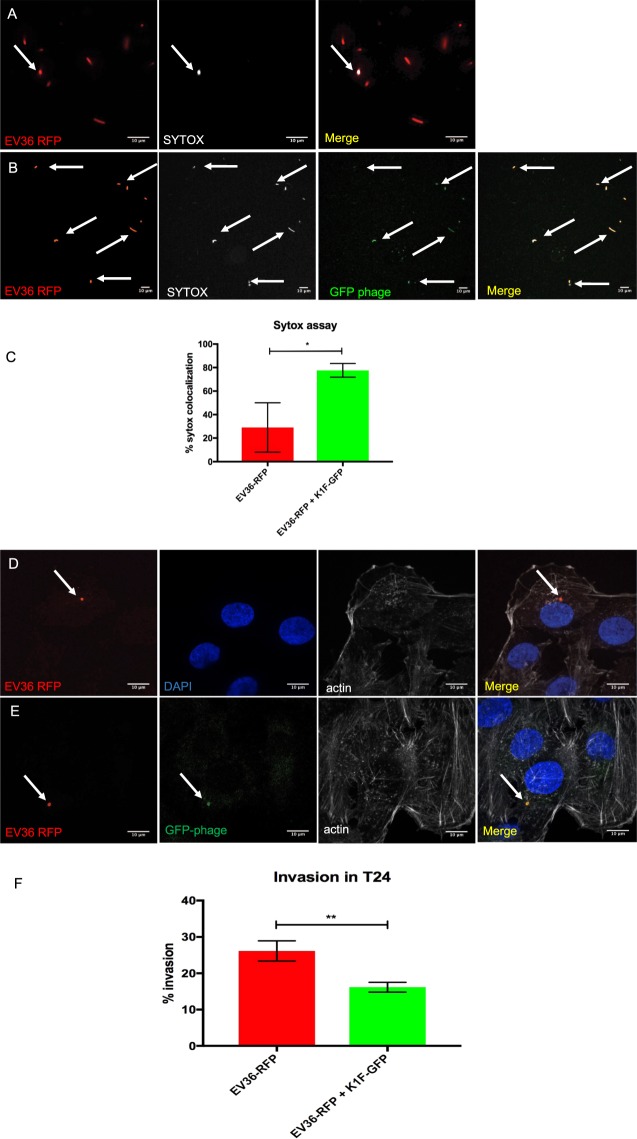
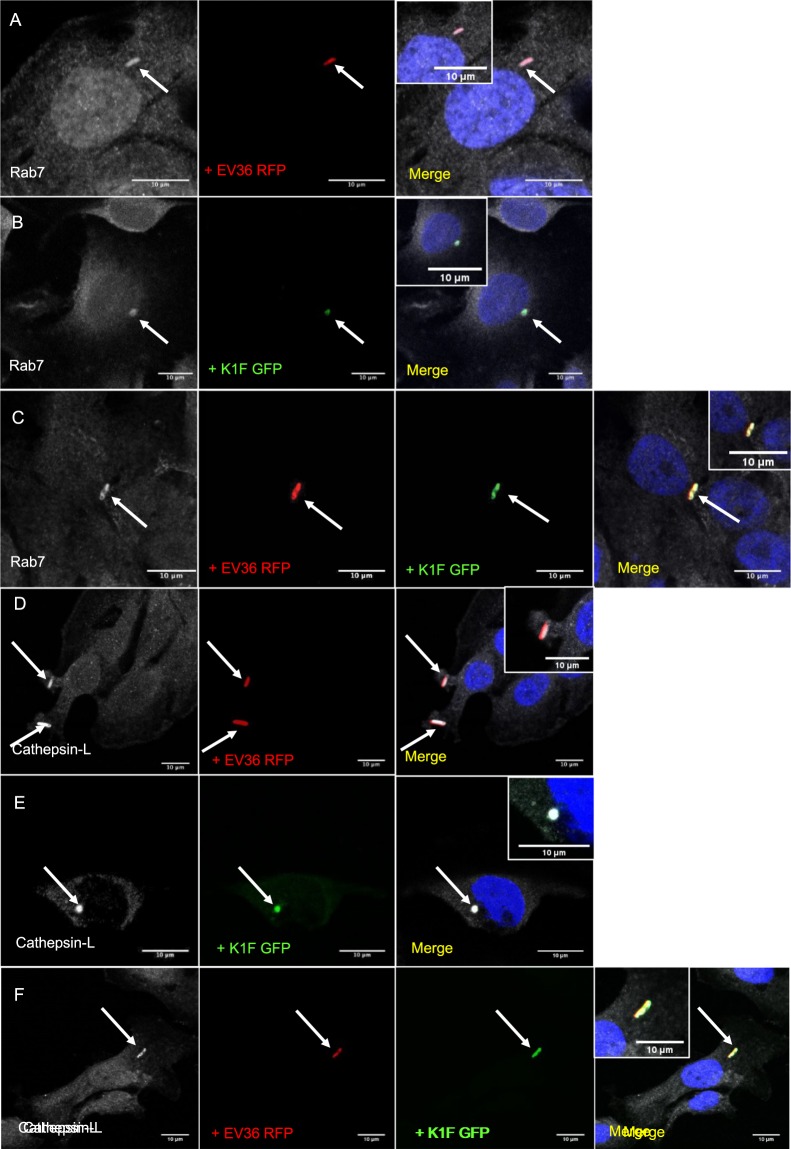
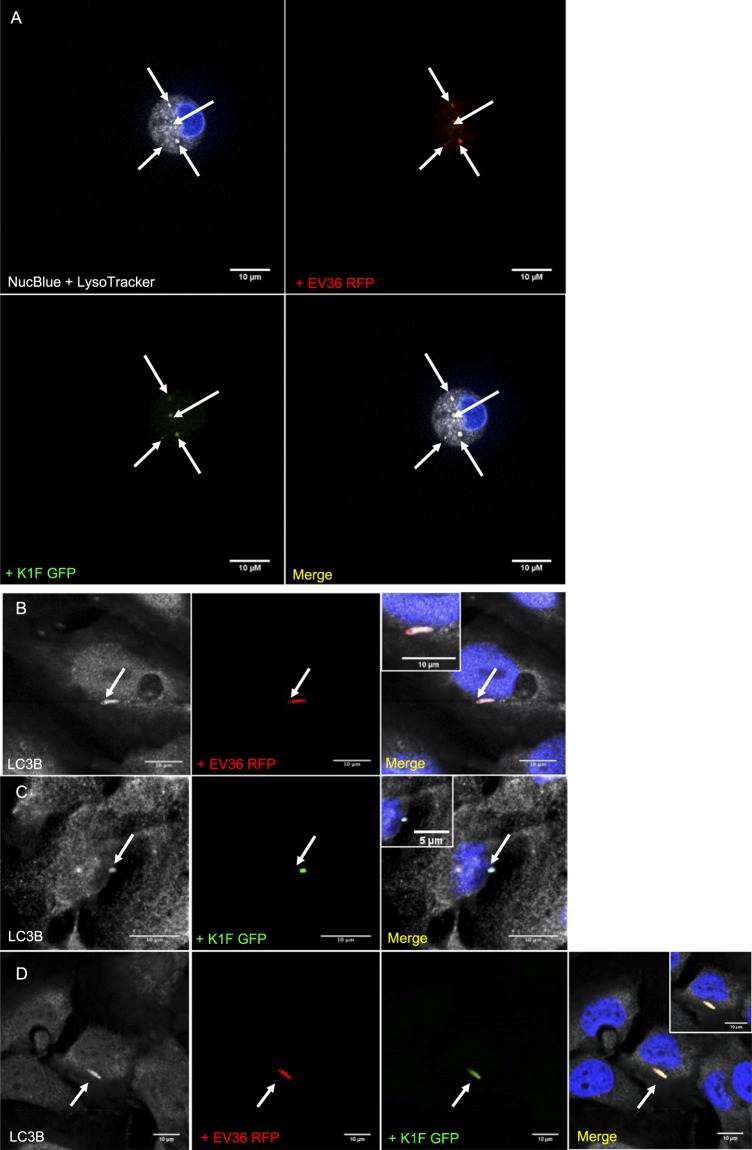
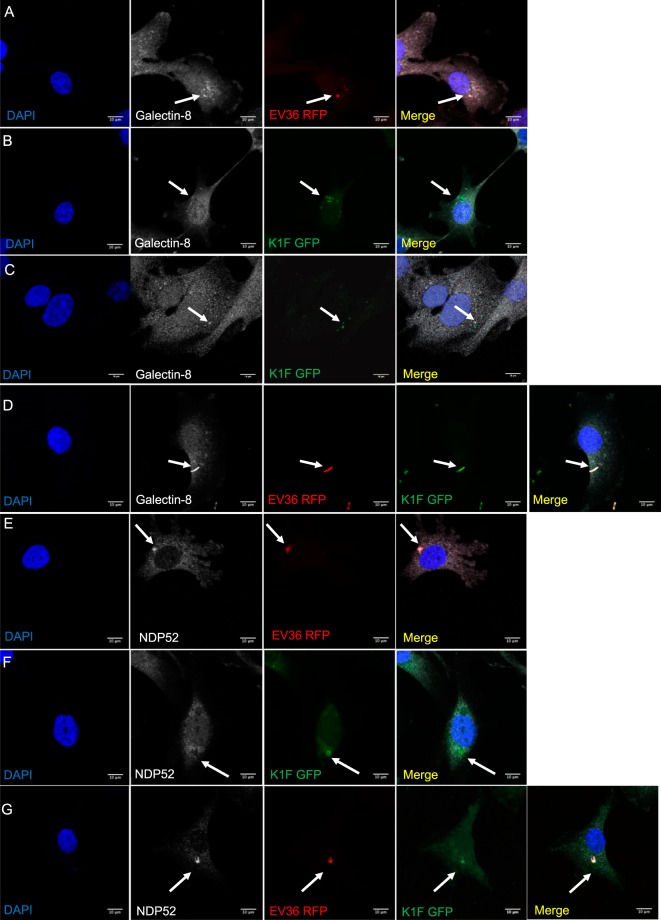
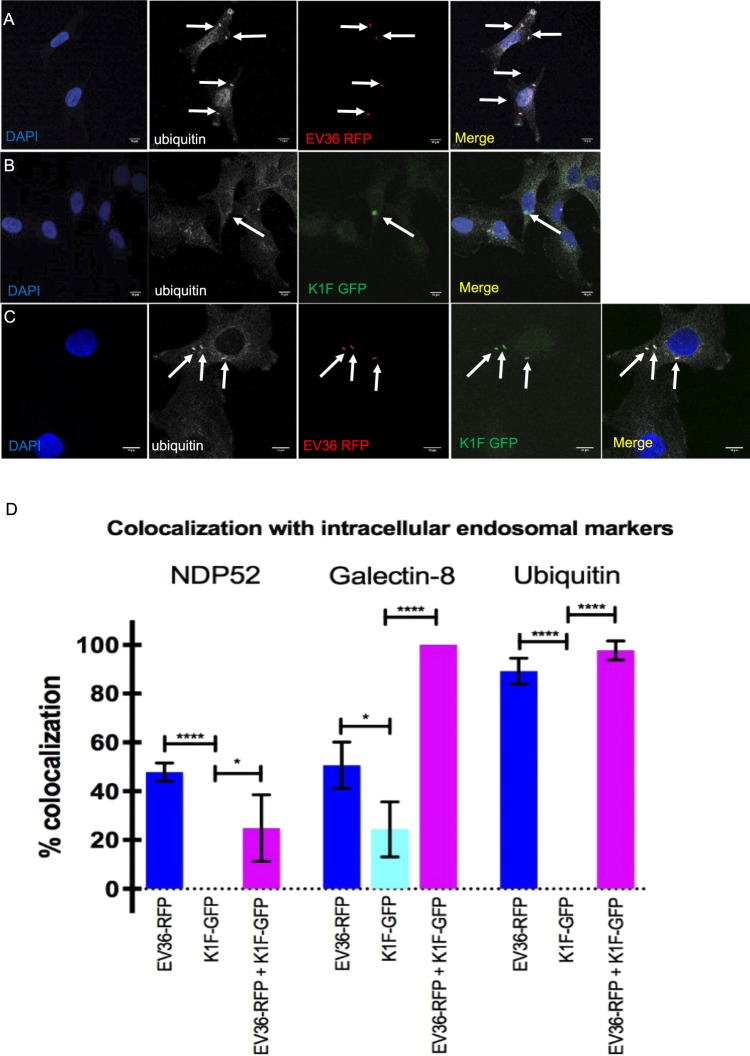
Bacterial infections can be treated with bacteriophages that show great specificity towards their bacterial host and can be genetically modified for different applications. However, whether and how bacteriophages can kill intracellular bacteria in human cells remains elusive. Here, using CRISPR/Cas selection, we have engineered a fluorescent bacteriophage specific for E. coli K1, a nosocomial pathogen responsible for urinary tract infections, neonatal meningitis and sepsis. By confocal and live microscopy, we show that engineered bacteriophages K1F-GFP and E. coli EV36-RFP bacteria displaying the K1 capsule, enter human cells via phagocytosis. Importantly, we show that bacteriophage K1F-GFP efficiently kills intracellular E. coli EV36-RFP in T24 human urinary bladder epithelial cells. Finally, we provide evidence that bacteria and bacteriophages are degraded by LC3-associated phagocytosis and xenophagy.


Conflict of interest statement

The authors declare no competing interests.

Figures

Figure 1
Figure 1
Construction of fluorescent phages K1F. (A) The engineering of three different constructs was attempted using in vivo recombination between a plasmid-borne donor DNA and gene10 of the phage, encoding the major and minor capsid proteins. The double crossover required for recombination is shown for the process generating the C-terminal GFP fusion of the major capsid protein. (B–D) The expected results of the three engineering strategies are displayed: g10::gfp, the C-terminal GFP fusion of the major capsid protein-encoding gene (B), gfp::g10, the N-terminal GFP fusion of the major capsid protein-encoding gene (C) and g10b::gfp, the C-terminal GFP fusion of the minor capsid protein-encoding gene, i.e. gene10b (D). Linker peptide-encoding sequences used for the two latter constructs are depicted by orange lines. Thin arrows represent PCR primers used for screening and validation of recombinant phages.
Figure 2
Figure 2
Image analysis of E. coli EV36-RFP bacteria and phage K1F-GFP constructs inside epithelial human cells. (A,B) Fluorescent images showing human epithelial T24 cells alone (A) and infected with E. coli EV36-RFP (B). DAPI stain is shown in blue. Phalloidin stain is shown in grey. (C–F) Fluorescent images showing human epithelial T24 cells alone (C) and infected with different constructs of fluorescent phages K1F: g10::gfp (D), gfp::g10 (E), g10b::gfp (F). Arrows annotate the location of fluorescent phage K1F accumulation in vacuoles. DAPI stain is shown in blue. SiR-tubulin stain is shown in grey. (G–J) Fluorescent images showing T24 cells infected with the four pure fluorescent g10b::gfp phages K1F upon in vivo CRISPR/Cas selection (Suppl. Fig. S2D). Arrows annotate the location of pure fluorescent g10b::gfp phages K1F accumulation in vacuoles. DAPI stain is shown in blue. Phalloidin is shown in grey.
Figure 3
Figure 3
Phage K1F targets extracellular and intracellular bacteria in epithelial human cells. (A,B) Live confocal microscopy imaging of E. coli EV36-RFP bacteria stained with SYTOX Red Dead Cell stain (here shown in grey). Arrows refer to SYTOX stained cells. (A) Negative control sample containing E. coli EV36-RFP without phage K1F. (B) Sample containing E. coli EV36-RFP infected with fluorescent phage K1Fg10b::gfp. (C) Quantification of SYTOX stained cells from live confocal imaging showing the percentage of E. coli EV36-RFP cells stained with SYTOX prior (29.1%) or upon fluorescent phage K1F addition (77.6%). Comparisons of means were carried out using a Student’s t-test with error bars representing +/− SD. Calculated probability values are p = 0.018 (*), n = 3. (D–F) Confocal imaging and quantification of intracellular E. coli EV36-RFP and fluorescent phage K1F in human epithelial cells. T24 cells have been stained with Phalloidin as a marker for F- actin and DAPI for DNA-rich nucleus. Each panel represents one channel of a single image. Merge’ panel shows all channels merged into one image. Each set of panels come from a single image. (D) T24 cells have been infected with E. coli EV36-RFP and further incubated with gentamycin to ensure the clearance of extracellular bacteria. The arrow indicates intracellular E. coli EV36-RFP bacteria. (E) T24 cells have been infected with E. coli EV36-RFP and fluorescent phage K1Fg10b::gfp has been added. The arrows indicate intracellular E. coli EV36-RFP and intracellular fluorescent phage K1F co-localising. (F) Quantification of invasion experiments, showing that 26.1% (SD = 2.8) of T24 cells were invaded by intracellular bacteria and above half of those bacteria in total (16.2%, SD = 1.4) were targeted by fluorescent phage K1Fg10b::gfp. Error bars indicate Standard Deviation. Comparisons of means were carried out using a Student’s t-test with error bars representing +/− SD. Calculated probability values are p ≤ 0.01 (**), n = 3.
Figure 4
Figure 4
E. coli EV36 and phage K1F enter epithelial human cells via phagocytosis and are directed to lysosomes. (A–C) T24 cells infected with E. coli EV36-RFP (A), fluorescent phage K1F (B) or both (C), were fixed and stained with anti-RAB7 antibody, a marker for phagosomes. DAPI stain is shown in blue and anti-RAB7 antibody in grey. (D–F) T24 cells infected with E. coli EV36 RFP (D), fluorescent phage K1F (E) or both (F), were fixed and stained with anti-Cathepsin-L antibody, a marker for lysosomes. DAPI stain is shown in blue and anti-Cathepsin-L antibody in grey. Arrows represent the RFP-expressing bacteria, GFP-labelled phage and their co-localisation with the corresponding antibody.
Figure 5
Figure 5
Degradation of E. coli EV36 and phage K1F via LC3-assisted phagocytosis. (A) Z-stack of live T24 cells infected with E. coli EV36-RFP bacteria and fluorescent phage K1F, stained with NucBlue Live ReadyProbes Reagent for the nucleus and Lysotracker Deep Red stain, a marker of acidic organelles in live cells. Shown here is a single image taken from a z-stack. (B–D) T24 cells infected with E. coli EV36-RFP (B), fluorescent phage K1F (C) or both (D), were fixed and stained with anti-LC3B antibody, a marker for LC3-assisted phagocytosis. DAPI stain is shown in blue and anti-LC3B antibody in grey. Arrows represent the RFP-expressing bacteria, GFP-labelled phage and their co-localisation with the corresponding stain/antibody.
Figure 6
Figure 6
E. coli EV36 activates Galectin-8 dependent autophagy. (A–C) T24 cells were incubated with E. coli EV36-RFP alone (A), phage K1F-GFP alone (B), or E. coli EV36-RFP and subsequently with phage K1F-GFP (C). The cells were then fixed and stained with anti-Galectin-8/LGALS8 antibody as an autophagy marker. Arrows annotate E. coli EV36-RFP bacteria, fluorescent phage K1F and co-localisation with anti-Galectin-8 antibody. Images are representative of three independently performed experiments. D–G. T24 cells were incubated with E. coli EV36-RFP alone (D), phage K1F-GFP alone (E,F), or E. coli EV36-RFP and subsequently added phage K1F-GFP (G). The cells were then fixed and stained with anti-NDP52/CALCOCO2 antibody as an autophagy marker. Arrows annotate E. coli EV36-RFP bacteria, fluorescent phage K1F and co-localisation with anti-NDP52 antibody. Images are representative of three independently performed experiments.
Figure 7
Figure 7
Phage K1F in the absence of E. coli EV36 cannot activate autophagy. (A–C) T24 cells were incubated with E. coli EV36-RFP alone (A), phage K1F-GFP alone (B), or E. coli EV36-RFP and subsequently added phage K1F-GFP (C). The cells were then fixed and stained with anti-ubiquitin antibody as an autophagy marker. Arrows annotate E. coli EV36-RFP bacteria, fluorescent phage K1F and co-localisation with anti-ubiquitin antibody. Images are representative of three independently performed experiments. (D) Quantification of co-localisation of endosomal markers with E. coli EV36-RFP and phage K1F-GFP alone and in combination. A Student’s t-test corrected for multiple comparisons using the Holm-Sidak method was performed using GraphPad Prism 7. The calculated probability values (p-values) are displayed as p ≤ 0.05 (*), p ≤ 0.01 (**), p ≤ 0.001 (***), p ≤ 0.0001 (****) and not statistical significant p ≥ 0.05 (ns). n ≥ 3.

References

    1. Suttle CA. Viruses in the sea. Nature. 2005;437:356–361. doi: 10.1038/nature04160. - DOI - PubMed
    1. Clokie MR, Millard AD, Letarov AV, Heaphy S. Phages in nature. Bacteriophage. 2011;1:31–45. doi: 10.4161/bact.1.1.14942. - DOI - PMC - PubMed
    1. Wahida A, Ritter K, Horz HP. The Janus-Face of Bacteriophages across Human Body Habitats. PLoS Pathog. 2016;12:e1005634. doi: 10.1371/journal.ppat.1005634. - DOI - PMC - PubMed
    1. Navarro F, Muniesa M. Phages in the Human Body. Front Microbiol. 2017;8:566. doi: 10.3389/fmicb.2017.00566. - DOI - PMC - PubMed
    1. Bakhshinejad B, Ghiasvand S. Bacteriophages in the human gut: Our fellow travelers throughout life and potential biomarkers of heath or disease. Virus Res. 2017;240:47–55. doi: 10.1016/j.virusres.2017.07.013. - DOI - PubMed

Publication types

MeSH terms

LinkOut - more resources