. 2018 Dec;25(12):1119-1127.
doi: 10.1038/s41594-018-0156-z. Epub 2018 Dec 3.

Chaperonin CCT checkpoint function in basal transcription factor TFIID assembly

Affiliations

Chaperonin CCT checkpoint function in basal transcription factor TFIID assembly

Simona V Antonova et al. Nat Struct Mol Biol. 2018 Dec.

Abstract

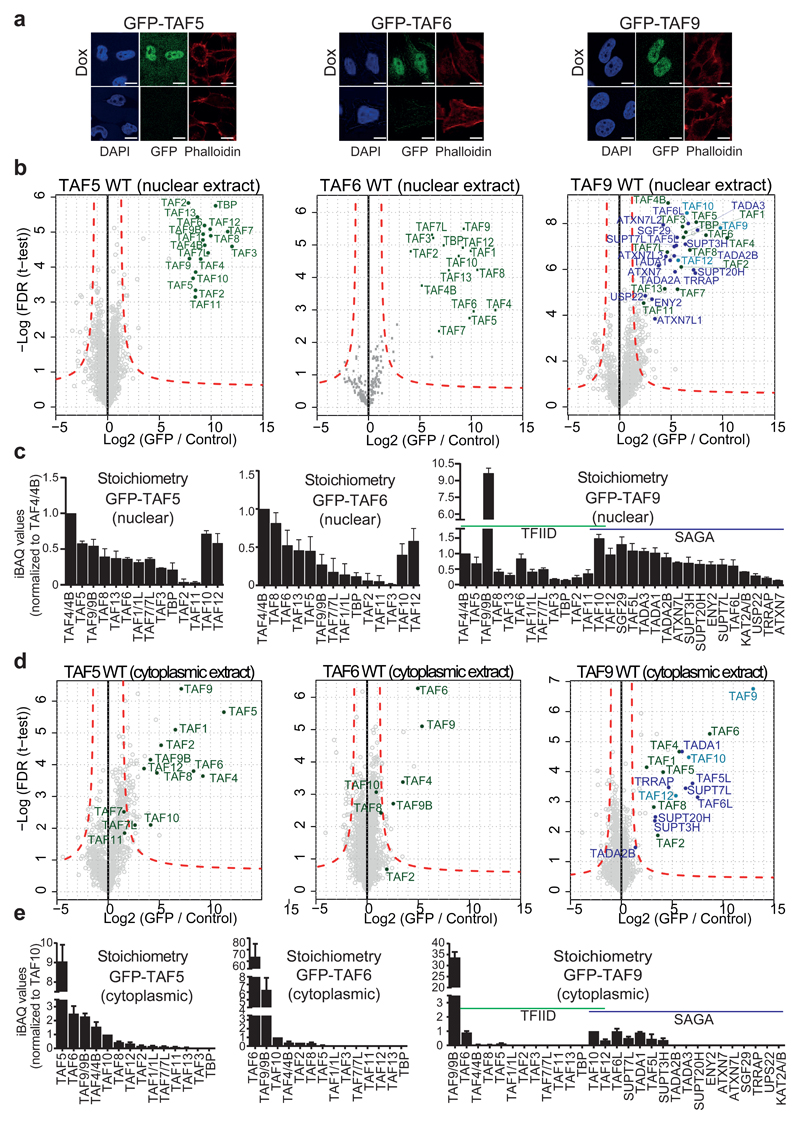
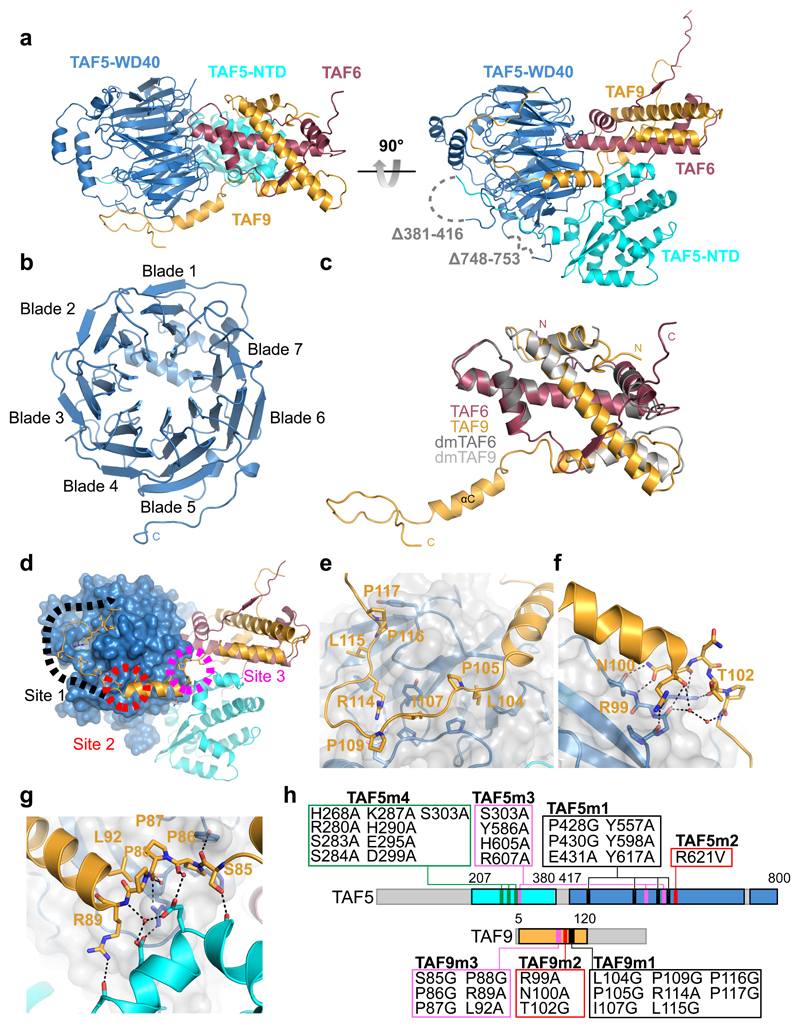
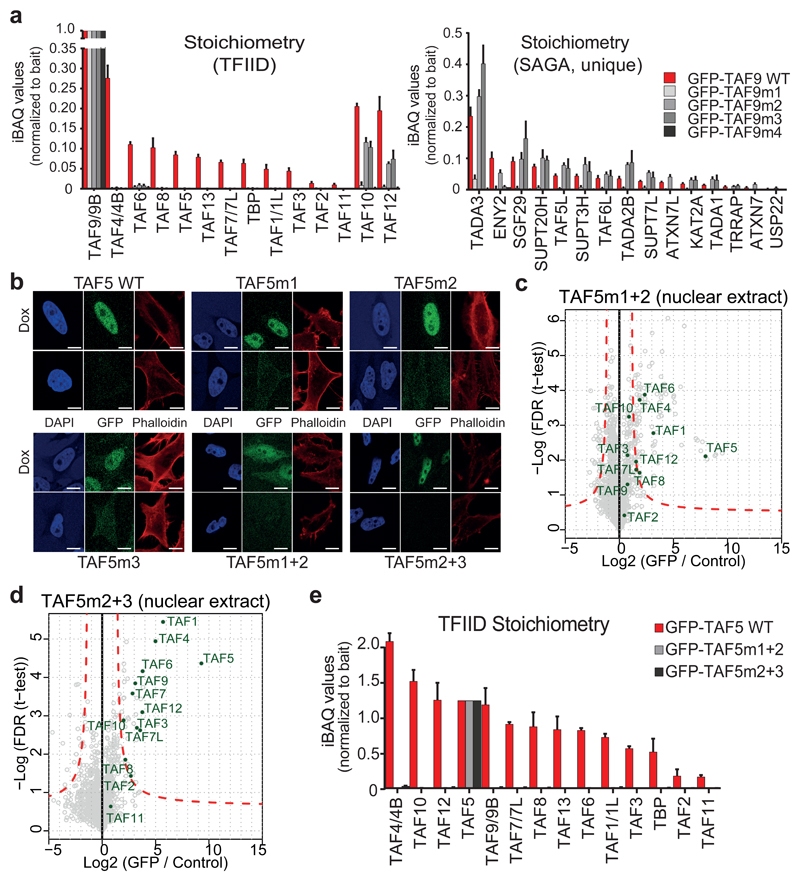
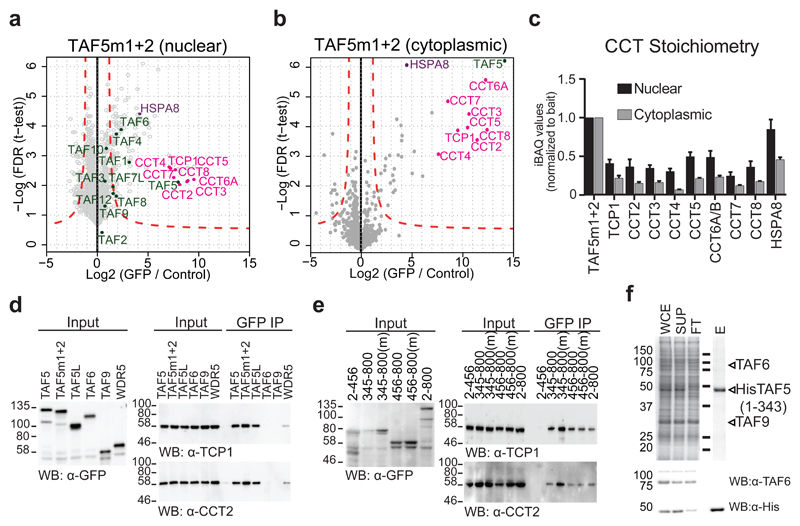
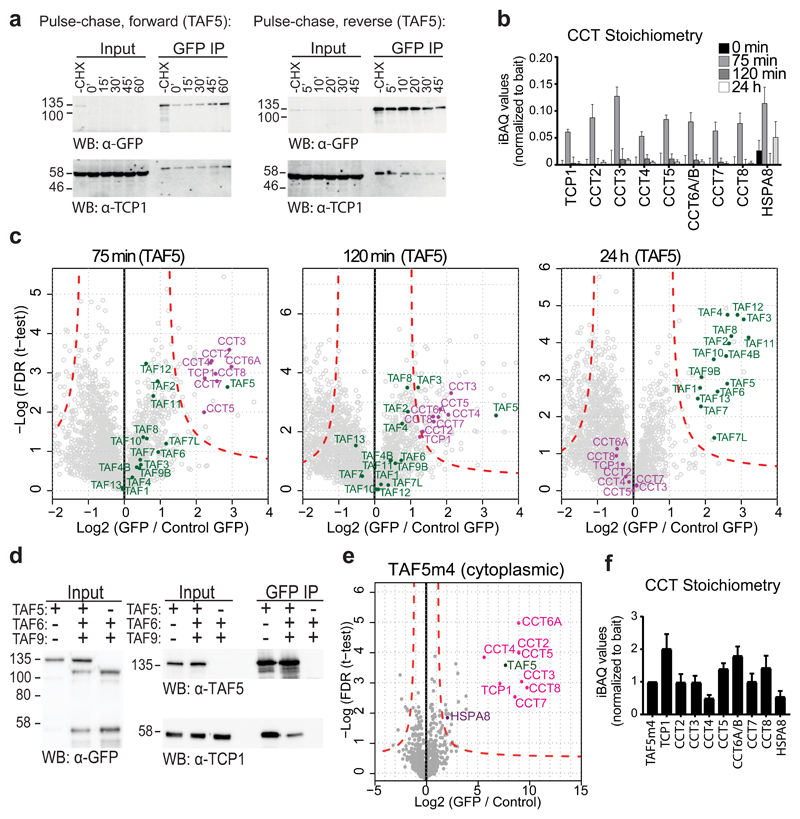
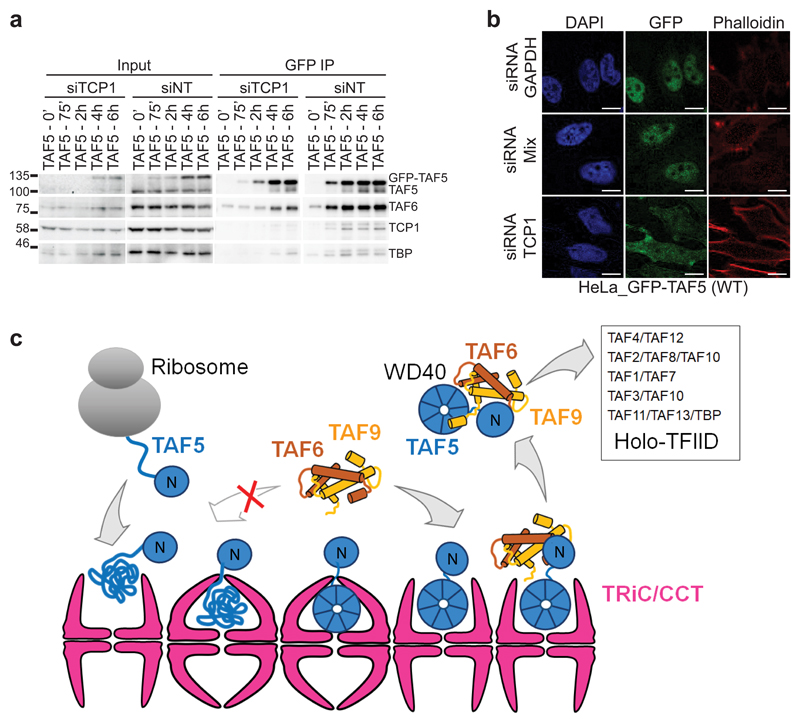
TFIID is a cornerstone of eukaryotic gene regulation. Distinct TFIID complexes with unique subunit compositions exist and several TFIID subunits are shared with other complexes, thereby conveying precise cellular control of subunit allocation and functional assembly of this essential transcription factor. However, the molecular mechanisms that underlie the regulation of TFIID remain poorly understood. Here we use quantitative proteomics to examine TFIID submodules and assembly mechanisms in human cells. Structural and mutational analysis of the cytoplasmic TAF5-TAF6-TAF9 submodule identified novel interactions that are crucial for TFIID integrity and for allocation of TAF9 to TFIID or the Spt-Ada-Gcn5 acetyltransferase (SAGA) co-activator complex. We discover a key checkpoint function for the chaperonin CCT, which specifically associates with nascent TAF5 for subsequent handover to TAF6-TAF9 and ultimate holo-TFIID formation. Our findings illustrate at the molecular level how multisubunit complexes are generated within the cell via mechanisms that involve checkpoint decisions facilitated by a chaperone.


Conflict of interest statement

Competing Interest Statement

The authors declare no competing interests.

Figures

Figure 1
Figure 1. TFIID and SAGA submodules in the cytoplasm.
a, Cellular localization of GFP-TAF5, GFP-TAF9 and GFP-TAF6 by confocal microscopy; scale bar = 10 μm. b, GFP-TAF5 and GFP-TAF6 enrich all TFIID subunits in co-IPs from nuclear extracts; GFP-TAF9 enriches TFIID and SAGA subunits. Subunits unique to TFIID are colored in green, subunits unique to SAGA in purple, shared subunits in blue. Dashed red lines denote threshold between background and significant enrichment (two-tailed t-test; FDR = 1%; S0 =1). Each data point is plotted as average of technical triplicates. c, Relative abundance of TFIID and SAGA subunits from nuclear extracts are shown, normalized to TAF4/4B. Each bar represents an average of technical triplicates. Error bars = s.d. of mean. d, GFP-TAF5 and GFP-TAF6 enrich a subset of TFIID subunits in co-IPs from the cytoplasm; GFP-TAF9 enriches both TFIID and SAGA subunits. Each data point is plotted as average of technical triplicates. e, Relative abundance of TFIID and SAGA subunits in the cytoplasmic co-IPs. Each bar represents an average of technical triplicates. Error bars = s.d. of mean. Source data for c and e are available online.
Figure 2
Figure 2. Crystal structure of TAF5-TAF6-TAF9 complex.
a, The TAF5-TAF6-TAF9 complex is shown in a cartoon representation in two views. The TAF6-TAF9 HFD heterodimer is intimately wedged in between the TAF5 NTD and WD40 repeat domain. TAF5 NTD and WD40 repeat domain are colored in cyan and blue, respectively. TAF6 is colored in red, TAF9 is colored in orange. Disordered loops are drawn as grey dashed lines. b, The TAF5 WD40 repeat domain is viewed from its bottom cavity, adopting a 7-bladed β-propeller. c, Human TAF6-TAF9 superimposed on the TAF6-TAF9 HFD dimer from D. melanogaster (PDBID 1TAF 29). D. melanogaster proteins are colored in grey, human TAF in red and human TAF9 in orange. Note the extended C-terminal domain in human TAF9. d, Overview of the structure with the three major interactions anchoring TAF9 to TAF5.e-g, Zoom-in showing TAF9 C-terminal loop (e), hydrogen-bond network at C-terminus of helix αC (f), and triple proline-turn (g). h, Mutations to probe TAF5-TAF9 interfaces. Colors as in (d); green indicates mutated region in TAF5 NTD targeting TAF5-TAF6-TAF9 interface.
Figure 3
Figure 3. TAF5-TAF9 interfaces probed by mutagenesis and quantitative proteomics.
a, Stoichiometry plots of TFIID and SAGA subunits from GFP-TAF9 co-IPs are shown, normalized to bait protein. Each bar represents an average of technical triplicates. Error bars = s.d. of mean. b, Confocal fluorescence microscopy reveals nuclear localization of all GFP-TAF5 proteins studies except for GFP-TAF5m1+2 which is also present in the cytoplasm; scale bar = 10 μm. c-e, Nuclear Co-IPs of GFP-TAF5, GFP-TAF5m1+2 and GFP-TAF5m2+3 evidence compromised TFIID assembly by the mutants. Each data point in volcano plots is plotted as average of technical triplicates. Dashed red lines denote threshold between background and significant enrichment (two-tailed t-test; FDR = 1%; S0 =1). Each bar in stoichiometry plot represents an average of technical triplicates. Error bars = s.d. of mean. n = 2 independent experimental replicates for the representative GFP-TAF5m1+2 sample. Source data for a and e are available online.
Figure 4
Figure 4. Chaperonin CCT engages TAF5.
a-c GFP-TAF5m1+2 enriches all subunits of CCT in virtually stoichiometric ratios. Chaperonin subunits are colored in magenta, TFIID subunits in green, HSPA8 in purple. Relative stoichiometry is normalized to bait. Each data point in volcano plots is plotted as average of technical triplicates. Dashed red lines denote threshold between background and significant enrichment (two-tailed t-test; FDR = 1%; S0 =1). Each bar in stoichiometry plot represents an average of technical triplicates. Error bars = s.d. of mean. n = 2 independent experimental replicates for the representative GFP-TAF5m1+2 nuclear sample. d, GFP-TAF interactions with CCT in whole cell extract from transient transfection experiments by immunoblot. Input represents 1% of the protein sample used in the co-IPs. Hallmark CCT subunits TCP1 and CCT2 were probed. Technical replicates n = 3. e, Transient transfection experiments with whole cell extract GFP-fusions of WT or m1+2 (m) TAF52-456 (ΔWD40), TAF5345-800 (ΔNTD) and TAF5456-800 (WD40) probed by co-IPs and immunoblot. Technical replicates n = 2. f, Talon pull-down of co-expressed TAF6, TAF9 and truncated TAF5 analyzed by SDS-PAGE (left) and immunoblot (right). WCE stands for whole cell extract, SUP for cleared lysate, FT for flowthrough, E for eluted fraction His for oligohistidine tag. Source data for c are available online. Uncropped blot/gel images are shown in Supplementary Data Set 1.
Figure 5
Figure 5. CCT is required for holo-TFIID assembly.
a, CCT interaction with newly-synthesized GFP-TAF5 was probed by pulse-chase experiments. Input represents 5% of the protein sample used in co-IPs. b, c, Pulse-chase experiment sampled at different time-points. CCT binding to TAF5 peaks at 75 min after inducing GFP-TAF5 expression. Relative abundance was normalized to bait. Baseline was taken at t=0. CCT subunits are colored in magenta and TFIID subunits in green. Each data point in volcano plots is plotted as average of technical triplicates. Dashed red lines denote threshold between background and significant enrichment (two-tailed t-test; FDR = 1%; S0 =1). Each bar in stoichiometry plot represents an average of technical triplicates. Error bars = s.d. of mean. d, Transient co-transfection experiments with GFP-TAF5, GFP-TAF6 and GFP-TAF9 probed by co-IPs and immunoblot. TAF6-TAF9 is required for releasing TAF5 from CCT. Technical replicates n = 2. Uncropped blot/gel images are shown in Supplementary Data Set 1. e, f, qMS analysis of GFP-TAF5m4 co-IPs from cytoplasmic fraction. Stoichiometry plot is normalized to bait. Each data point in volcano plots is plotted as average of technical triplicates. Each bar in stoichiometry plot represents an average of technical triplicates. Error bars = s.d. of mean. Source data for b and f are available online.
Figure 6
Figure 6. CCT chaperonin-assisted early events in TFIID assembly.
a, siRNA-mediated knockdown of CCT subunit TCP1 impedes GFP-TAF5 integration into TFIID. Control cells were treated with a non-targeting siRNA (siNT). Input represent 2% of the protein sample used in each co-IP. Technical replicates n = 2. Uncropped blot/gel images are shown in Supplementary Data Set 1. b, TCP1 knockdown affects nuclear localization of GFP-TAF5; scale bar = 10 μm. Technical replicates n = 2. c, Newly- synthesized TAF5 is captured by the chaperonin (left). The TAF5 N-terminal domain folds autonomously, Folding of the WD40 repeat domain depends on CCT. Release of readily folded TAF5 from the chaperonin requires binding of TAF6-TAF9, resulting in a discrete TAF5-TAF6-TAF9 complex in the cytoplasm. Binding of further TAFs and TBP completes functional holo-TFIID assembly.

References

    1. Roeder RG. Transcriptional regulation and the role of diverse coactivators in animal cells. FEBS Lett. 2005;579:909–915. doi: 10.1016/j.febslet.2004.12.007. - DOI - PubMed
    1. Levine M, Cattoglio C, Tjian R. Looping back to leap forward: transcription enters a new era. Cell. 2014;157:13–25. doi: 10.1016/j.cell.2014.02.009. - DOI - PMC - PubMed
    1. Bieniossek C, et al. The architecture of human general transcription factor TFIID core complex. Nature. 2013;493:699–702. doi: 10.1038/nature11791. - DOI - PubMed
    1. Louder RK, et al. Structure of promoter bound TFIID and model of human pree-initiation complex assembly. Nature. 2016;531:604–609. doi: 10.1038/nature17394. - DOI - PMC - PubMed
    1. Muller F, Zaucker A, Tora L. Developmental regulation of transcription initiation: more than just changing the actors. Curr Opin Genet Dev. 2010;20:533–540. doi: 10.1016/j.gde.2010.06.004. - DOI - PubMed

Publication types

MeSH terms

Substances