. 2018 Dec 3;9(1):4832.
doi: 10.1038/s41467-018-07305-8.

Microbiota-driven interleukin-17-producing cells and eosinophils synergize to accelerate multiple myeloma progression

Affiliations

Microbiota-driven interleukin-17-producing cells and eosinophils synergize to accelerate multiple myeloma progression

Arianna Calcinotto et al. Nat Commun. .

Abstract

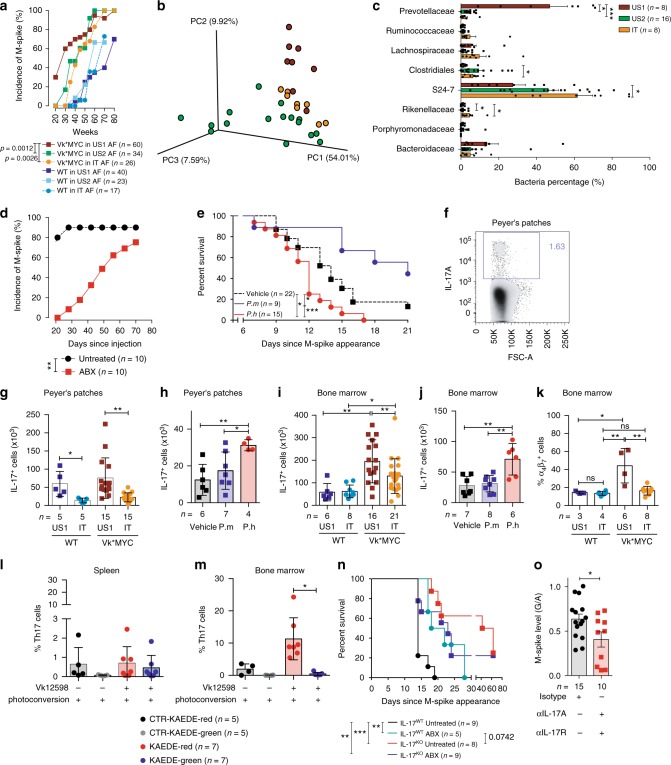
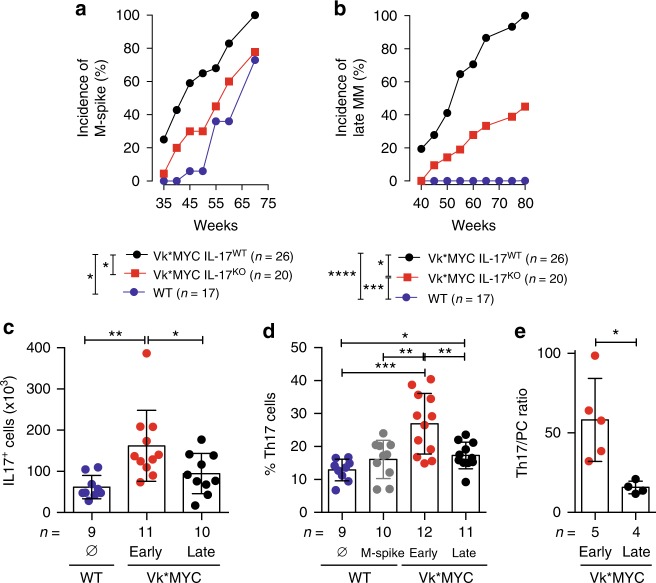
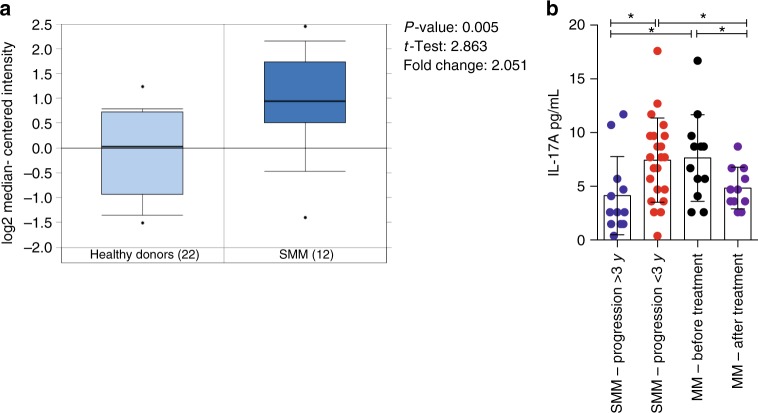
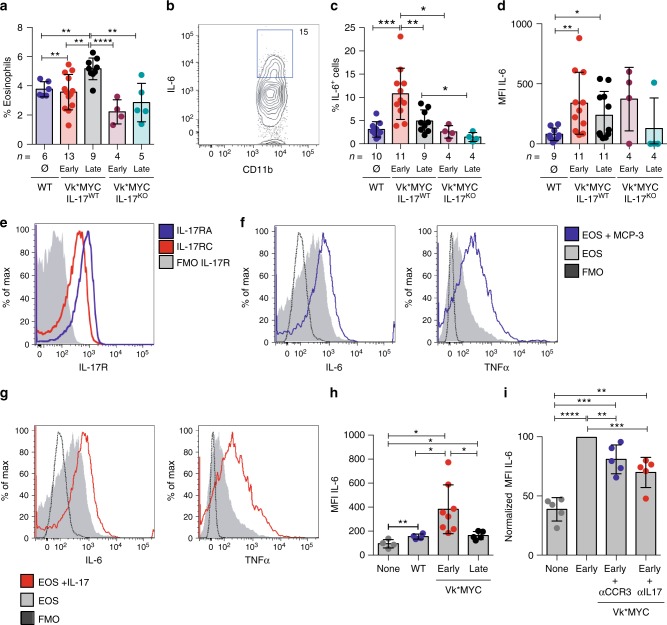
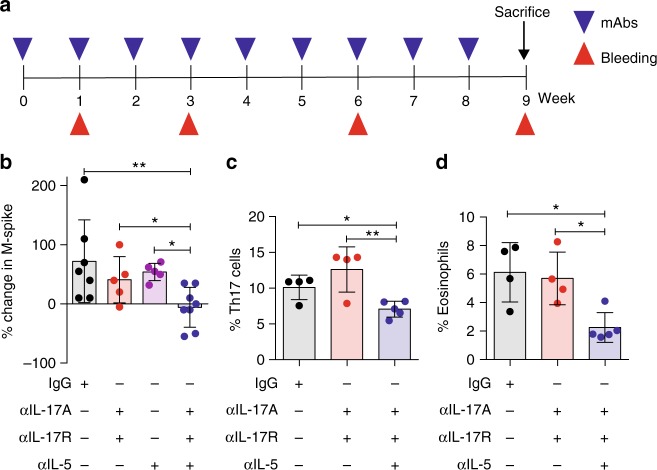
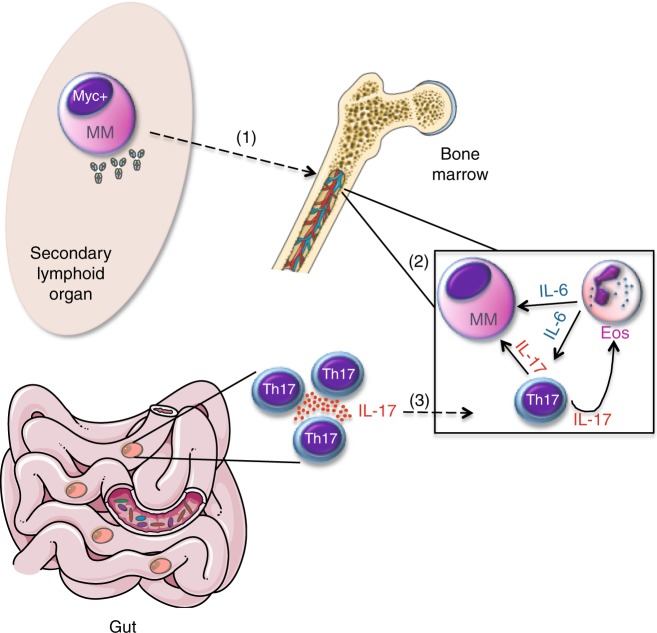
The gut microbiota has been causally linked to cancer, yet how intestinal microbes influence progression of extramucosal tumors is poorly understood. Here we provide evidence implying that Prevotella heparinolytica promotes the differentiation of Th17 cells colonizing the gut and migrating to the bone marrow (BM) of transgenic Vk*MYC mice, where they favor progression of multiple myeloma (MM). Lack of IL-17 in Vk*MYC mice, or disturbance of their microbiome delayed MM appearance. Similarly, in smoldering MM patients, higher levels of BM IL-17 predicted faster disease progression. IL-17 induced STAT3 phosphorylation in murine plasma cells, and activated eosinophils. Treatment of Vk*MYC mice with antibodies blocking IL-17, IL-17RA, and IL-5 reduced BM accumulation of Th17 cells and eosinophils and delayed disease progression. Thus, in Vk*MYC mice, commensal bacteria appear to unleash a paracrine signaling network between adaptive and innate immunity that accelerates progression to MM, and can be targeted by already available therapies.


Conflict of interest statement

The authors declare no competing interests.

Figures

Fig. 1
Fig. 1
P. heparinolytica favors MM progression by promoting BM accrual of IL-17+ cells. a M-spike incidence over time (weeks) in sex-matched Vk*MYC and WT littermates housed in US1, US2 and IT animal facilities (AF) as indicated in the text. Statistical analyses (Two-way ANOVA). b Principal component analysis of fecal microbiota from mice housed in the indicated shelters. c Mean ± SD of eight taxa in fecal microbiota between US1 (n = 8 of biologically independent mice, US2 (n = 16) and IT (n = 8) mice relative to total number of reads recovered from each group. Statistical analyses (One-way ANOVA (Dunn’s multiple comparison test)): *P < 0.05, **P < 0.01, ***P < 0.001. d M-spike incidence over time (days) in t-Vk*MYC MM mice either maintained or not under antibiotics. Unpaired t test: Vehicle vs ABX up to 40 days: *P< 0.05. e Overall survival (Kaplan–Meier plot) of t-Vk*MYC MM mice gavaged with vehicle (Vehicle), P. heparinolytica (P.h) or P. melaninogenica (P.m). log-rank (Mantel–Cox) test: Vehicle vs P.h: P= 0.0157; Vehicle vs P.m: P= 0.0346, P.m vs P.h: P= 0.0002. f Representative dot plot of Peyer’s Patches IL-17+ cells (gated on live cells). gj Number of Peyer’s Patches (g, h) and BM IL-17+ cells (i, j) from mice described in a (g, i) and e (h, j), respectively. k Quantification of α4β7+ cells gated on IL-17+ cells from the same samples shown in i. Mean ± SD of three independent experiments. Unpaired t test: *P < 0.05; **P < 0.01. lm Frequency of KAEDE red positive (black and red columns) and negative (gray and green columns) Th17 cells in the spleen (l) and BM (m) of photoconverted control and diseased Kaede mice. Mean ± SD of three independent experiments. Wilcoxon matched-pairs signed rank test; *P = 0.0156. n Survival (Kaplan–Meier plot) of t-Vk*MYC MM mice IL-17 competent (IL-17WT) or deficient (IL-17KO) and maintained or not maintained under antibiotics. log-rank (Mantel–Cox) test: *P = 0.0332, **P= 0.0021. o M-spike levels are expressed as total gamma globulins/albumin ratio (G/A) in mice within the indicated cohort. Unpaired t-test: *P < 0.05. ae, go n, number of mice used
Fig. 2
Fig. 2
Pro-tumoral role of IL-17 during the early phase of MM. a M-spike incidence over time (weeks) in cohorts of Vk*MYC mice either competent (Vk*MYC IL-17WT) or deficient for IL-17 (Vk*MYC IL-17KO) and WT littermates. Unpaired t test: *P < 0.05. b Incidence of M-spike ≥ 6%, corresponding to symptomatic, Late-MM, in the mice depicted in a. Unpaired t test: *P < 0.05; **P < 0.01; ***P < 0.001; ****P < 0.0001. c, d Absolute numbers (c) and frequency (d) of IL-17+ cells in the BM of Vk*MYC mice and age-and sex-matched WT littermates. Each dot is representative of an individual mouse. Mean ± SD of five independent experiments. Unpaired t test: *P < 0.05; **P < 0.01; ***P < 0.001. e Ratio between Th17 cells and malignant plasma cells (IRF4/MUM1+). Mean ± SD of five independent experiments. Whitney test: *P < 0.0159. ce Specific n values of biologically independent mice are shown
Fig. 3
Fig. 3
IL-17 promotes STAT-3 phosphorylation in Vk*MYC plasma cells. a Th17 polarization of OT-II splenocytes cultured for 7 days with BM serum obtained from WT, Early-MM and Late-MM Vk*MYC mice, and assessed for intracellular cytokine release by flow cytometry. None and Cytokines refer to the culture condition with or without IL-6, TGF-β1, anti-IL-4, and anti-IFN-γ antibodies, respectively. (None n = 3, Cytokine n = 3, WT n = 6, Vk*MYC Early n = 11, Vk*MYC Late n = 11). Mean ± SD of three independent experiments. Unpaired t test: *P < 0.05; **P < 0.01; ***P < 0.001. b Plasma cells were also stained with anti-IL-17RA and anti-IL-17RC antibodies (blue and red line respectively) and analyzed by flow-cytometry; FMO (Fluorescence Minus One) sample was not stained for IL-17R (gray histogram). c, d Representative histograms and e quantification of Vk*MYC PCs cultured in the presence of either one of the following stimuli: saturating amounts of IL6 (light blue line) or IL-17 (dark blue line), or BM sera from Early- (red line) or Late-MM (black dotted line), or BM sera from Early-MM and anti-IL17 antibodies (purple line). After culture, plasma cells were analyzed by flow-cytometry for STAT3 phosphorylation (pSTAT3). (IL-6 n = 5, IL-17A n = 5, Vk*MYC Early n = 8, Vk*MYC Early + αIL-17A n = 8, Vk*MYC Late n = 8). Mean ± SD of triplicate independent determinations. Unpaired t test: *P < 0.05; **P < 0.01; ***P < 0.001; ****P < 0.0001
Fig. 4
Fig. 4
IL-17 levels are increased in the BM of SMM patients rapidly progressing to MM. a mRNA expression of IL-17RA in primary SMM cells of a cohort of 12 newly-diagnosed patients and 22 matched controls (bone marrow) described in ref.. The expression pattern for the probe set 205707_at is shown. Statistical analysis (Student t test) is reported. b IL-17 levels in the BM plasma of SMM patients that progressed to MM within 3 years since the diagnosis (i.e., <3 years), or did not progress to MM in the same time frame (i.e., >3 years). Each dot represents an individual patient. (SMM-Progression > 3 n = 12, SMM-Progression < 3 n = 22, MM-Before treatment n = 12, MM-After treatment n = 11). Data are reported as mean ± SD. Unpaired t test: *P < 0.05
Fig. 5
Fig. 5
An IL-17-eosinophil axis in the BM of Vk*MYC mice favors disease progression. a Frequency of BM eosinophils (i.e., CD11b+Ly6CintMHC-IILy6GSSChi or CD11b+Siglec-F+ cells) in Vk*MYC IL-17WT and Vk*MYC IL-17KO mice and age- and sex-matched WT littermates. Each dot represents an individual mouse. Mean ± SD of five independent experiments. Unpaired t test: *P < 0.05; **P < 0.01; ***P < 0.001; ****P < 0.0001. b Representative dot plot of IL-6+ cells (gated on CD11b+Siglec-F+ cells) in the BM. c Percentage of IL-6+ cells gated on CD11b+Siglec-F+ cells. Mean ± SD of five independent experiments. Unpaired t test. d Mean fluorescence intensity (MFI) of IL-6 within Siglec-F+CD11b+ cells. Mean ± SD of five independent experiments. Unpaired t test. e BM derived eosinophils were also stained with anti-IL-17RA and anti-IL-17RC antibodies (blue and red line respectively) and analyzed by flow-cytometry; FMO (Fluorescence Minus One) sample was not stained for IL-17R (gray histogram). f Representative histograms of IL-6 and TNF-α production by eosinophils after IL-17A stimulation (red line). FMO samples were not stained for IL-6 or TNF-α. g Representative histograms of IL-6 and TNF-α production by eosinophils after MCP-3 stimulation (blue line). FMO samples were not stained for IL-6 or TNF-α. h IL-6 levels (MFI normalized on FMO sample) in eosinophils cultured alone (None; n = 4), or in the presence of WT (n = 4) or Early-MM (n = 8) or Late-MM (n = 5) BM serum. Mean ± SD of aggregated data from three independent experiments. Unpaired t test. i IL-6 levels (MFI normalized on Early-MM sample) in eosinophils cultured alone (None; n = 5), or in the presence of Early-MM with or without the addition of anti-CCR3 (n = 5) or anti-IL-17A (n = 5). Mean ± SD of aggregated data from three independent experiments. Paired t test. a, c, d Specific n values of biologically independent mice are shown
Fig. 6
Fig. 6
IL-17-eosinophil axis neutralization delays disease progression in Vk*MYC mice. a Schematic representation of the experiment. b Percentage change in M-spike in mice within the indicated cohort (Isotype and αIL-17A, αIL-17R, αIL-5: n = 8 mice/group, αIL-17A, αIL-17R and αIL-5: n = 5 mice/group) during the observation period. Frequency of BM Th17 (i.e., CD3+CD4+IL-17+) cells c and eosinophils (i.e., CD11b+Ly6CintMHC-IILy6GSSChi d) was assessed by flow cytometry. Each dot represents an individual mouse. c Mean ± SD of two independent experiment. (Isotype n = 4, αIL-17A, αIL-17R n = 4, αIL-17A, αIL-17R, αIL-5 n = 5). Unpaired t test: *P < 0.05; **P < 0.01. d Mean ± SD of two independent experiment. (Isotype n = 4, αIL-17A, αIL-17R n = 4, αIL-17A, αIL-17R, αIL-5 n = 5). One-way ANOVA P = 0.0101
Fig. 7
Fig. 7
IL-17-producing cells indeuced by gut microbiota favor MM progression. (1) Upon AID-dependent MYC activation in germinal centers, a B cell stochastically acquires the characteristics of malignant plasma cell (MM) and migrates to the BM. (2) Within the BM niche, a favorable cytokine milieu induces Th17 skew and eosinophil (Eos) activation, thus establishing a positive-feedback loop that is self-amplifying, and sustains MM progression. (3) A selected gut microbiota locally favors the expansion of Th17 cells, which migrate to the BM niche, where they further contribute to the eosinophil-Th17-MM cells network

References

    1. Garrett WS. Cancer and the microbiota. Science. 2015;348:80–86. doi: 10.1126/science.aaa4972. - DOI - PMC - PubMed
    1. Schwabe RF, Jobin C. The microbiome and cancer. Nat. Rev. Cancer. 2013;13:800–812. doi: 10.1038/nrc3610. - DOI - PMC - PubMed
    1. Belkaid Y, Hand TW. Role of the microbiota in immunity and inflammation. Cell. 2014;157:121–141. doi: 10.1016/j.cell.2014.03.011. - DOI - PMC - PubMed
    1. Ivanov II, et al. Induction of intestinal Th17 cells by segmented filamentous bacteria. Cell. 2009;139:485–498. doi: 10.1016/j.cell.2009.09.033. - DOI - PMC - PubMed
    1. Gaffen SL, Jain R, Garg AV, Cua DJ. The IL-23-IL-17 immune axis: from mechanisms to therapeutic testing. Nat. Rev. Immunol. 2014;14:585–600. doi: 10.1038/nri3707. - DOI - PMC - PubMed

Publication types

MeSH terms