. 2019 Jan;25(1):103-110.
doi: 10.1038/s41591-018-0267-4. Epub 2018 Dec 3.

Myelodysplastic syndrome progression to acute myeloid leukemia at the stem cell level

Affiliations

Myelodysplastic syndrome progression to acute myeloid leukemia at the stem cell level

Jiahao Chen et al. Nat Med. 2019 Jan.

Erratum in

Abstract

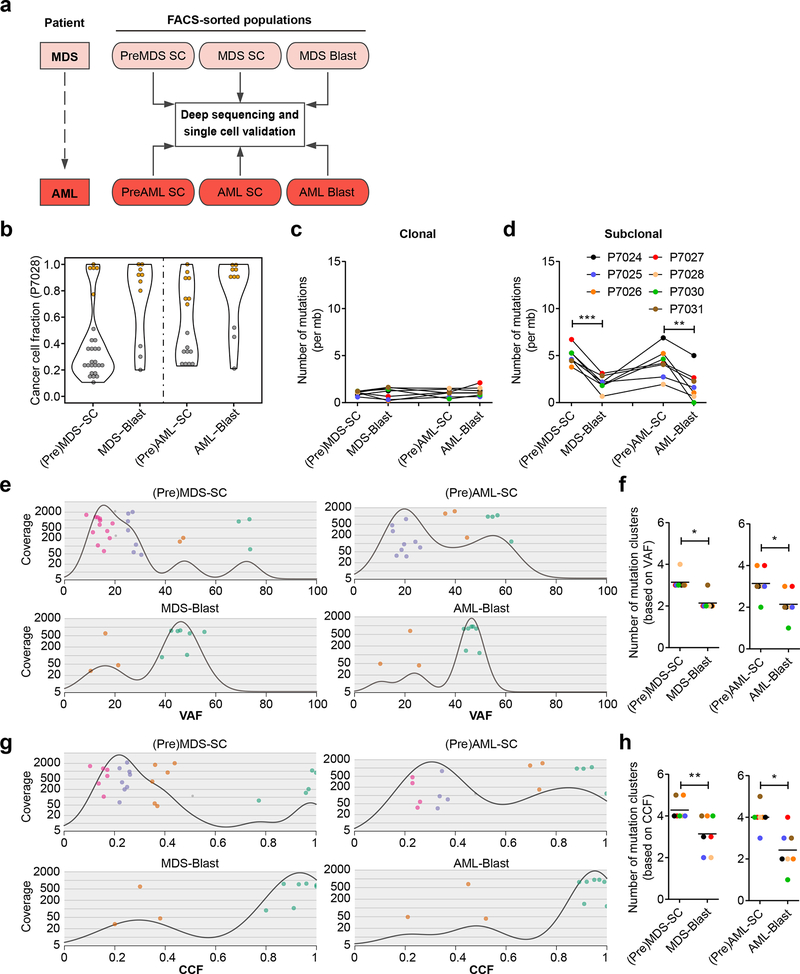
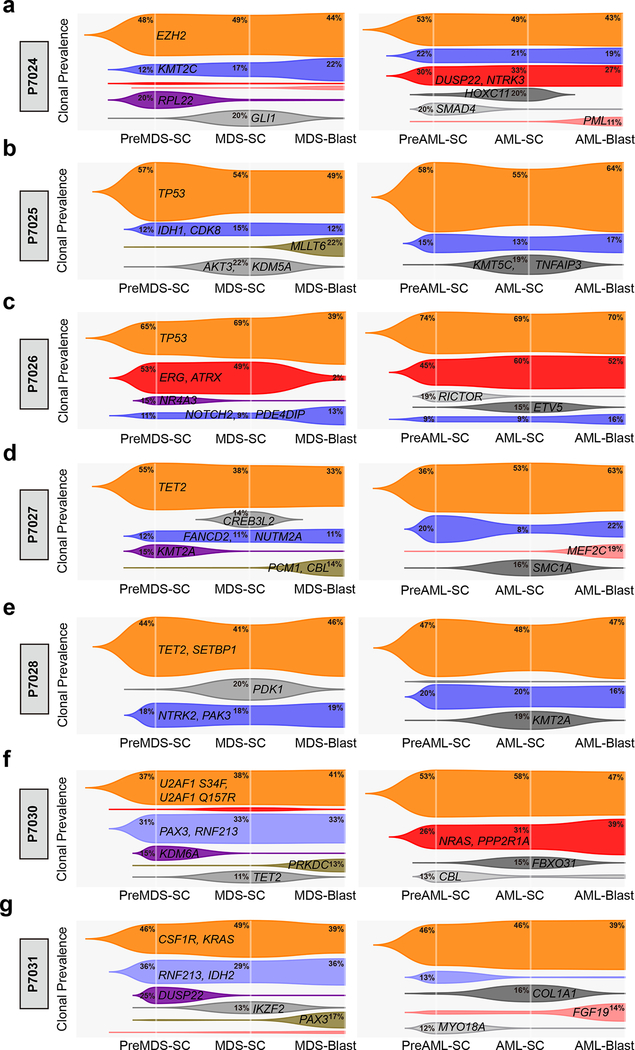
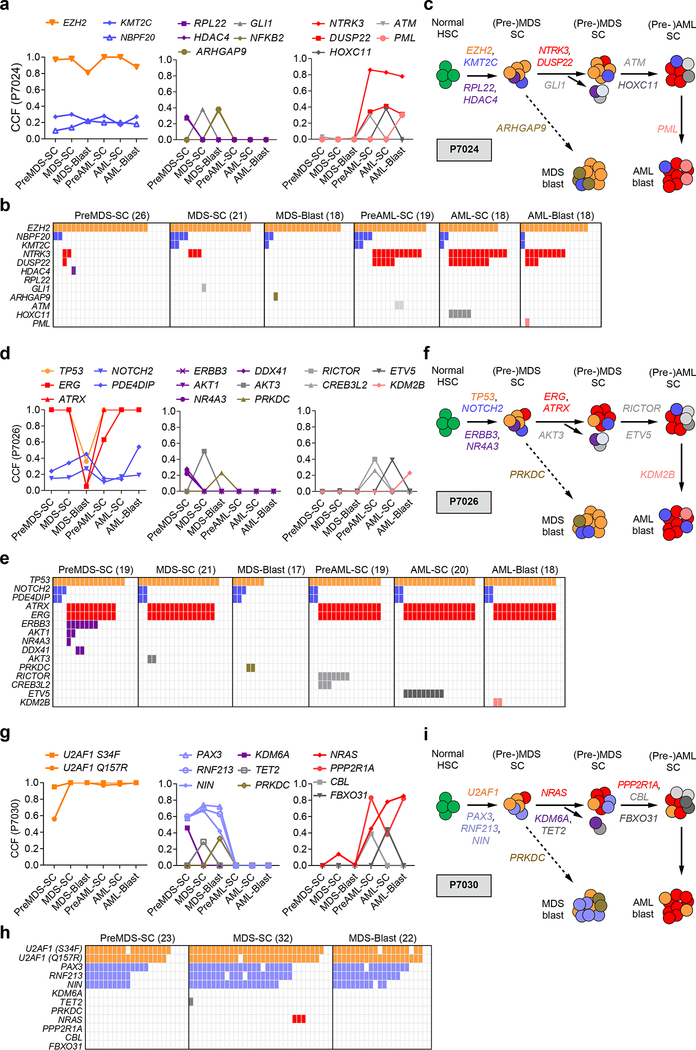
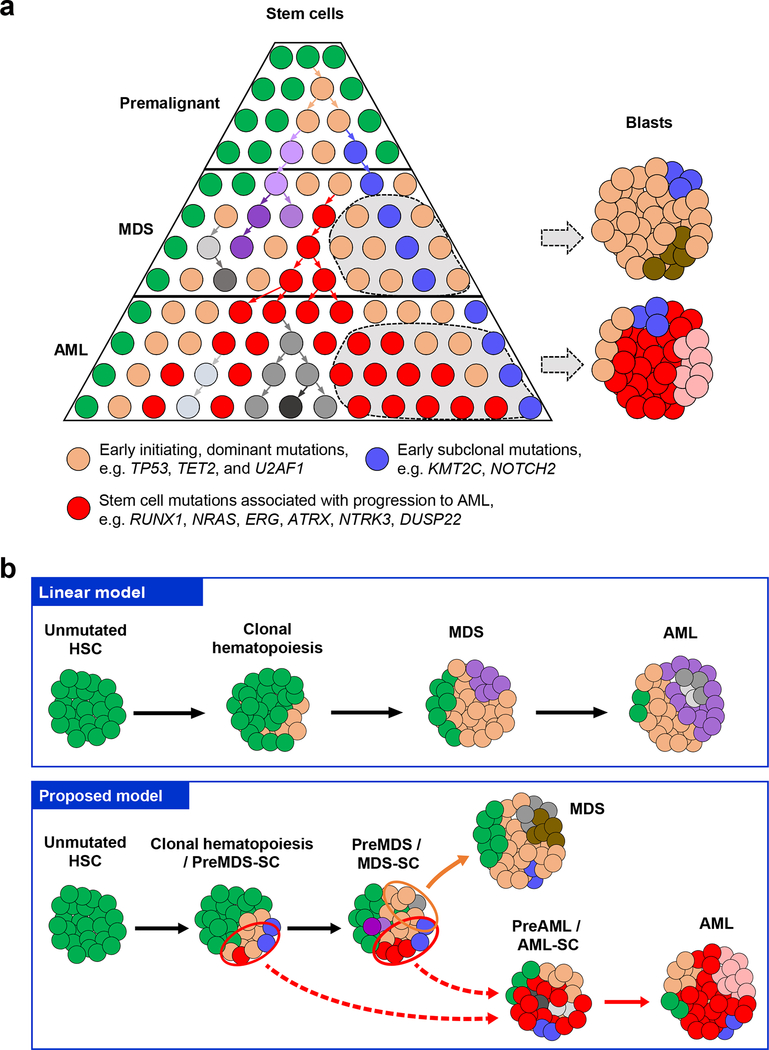
Myelodysplastic syndromes (MDS) frequently progress to acute myeloid leukemia (AML); however, the cells leading to malignant transformation have not been directly elucidated. As progression of MDS to AML in humans provides a biological system to determine the cellular origins and mechanisms of neoplastic transformation, we studied highly fractionated stem cell populations in longitudinal samples of patients with MDS who progressed to AML. Targeted deep sequencing combined with single-cell sequencing of sorted cell populations revealed that stem cells at the MDS stage, including immunophenotypically and functionally defined pre-MDS stem cells (pre-MDS-SC), had a significantly higher subclonal complexity compared to blast cells and contained a large number of aging-related variants. Single-cell targeted resequencing of highly fractionated stem cells revealed a pattern of nonlinear, parallel clonal evolution, with distinct subclones within pre-MDS-SC and MDS-SC contributing to generation of MDS blasts or progression to AML, respectively. Furthermore, phenotypically aberrant stem cell clones expanded during transformation and stem cell subclones that were not detectable in MDS blasts became dominant upon AML progression. These results reveal a crucial role of diverse stem cell compartments during MDS progression to AML and have implications for current bulk cell-focused precision oncology approaches, both in MDS and possibly other cancers that evolve from premalignant conditions, that may miss pre-existing rare aberrant stem cells that drive disease progression and leukemic transformation.


Figures

Fig. 1 |
Fig. 1 |. Higher subclonal diversity at the stem cell level than in blasts in patients with MDS and sAML.
a, Schematics of experimental strategy of deep targeted sequencing and single cell validation of longitudinal, paired samples from patients with MDS who later progressed to secondary AML. Multi-parameter cell sorting was used to fractionate premalignant stem cells (PreMDS-SC, PreAML-SC), malignant stem cells (MDS-SC, AML-SC), and blast populations (MDS blasts, AML blasts). Non-hematopoietic cells (CD45-negative) were used as germline control for detection of somatic mutations and copy number changes. Selected mutations in each population were further examined with single cell sequencing. b, Representative distribution of CCFs in stem cells (preMDS-SC and MDS-SC; or preAML-SC and AML-SC) and blasts of patient P7028, showing that stem cells had more mutations at a lower frequency than blasts for both the MDS and sAML stages, respectively. Violin plot is showing frequency distribution (kernel density) of clonal mutations (orange) and subclonal mutations (grey). c, d, Burden of clonal (c) and subclonal (d) mutations in stem cell and blast populations at the MDS (p=0.0002) and AML (p=0.005) stages across patients (n=7). e, Clonal composition of stem cell and blast populations in MDS (upper left, lower left), and sAML (upper right, lower right), respectively, in patient P7028. Based on the VAFs, mutations covered by >30× are clustered as clones and denoted with the same color. Mutation was denoted with grey if the estimated possibility of the mutation to be clustered in the subclone was lower than 0.95. f, Number of mutation clusters, as estimated by VAFs of mutations, in stem cells and blasts at the MDS (left, p=0.013) and AML (right, p=0.021) stages across all patients studied (n=7). Black line represents the mean of clone numbers across the samples. g, h, Clonal composition of stem cell and blast populations at MDS (left, p=0.0047) and AML (right, p=0.02) estimated by CCFs of mutations (n=7). If not specified otherwise, data are mean ± SEM. *p < 0.05, **p < 0.01, ***p < 0.001 (two-tailed paired Student’s t test).
Fig. 2 |
Fig. 2 |. Schematic models of subclonal evolution of stem cell and blast populations during the progression from MDS to sAML.
a-e, Trajectory of individual clones in the different pre-malignant and malignant stem cell and blast populations at the MDS (left) and sAML (right) stages in individual patients. (a) Patient P7024, (b) patient P7025, (c) patient P7026, (d) patient P7027, (e) patient P7028, (f) patient P7030, and (g) patient P7031. Clonal prevalence was defined as the mean of VAFs of mutations (as shown) in the clone estimated by SciClone. Relative clonal prevalence within the same cell population is depicted on the Y-axis in the plots. Phylogenetic relationships of different cell populations were inferred by LICHeE and visualized by Timescape R package. Same clones in MDS and sAML are shown with the same color within each stem or blast population of the same patient, indicating the dynamics of clonal architecture in different cell populations, as well as longitudinal clonal evolution following progression from MDS to sAML. Clone is shown if the frequency is >1% in at least one of the three populations at MDS or sAML stages. And representative mutated genes in each clone are indicated.
Fig. 3 |
Fig. 3 |. Spatiotemporal subclonal evolution during the progression from MDS to sAML determined by single cell sequencing of sorted stem and blast cells.
a, CCFs of shared (left), MDS-specific (middle), AML specific (right) mutations across all cell populations in patient P7024. b, Single cell targeted sequencing of mutations across different cell populations of patient P7024. Each column represents the sequencing results of one single cell of the indicated cell population (preMDS-SC, MDS-SC, MDS-blasts, preAML-SC, AML-SC, AML-blasts), and the number of single cells tested in each population is shown in parentheses. The occurrence of a mutation in a single cell is indicated with the same color as in (a). c, Schematic model of clonal evolution in different stem and blast cell populations in patient P7024. Mutations in EZH2 were acquired early in the founding clone at the MDS stage, and acquisition of additional mutations in NTRK3 and DUSP22 contributed to the progression to sAML, while MDS blasts were characterized by different co-mutations. In this patient sAML developed from a rare subclone contained within MDS stem cells, and not through further evolution of MDS blasts. d, CCFs of shared (left), MDS-specific (middle), AML specific (right) mutations across all cell populations in patient P7026. e, Single cell targeted sequencing of mutations across different cell populations of patient P7026. f, Schematic model of clonal evolution in different stem and blast cell populations in patient P7026. Data again indicate that the dominant clone present in sAML stem and blast cells developed from a clone within the MDS stem cells that was nearly undetectable in MDS blast, indicating a crucial role of MDS stem cells in sAML initiation. g, CCFs of shared (left), MDS-specific (middle), AML-specific (right) mutations in different stem and blast populations at the MDS and sAML stage of patient P7030. h, Single cell targeted sequencing of mutations across different cell populations of patient P7030. i, Schematic model of clonal evolution in different stem and blast cell populations in patient P7030. Subclones of MDS stem cells with early founding mutations (i.e. U2AF1) remained present during MDS blast generation as well as AML progression, whereas other mutations, e.g. PAX3, RNF213, NIN and KDM6A, only occurred in MDS but not during progression to sAML. Progression to sAML originated from a subclone of MDS stem cells with NRAS mutation.
Fig. 4 |
Fig. 4 |. Proposed model of subclonal evolution of stem cells during the progression of MDS to sAML.
a, Our results suggest a model of non-linear clonal evolution arising from the stem cell level during development of MDS and progression to sAML. Accumulation of mutations in stem cell compartments gives rise to a highly diverse subclonal architecture (indicated by different colors) in MDS stem cells. Certain subclones (orange, e.g. with TP53, TET2, or U2AF1 mutations, ‘clonal hematopoiesis’) provide a shared basis for both MDS development (MDS blasts) as well as formation of preAML- and AML-stem cells. However, preMDS- or MDS-stem cells acquire different additional mutations which then drive MDS blast formation, or progression to sAML, respectively, in a non-linear and rather parallel manner in all patients studied. In four (P7024, P7026, P7027, and P7030) out of seven cases studied, we identified that the dominant clone at the sAML stage originated from a clone (red, e.g. with RUNX1, NRAS, or ERG and ATRX mutations) that was detectable in preMDS- and/or MDS-stem cells, but was undetectable in MDS blast cells. These results indicate that MDS stem cells leading to the generation of MDS blast can be different from those contributing to the progression to sAML, highlighting a crucial role of the entirety of the diverse MDS stem cell pool in sAML disease progression, which has implications for current bulk cell-focused diagnostic and therapeutic precision oncology approaches. b, Schematics of different models of MDS and sAML development and progression. In comparison to the linear model (top panel), which has been proposed based on bulk sequencing and suggests serial mutation accumulation during disease progression, our data support a model of parallel clonal evolution at the stem cell level during development of MDS and progression to sAML (bottom panel). 7 out of 7 cases showed a highly diverse pool of (Pre-)MDS stem cells as the basis of MDS and sAML development; in 4 out of 7 patients we found very early branching at the MDS stem cell level towards progression to AML stem cells leading to distinct clonal composition between MDS and AML bulk cells, 3 out 7 patients showed a pattern of slightly later branching (dashed red arrows) leading to more similar clonal composition between MDS and AML bulk cells compared to the early branching cases.

References

    1. Greenberg PL, et al. Revised International Prognostic Scoring System for Myelodysplastic Syndromes. Blood 120, 2454–2465 (2012). - PMC - PubMed
    1. Ades L, Itzykson R & Fenaux P Myelodysplastic syndromes. Lancet 383, 2239–2252 (2014). - PubMed
    1. Fialkow PJ, et al. Clonal Development, Stem-Cell Differentiation, and Clinical Remissions in Acute Nonlymphocytic Leukemia. New Engl J Med 317, 468–473 (1987). - PubMed
    1. Nilsson L, et al. Involvement and functional impairment of the CD34(+)CD38(−)Thy-1(+) hematopoietic stem cell pool in myelodysplastic syndromes with trisomy 8. Blood 100, 259–267 (2002). - PubMed
    1. Steidl U, et al. Essential role of Jun family transcription factors in PU.1 knockdown-induced leukemic stem cells. Nat Genet 38, 1269–1277 (2006). - PubMed

Publication types